Mobile App Analytics Best Practices: What Top Apps Are Doing Differently


Most product teams get mobile app analytics wrong.
They track 47 different key performance indicators (KPIs) in their mobile analytics platform, spend hours debating dashboard numbers, yet can’t predict which users will churn next week
The problem here isn’t a lack of data. Teams are drowning in the wrong usage metrics while missing important behavioral data signals.
86% of leaders agree that this data overwhelm leads to less confidence in decisions.
So, here are eight mobile app analytics best practices that help you filter the noise and make the most of the data you collect.
1. Set clear goals before getting into the analysis
Analytics backwards looks like this: track first with mobile app analytics tools, find patterns later.
Analytics forwards starts with understanding user psychology.
You see, users don’t follow the linear paths designed for them.
Instead, they juggle Slack notifications, apps, coffee runs, and kids asking for snacks. The cognitive load theory indicates that they have already reached maximum mental capacity before even launching your app.
To accommodate this distracted usage, you need to change how you approach analytics.
For instance:
- Meditation apps tracking session duration may think longer equals better, which is incorrect. But in this case, extended sessions signal anxiety and lack of focus, not engagement.
- Banking apps celebrating feature adoption miss the point of their mobile applications. Users need the fewest possible taps to complete their goal and quickly exit the app.
To avoid inaccurate conclusions, you need a goal before you begin tracking.
Here’s what goal-based analysis would look like.
For a productivity app, tracking distraction-free usage patterns, instead of just the total time spent, helps confirm that your users are achieving the end goal that your app was designed for.
This thoughtful approach to tracking key metrics solves the decision paralysis hitting 72% of leaders who admit that the volume of app data has paralyzed their decision-making.
2. Map out the user journey so no key touchpoints are missed
On average, Americans check their phones 144 times daily, creating fragmented mobile app usage patterns
Your mobile app competes for that fragmented attention every single time users interact with their devices.
Mobile users also carry something called attention residue.
That’s a brain science term for “pieces of attention staying stuck on the last thing they did.” So someone switching from urgent Slack messages to your app isn’t fully present yet.
If you want to make the most of this fragmented, disconnected customer journey, you want to understand every single touchpoint and visualize the journey to identify the story behind it.
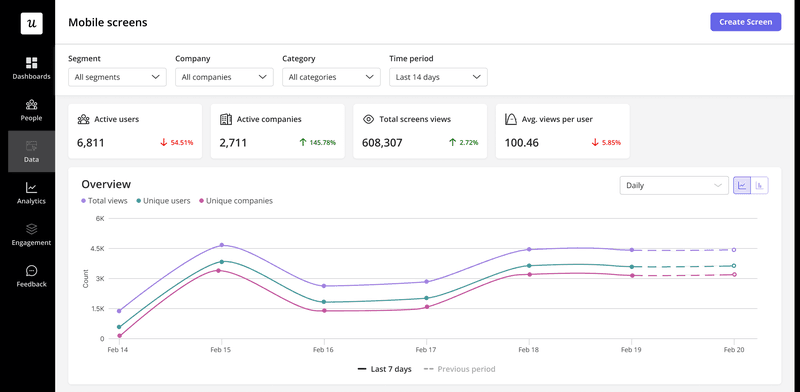
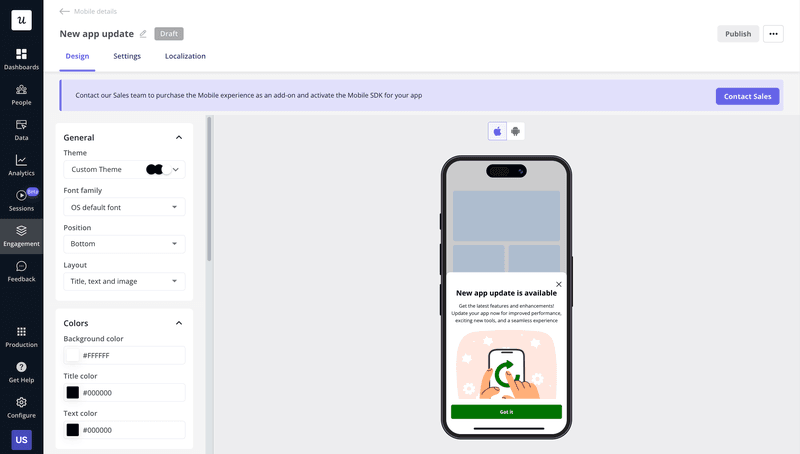
Userpilot’s mobile app analytics helps you tag individual screens and track detailed interactions to see mobile app performance patterns clearly across the entire user journey.
It shows you which screens users spend the most time on, where they consistently drop off, and how they navigate through your app.
This granular tracking exposes the psychological context surrounding app usage.
For instance, users arriving from push notifications exhibit different interaction patterns than users opening apps during planned breaks. The notification-driven users move faster through screens, seeking the specific information promised in the alert before their attention shifts elsewhere.
A user abandoning signup and completing it 3 days later doesn’t signal a UX issue. It could simply be a timing issue for them.
That’s why you want to deeply understand the full customer journey.
3. Track a set of 3-5 metrics at a time instead of relying on one
Single metric analysis shows you an incomplete picture of user engagement and your app’s performance
The reason someone might want to track a single metric is clear: they want simple cause-and-effect stories. One metric showing growth feels like progress.
For example, a customer acquisition cost (CAC) of $12 per install may seem impressive at a glance.
But combining related metrics helps ensure you’re not overlooking the critical aspects of your app performance.
Put user acquisition costs together with customer lifetime value ($8) and 30-day retention (22%), and it’d suddenly be clear that you’re bleeding money on users who vanish before covering acquisition costs.
To make the most of your data, you need a triangulated (or pentagon-ulated?) approach with 3-5 correlated metrics that give a holistic view of your app’s performance.
4. Focus on actionable metrics over vanity ones
When trying to pick the 3-5 best metrics, make sure you avoid vanity metrics.
Vanity metrics are numbers that look impressive but don’t predict user behavior or drive business decisions. These metrics make teams feel good about performance without revealing any insights on what users could do next. Some common vanity metrics include app downloads, page views, and social media followers, depending on your mobile marketing strategy and business model.
Constrain yourself to extremely specific, actionable metrics that can help boost user engagement.
Here’s a framework you can use to filter the vanity metrics:
- Start with the money metric. What directly drives revenue? Subscriptions? In-app purchases? Premium upgrades? Write it down.
- Work backwards three or four steps. What happens right before money changes hands? What happens before that? And before that? You’re hunting for the psychological journey leading to payment.
- Find the emotional trigger points. Users don’t buy features, they buy outcomes. For example, Headspace users don’t want meditation features; they want to feel calmer. What emotional state drives conversion in your app? Confidence? Urgency? Relief?
- Test for interconnection. Your metrics should influence each other. If Metric A goes up, does Metric B predictably change? If not, you’re tracking disconnected vanity numbers.
To ensure you got the right metric, ask yourself this validation question:
Can you predict next month’s revenue using only these 3-5 metrics?
If yes, you’ve found gold. If no, keep filtering.
For instance, a fintech app could track successful money transfers using product analytics. That’s when you know users trust you with their finances. Or a fitness app can focus on weekly active users logging meals, so you know the habit formation has begun.
Put simply, stop trying to track what happened. Start tracking what can predict the next action.
The metrics you identify here reflect your app’s unique value proposition and business model to help you make immediate decisions.
5. Go beyond mobile data and embrace cross-platform analytics
Even if you’re tracking the perfect metrics, there’s an important factor to consider: cross-platform app use.
Your users will switch between devices given a choice. They’re choosing the right tool for the task.
And understanding this choice is why cross-platform analytics matter more than tracking isolated metrics.
Consider a finance app: When users submit expense receipts, they’re likely on mobile. They’re capturing receipts on the go, inputting simple details while the transaction is fresh.
But when they compile their monthly expense report, they switch to a web or desktop app. The complexity of reviewing, categorizing, and submitting detailed reports demands a larger screen and a full keyboard.
This isn’t inconsistent user behavior but intelligent task optimization.
Single-platform mobile app analytics would show these as disconnected user journeys, missing valuable insights about how existing users engage across platforms. Cross-platform analytics reveals the logical progression from mobile capture to web completion.
Userpilot’s product analytics shows you the full picture by tracking user behavior across both mobile and web.
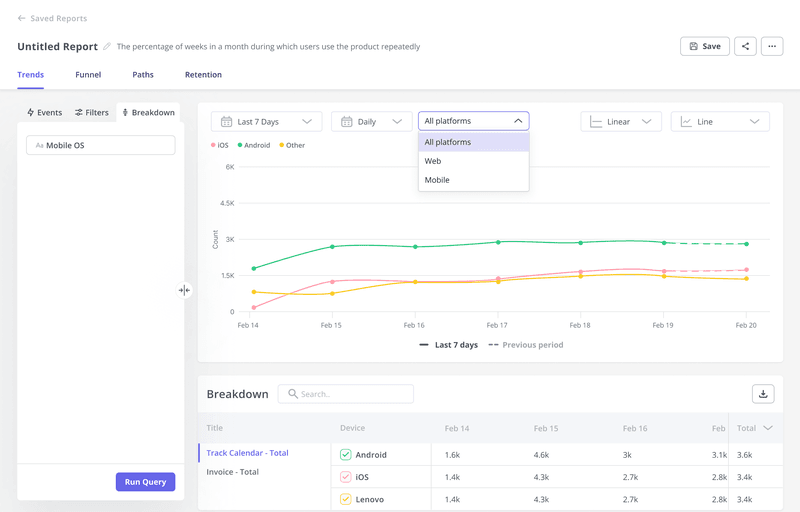
Here’s what unified tracking reveals about user intent:
- Task-device alignment patterns. Users naturally gravitate toward mobile for quick actions (checking balances, taking photos) and web for complex tasks (filing taxes, writing reports). Understanding this flow helps you optimize each touchpoint for its natural strengths rather than forcing identical experiences everywhere.
- Completion pathways. A user who “abandons” mobile checkout might be switching to desktop for security reasons or easier form completion. Without cross-platform visibility, you’d optimize mobile checkout when you should optimize the handoff between platforms.
- Feature adoption context. A feature that seems unsuccessful on mobile might be one of the popular features on the web because it serves a different user need in each environment. Rather than questioning the feature’s value, question its placement.
Userpilot helps you see this complete user story at a glance while also simplifying your data stack – a true win-win.
6. Complement behavioral data with qualitative insights
You have the right data. But quantitative metrics only answer the “What” and “When” about your users and their preferences. You can identify what a user clicked, how long they stayed, and when they left.
But behavioral analysis complements the metrics, helping you understand the “why” behind their behavior.
For instance, why did the user leave?
- Did they not like the page?
- Is there something missing?
- Did they just get distracted?
This gap between user behavior and intention creates massive blind spots, which can be fixed with user feedback and qualitative data:
- Users complete onboarding (positive metric) while feeling confused and planning deletion (negative intention).
- High session times masking frustration and task failure and impacting user satisfaction.
- Feature adoption hiding user workarounds for broken functionality.
Here’s how to layer qualitative methods for deeper insights:
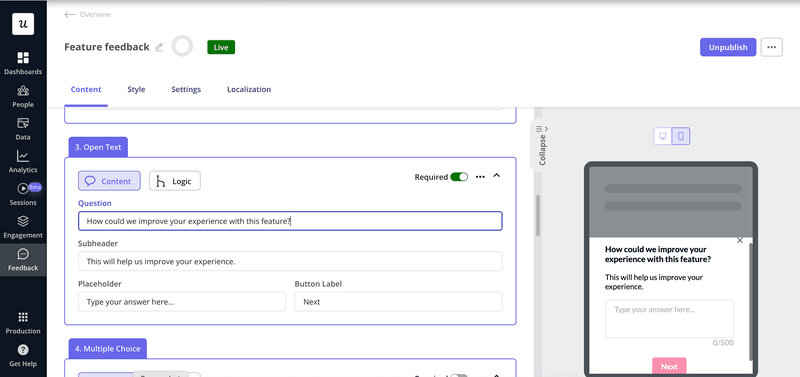
- Surveys offer the fastest, most scalable feedback loop. Ask targeted questions about specific experiences right when they happen. Userpilot’s survey tools help you trigger contextual surveys when users experience friction, like asking if they need help when they spend too long on a page.
- User interviews dig deeper into goals, frustrations, and mental models. For instance, mobile app analytics may show users spending more time, but user interviews confirm they have a difficult time finding what they need. And we know recruiting users for interviews is difficult. But with Userpilot’s in-app messaging and survey tools, you can ask a user to opt in for an interview at moments when they’re most likely to say yes (success or common frustration points).
- Usability testing reveals where users struggle. For instance, you might discover that the navigation you considered “intuitive” actually requires users to spend a lot of time figuring out the basics. And that would explain your high session duration but task completion is low.
- Session replays connect actions to motivations. “Wouldn’t we love to be a fly on the wall as our product is used in the wild?” Session replays give you exactly this capability. Watching users click buttons or repeatedly try actions reveals usability issues that pure analytics simply cannot capture. You can see usability issues at scale and fix them before they become a large-scale problem.
The real magic happens when you layer these insights and use the combined insights to build out a product development roadmap.
7. Democratize mobile analytics data across the organization
You’ve built the complete picture through cross-platform analytics and qualitative insights.
But when only the analytics team can interpret data, progress gets blocked, product decisions slow down to a crawl, and teams spend time debating what the numbers actually mean.
The reality is that data won’t make decisions for you. It can be skewed and misinterpreted.
That’s why everyone needs to engage with the data and collectively challenge insights.
The democratization framework that works:
- Tell stories, not statistics. Instead of saying “DAU: 47,329,” say “Daily active users increased 12% this week, driven by the new tutorial flow.” Non-technical team members shouldn’t need data science degrees to understand these simple numbers.
- Create team-specific views. Marketing needs to see the acquisition costs. Product wants feature adoption rates. Customer success tracks engagement patterns. Each team should see data that drives their specific decisions.
- Challenge insights together during standups. When mobile app analytics become part of weekly meetings, you’ll see collective intelligence emerge through the discussions. For instance, customer success can spot patterns that product teams missed. Or the marketing team discovers why features aren’t adopted.
Userpilot’s dashboards let teams build custom views while maintaining consistent definitions across the organization.
This reduces the cognitive effort required for insight extraction, making teams more likely to use mobile app analytics for daily decisions.
8. Act on user behavior insights promptly
Once the team has access to data, they need to begin acting upon it. But the biggest factor in delaying action is dependency.
Think about it: If you had to add an in-app survey, you’d need tech help. That takes time. Even if you could do it yourself, you must now work with disparate tools and handle the data fragmentation between multiple tools. Analytics live in one platform, messaging capabilities in another, and product development in a third system.
This fragmentation adds extra steps to analysis and creates cognitive friction that delays implementation.
The solution is to eliminate the gap between insight discovery and solution deployment.
Userpilot combines analytics data discovery with immediate solution deployment.
When mobile app analytics show users abandoning a new feature after 30 seconds, you or anyone on your team with access can immediately create contextual mobile slide-outs that appear when users interact with that feature.
You can:
- A/B test micro-interactions based on cognitive load theory.
- Identify behavioral nudges triggered by real-time engagement patterns.
- Provide contextual guidance responding to specific user psychological states.
- Design and deploy mobile slideouts that provide contextual guidance when users encounter friction points.
This ease of deployment helps you move from “we should do something about this” to “we’re testing a solution” in the same day.
The competitive advantage isn’t simply hoarding insights. The true competitive advantage is in implementing solutions while competitors schedule meetings to discuss what their data means.
Supercharge your mobile app analytics with Userpilot
There’s no “perfect” mobile app analytics approach that’d work for every team. What works for your company may be overkill or insufficient for others.
But what’s universal is knowing what you want to predict, who needs access to insights, and how quickly you can act on them. Whether you care most about reducing churn, improving onboarding, or boosting feature adoption, the principles we’ve covered will get you there.
And if you’re looking for something that combines mobile and web analytics with the ability to immediately act on insights, it’s worth exploring Userpilot.
You can book a Userpilot demo to see how focused product analytics drives real user behavior changes!
About the author