Customer Journey Touchpoints in 2026: Why Most Teams are Optimizing the Wrong Ones


The average B2B SaaS deal involves 266 customer journey touchpoints across the full buying journey, according to HockeyStack. For contracts worth $100,000 or more, the number of touchpoints climbs to 417. I used to think good journey mapping meant getting as close to the full picture as possible: find every touchpoint, track every interaction, optimize everything in parallel.
That framing is wrong, and it burns teams that follow it.
Here’s what changed my mind:
Gartner’s 2025 B2B Buyer survey found that 61% of buyers now prefer a completely rep-free experience, and the first meaningful sales contact happens around the 61% mark of the buying journey on average. Most of the touchpoints that actually shape the shortlist (Slack discussions, peer DMs, G2 reviews, LLM-generated comparisons) are happening in channels your CRM has never logged.
Forrester’s 2026 Buyers’ Journey Survey found that 92% of B2B buyers already have at least one vendor in mind before they start any formal evaluation.
This means the shortlist forms before you even know the buyer exists. In other words, you’re optimizing the fraction of touchpoints you can see, while the decisions get made in the fraction you can’t.
The teams winning retention and expansion in 2026 got honest about which touchpoints they actually own, which ones they can only influence, and which ones they have to accept they’ll never have visibility on. Then they invested disproportionately in the owned category, where every improvement compounds directly into KPIs like activation, adoption, and revenue.
I wanted to write something more useful than yet another touchpoint taxonomy. So this guide does four things:
- Introduces a three-tier classification model (owned, partner-managed, dark) that makes prioritization actionable rather than overwhelming.
- Shares the 2026 benchmark data you need to calibrate expectations.
- Explains the signal-continuity principle: how to connect touchpoints so each one passes information forward to the next.
- Gives you a prioritization matrix for deciding what to fix first.

What are customer journey touchpoints?
A customer journey touchpoint is any moment of contact between a prospect/customer and your brand, product, or content. In SaaS, these range from a Google Ad impression to an in-app tooltip shown after a user’s first feature activation. They span marketing, product, and customer success. Most of them leave a trace, though not all traces are visible to the same team.
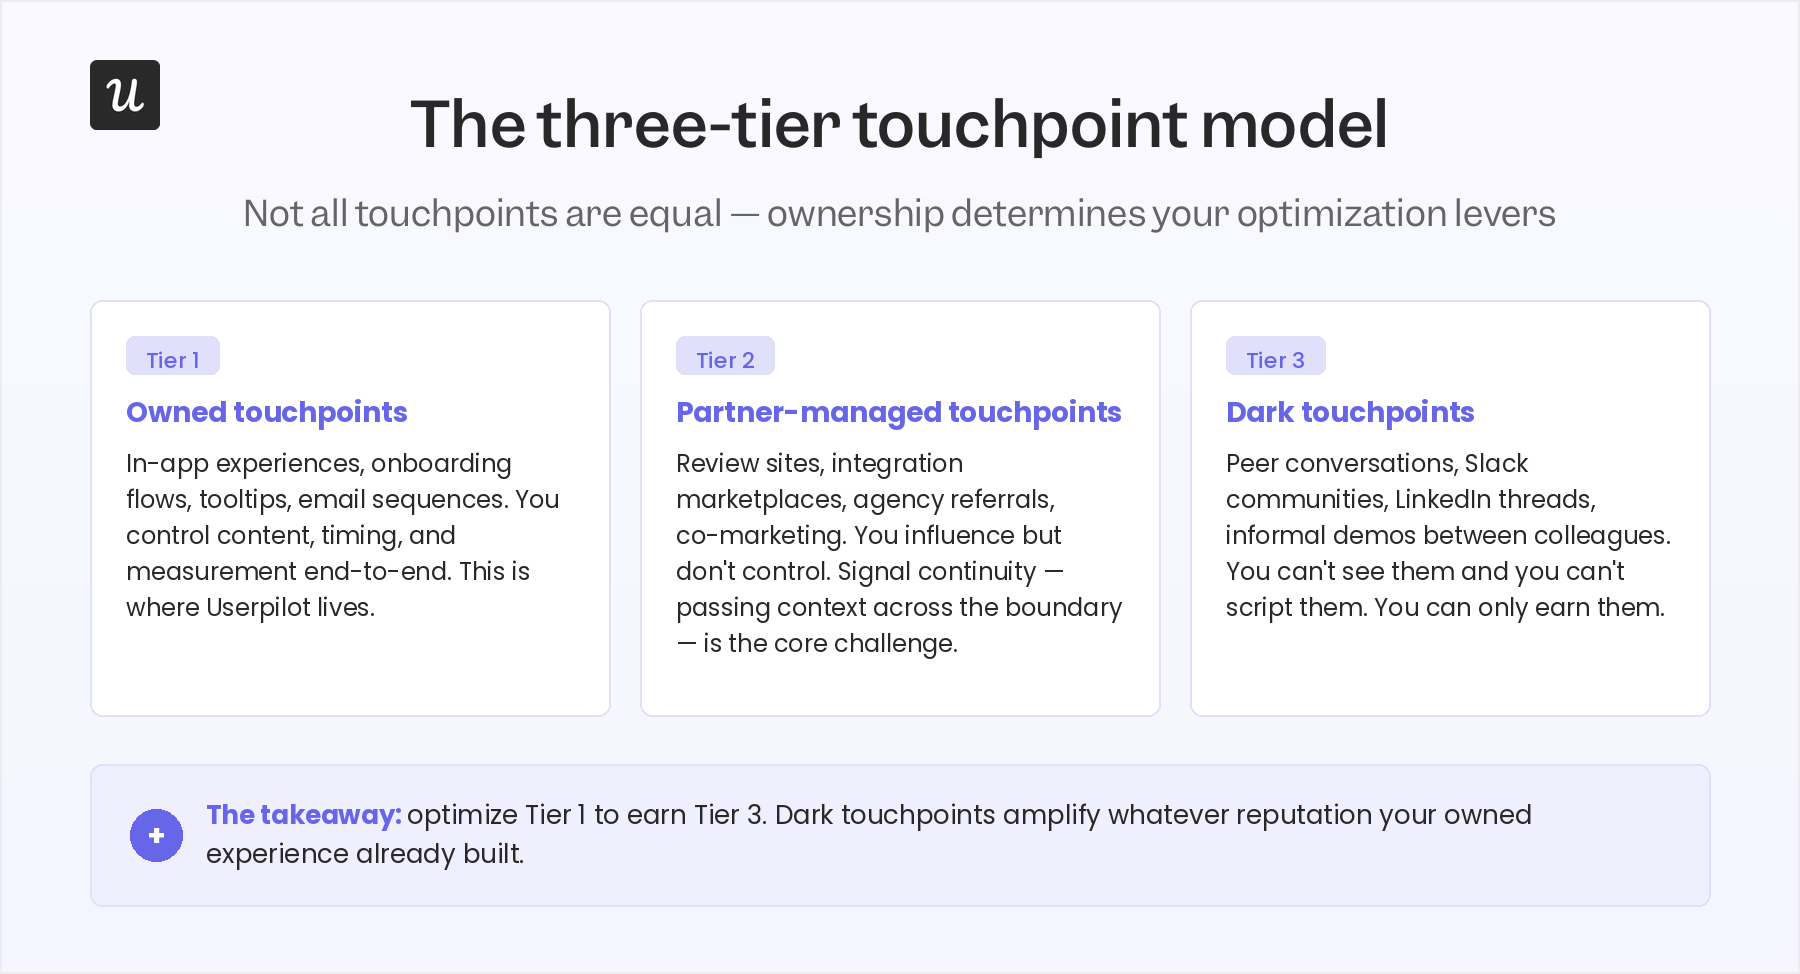
The three-tier touchpoint model: Owned, partner-managed, and dark
The standard “list all your touchpoints by stage” approach to journey mapping is how you end up with a 40-row spreadsheet nobody acts on (or bothers to open). It puts a G2 review, a welcome survey, and a Slack mention in the same operational category despite being drastically different from one another. The three-tier model cuts that confusion at the root.
Owned touchpoints
Owned touchpoints are the ones your team fully controls: your website, in-app onboarding flows, onboarding emails, in-product surveys, resource centers, feature announcements, and renewal reminders. These are where Userpilot operates and are also where your highest-ROI optimization work lives because you can see the data, make the change, and measure the result without a platform’s permission or a third-party delay.
Every owned touchpoint should have three things attached to it:
- Friction score (scale of 1-5 based on funnel drop-off data and/or session replays).
- Current tracking status (are you measuring it?).
- Named owner (whose touchpoint is it?).
High friction combined with no tracking means you’re flying blind at a crucial moment in the customer journey.
Partner-managed touchpoints
Partner-managed touchpoints are places where your brand appears but with someone else controlling the experience: G2, Capterra, Trustpilot, analyst reports, affiliate comparison content, and integration marketplaces. You shape these through product quality, proactive review generation, and thoughtful response protocols (but you can’t script them or guarantee positive framing).
The practical implication is that you need to build a systematic process for generating reviews after positive in-product moments happen. Don’t spend engineering time trying to track what happens when a buyer reads your G2 page at midnight. The best you can do is improve the probability of a good outcome on partner-managed touchpoints, but you can never guarantee it.
Dark touchpoints
Dark touchpoints are the ones you can’t see at all: peer-to-peer recommendations in Slack communities, word-of-mouth referrals in WhatsApp groups, informal comparison discussions on LinkedIn, and, increasingly, LLM-generated recommendations. When a buyer asks ChatGPT or Claude which product adoption tool to try, your product is either in the shortlist or it isn’t, and you have no direct insight into why.
Researchers Dhruvinkumar Chauhan and Mitesh Jayswal at UC Berkeley’s California Management Review published a stark observation in April 2026: “If products are not machine-readable they can be invisible to AI agents.” In practical terms, if your pricing page is buried in unstructured images or your documentation is thin, you don’t exist in agent-mediated buyer decisions. You influence dark touchpoints by building a strong product, maintaining structured data, and generating enough brand visibility to make you the natural recommendation.
The customer journey stages: What still maps predictably (and what doesn’t)
Most customer journey maps use a nine-stage model. Those stages are still real. What’s changed is which tier of touchpoints drives each one, and how predictable the sequence is for PLG products versus high-ACV sales cycles.
For $50,000+ contracts, 6-10 stakeholders are involved in the buying decision, each potentially at a different stage simultaneously. PLG products see the decision stage happen entirely inside the product, with the entire post-purchase journey sitting in the owned tier.
The table below shows how touchpoints are distributed across tiers for each stage:
| Stage | Primary touchpoints | Tier | PLG vs. sales-led note |
|---|---|---|---|
| Awareness | Search content, social posts, LLM recommendations, peer referral | Mostly dark + partner-managed | In PLG, the product itself generates awareness through word of mouth. In sales-led, paid demand gen drives this stage disproportionately. |
| Consideration | Landing pages, G2/Capterra, comparison content, competitor pages | Owned + partner-managed | Enterprise buyers validate through analyst citations and reference calls. PLG buyers often skip this stage entirely and go straight to trial. |
| Decision | Free trial, product demo, pricing page, sales call | Owned + partner-managed | PLG teams see decisions happen inside the product. Sales-led teams see it happen across a mix of tracked and untracked touchpoints. |
| Activation | Onboarding flow, welcome survey, first feature use, completion milestone | Owned | This is the highest-ROI owned touchpoint cluster. Getting activation right has a compounding effect on every stage that follows. |
| Adoption | In-app guidance, feature announcements, behavioral triggers | Owned | Adoption is where most teams underinvest in owned touchpoints and overpay on CS headcount to compensate. |
| Renewal | Renewal emails, in-app health signals, QBRs | Owned | Teams that connect adoption signals to CS alerts at renewal consistently outperform those that treat renewal as a separate campaign. |
| Expansion | Upgrade prompts, add-on announcements, usage-based triggers | Owned | PLG expansion is triggered by in-product usage hitting natural limits. Sales-led expansion requires CS to spot the signal and initiate the conversation. |
| Loyalty | Community, product updates, personalized outreach | Owned + dark | Loyalty is partly built at owned touchpoints (onboarding and adoption quality) and partly expressed at dark ones (referrals, reviews). |
| Advocacy | Review requests, referral programs, community building | Partner-managed + dark | You trigger the review request (owned). The review sits in partner-managed territory, and the peer recommendation it generates is dark. |
How to find the customer journey touchpoints that actually matter
Most touchpoint identification exercises produce a list that’s too long to act on.
The three-tier model is already a filter because it tells you where to focus by default. What you’ll still need to figure out is where the friction is within your owned tier specifically, because that’s where you can act fastest with the highest likelihood (and magnitude) of impact.
1. Define the user you’re mapping for
Before you can identify meaningful customer journey touchpoints, you need to be specific about which user segment you’re mapping. A VP of Product and a front-line customer success manager have different jobs to be done, different onboarding needs, and different moments where friction could cost you the most (even within the same product).
Build user personas from customer interviews, welcome survey data, and conversations with your CS and sales teams. Focus each persona on specific roles, jobs to be done, and pain points while keeping in mind what successful activation would look like for that persona.
Perhaps most importantly, map customer touchpoints separately for each persona rather than assuming a single map can serve everyone.
2. Find the patterns in behavioral data
For owned touchpoints, product analytics does most of the diagnostic work. Funnel analysis shows you where users drop off while path analysis shows you what they did before they dropped (which often reveals touchpoints you didn’t realize were part of the journey at all).
Finally, session replay closes the gap by showing you exactly what happened at whichever touchpoint the user stopped at.
For partner-managed touchpoints, set up G2 and Capterra review alerts then read every review to understand what buyers are really saying about the product when you’re not around.
Customer interviews can help shed even more light on the dark tier by asking questions like:
- Where did you first hear about us?
- Who else did you talk to?
- What did you search before you found our landing page?
3. Build a map with ownership baked in
A customer journey map that doesn’t assign a tier to each touchpoint is just a diagram, not a tool that you can actionably use for prioritization. For every touchpoint you identify, record which tier it belongs to, who’s responsible for optimizing it, the current friction score (1-5), and whether it’s actively being tracked.
Customer journey touchpoint examples by tier
Rather than the standard flat list of customer journey touchpoints by stage, here’s how the most common SaaS touchpoints are distributed across the three tiers:
| Stage | Owned touchpoints | Partner/dark touchpoints | Userpilot’s role in the owned layer |
|---|---|---|---|
| Awareness | SEO blog content, paid landing pages, webinars | LLM recommendations, G2 category pages, peer referrals, Slack community mentions | In-app NPS and CSAT data inform which features and outcomes to highlight in awareness content |
| Consideration | Pricing page, comparison landing pages, demo booking flow | G2/Capterra reviews, analyst reports, affiliate comparison posts | Interactive demos built with Userpilot flows; visitor behavior on pricing page tracked via analytics |
| Decision / Trial | Free trial UX, welcome survey, sign-up flow, first session | Review site validation, sales reference calls | Welcome survey collects role and use case; responses route users into differentiated onboarding flows immediately |
| Activation | Onboarding checklist, product tours, contextual tooltips, first-value milestone | Help documentation (partner-indexed) | Checklists, tours, and tooltips built and iterated without engineering; completion rates tracked per segment |
| Adoption | Feature announcements, behavioral nudges, in-app guidance for secondary features | Community tutorials, third-party integration docs | Behavioral triggers surface guidance at the moment of confusion; feature adoption tracked per user segment |
| Retention / Renewal | Health score alerts, renewal emails, QBR preparation data, in-app renewal prompts | CS call records, CRM data | Lia surfaces “high logins, zero outcomes” accounts before they churn; CS gets the alert while there’s still time to act |
| Expansion | Usage-limit prompts, upgrade modals, add-on announcements, milestone celebrations | Account manager outreach, partner upsell content | Expansion triggers built on usage-based event rules; upgrade prompts served at high-engagement moments in the product |
| Advocacy | Review request surveys, referral program flows, case study invitations | G2 reviews, LinkedIn posts, peer referrals (dark) | NPS follow-up flows identify promoters and trigger review requests automatically, without manual CS intervention |
The signal-continuity principle: Every customer journey touchpoint should inform the next one
Most product teams optimize customer journey touchpoints in isolation. They improve the user onboarding checklist without asking what the welcome survey said about the user’s goals. A feature announcement goes out without checking whether the receiving segment has already adopted that feature.
The churn survey data never makes it back into the onboarding guidance for new users with the lookalike personas. A touchpoint that doesn’t forward its signal is a dead end.
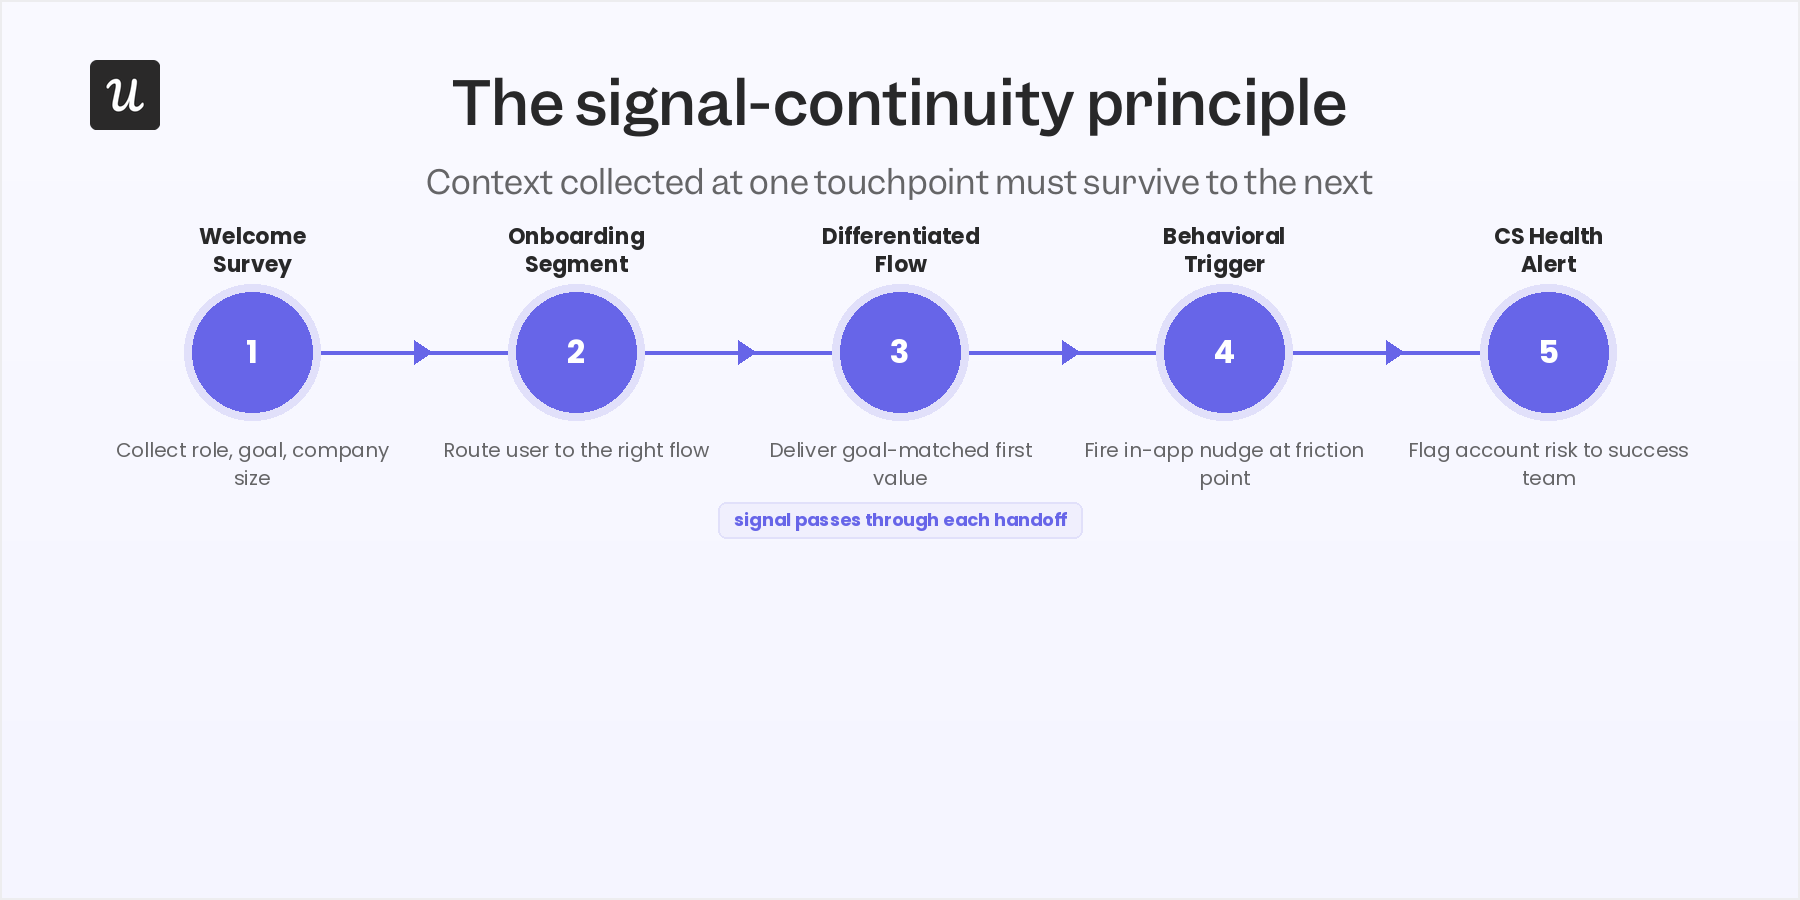
Here’s what a signal-continuous owned journey looks like in practice:
- A new user completes a welcome survey (role, use case, team size). That response becomes the segmentation variable for everything that follows.
- The segment routes the user into a differentiated onboarding flow. A solo founder gets a different checklist than an enterprise CS manager, because their activation milestones are different.
- The flow tracks which steps are completed and which are skipped. Skipped steps trigger a secondary in-app touchpoint (such as a tooltip or behavioral nudge) to eliminate any gaps in the customer journey.
- Three weeks in, a contextual in-app survey collects adoption-stage customer feedback. Results feed directly into the CS team’s account health view.
- Accounts showing high login frequency but low feature completion get flagged automatically.
I call this the “high logins, zero outcomes” pattern. It’s the strongest leading indicator of churn I track in my own work, and it’s only visible if the activation signal is connected to the adoption signal.
That last step is where most teams have a gap. They collect onboarding data, but it doesn’t flow forward to CS. NPS data comes in but doesn’t flow backward to influence in-product guidance.
The journey map has all the right boxes, but without continuity, the signals die at each boundary.
How to optimize the customer journey touchpoints you actually own
With the three-tier model and signal-continuity principle in place, touchpoint optimization becomes a specific sequence of decisions rather than a general mandate to improve everything.
Collect customer feedback at the touchpoint (not weeks later)
Collecting customer feedback after the fact barely correlates with the touchpoint experience. Feedback collected at the moment of interaction tells you what actually happened.
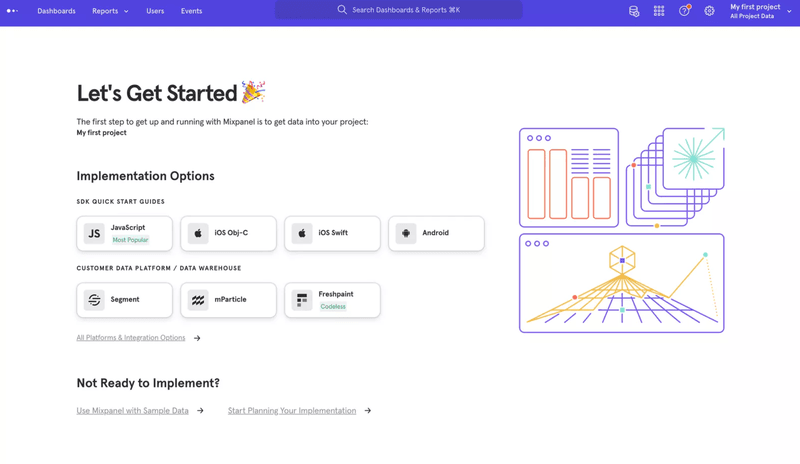
Three survey types can be used across three different moments:
- An onboarding survey triggered at the end of the first session.
- A CES survey shown in-product the first time a user completes a feature’s primary task.
- A churn survey triggered during the cancellation flow.
Each works because the experience is still active in the user’s memory, making the data reliable enough to act on rather than just interesting to look at.
Fix in-app friction before customers reach out to you
When I spot a friction pattern in account health data, the first question I ask is whether we can fix it with an in-app touchpoint before it escalates into a support ticket, service call or, worst of all, a churn risk. A segment of accounts with strong login activity but no key workflow set up is often a guidance gap rather than a product fit problem.
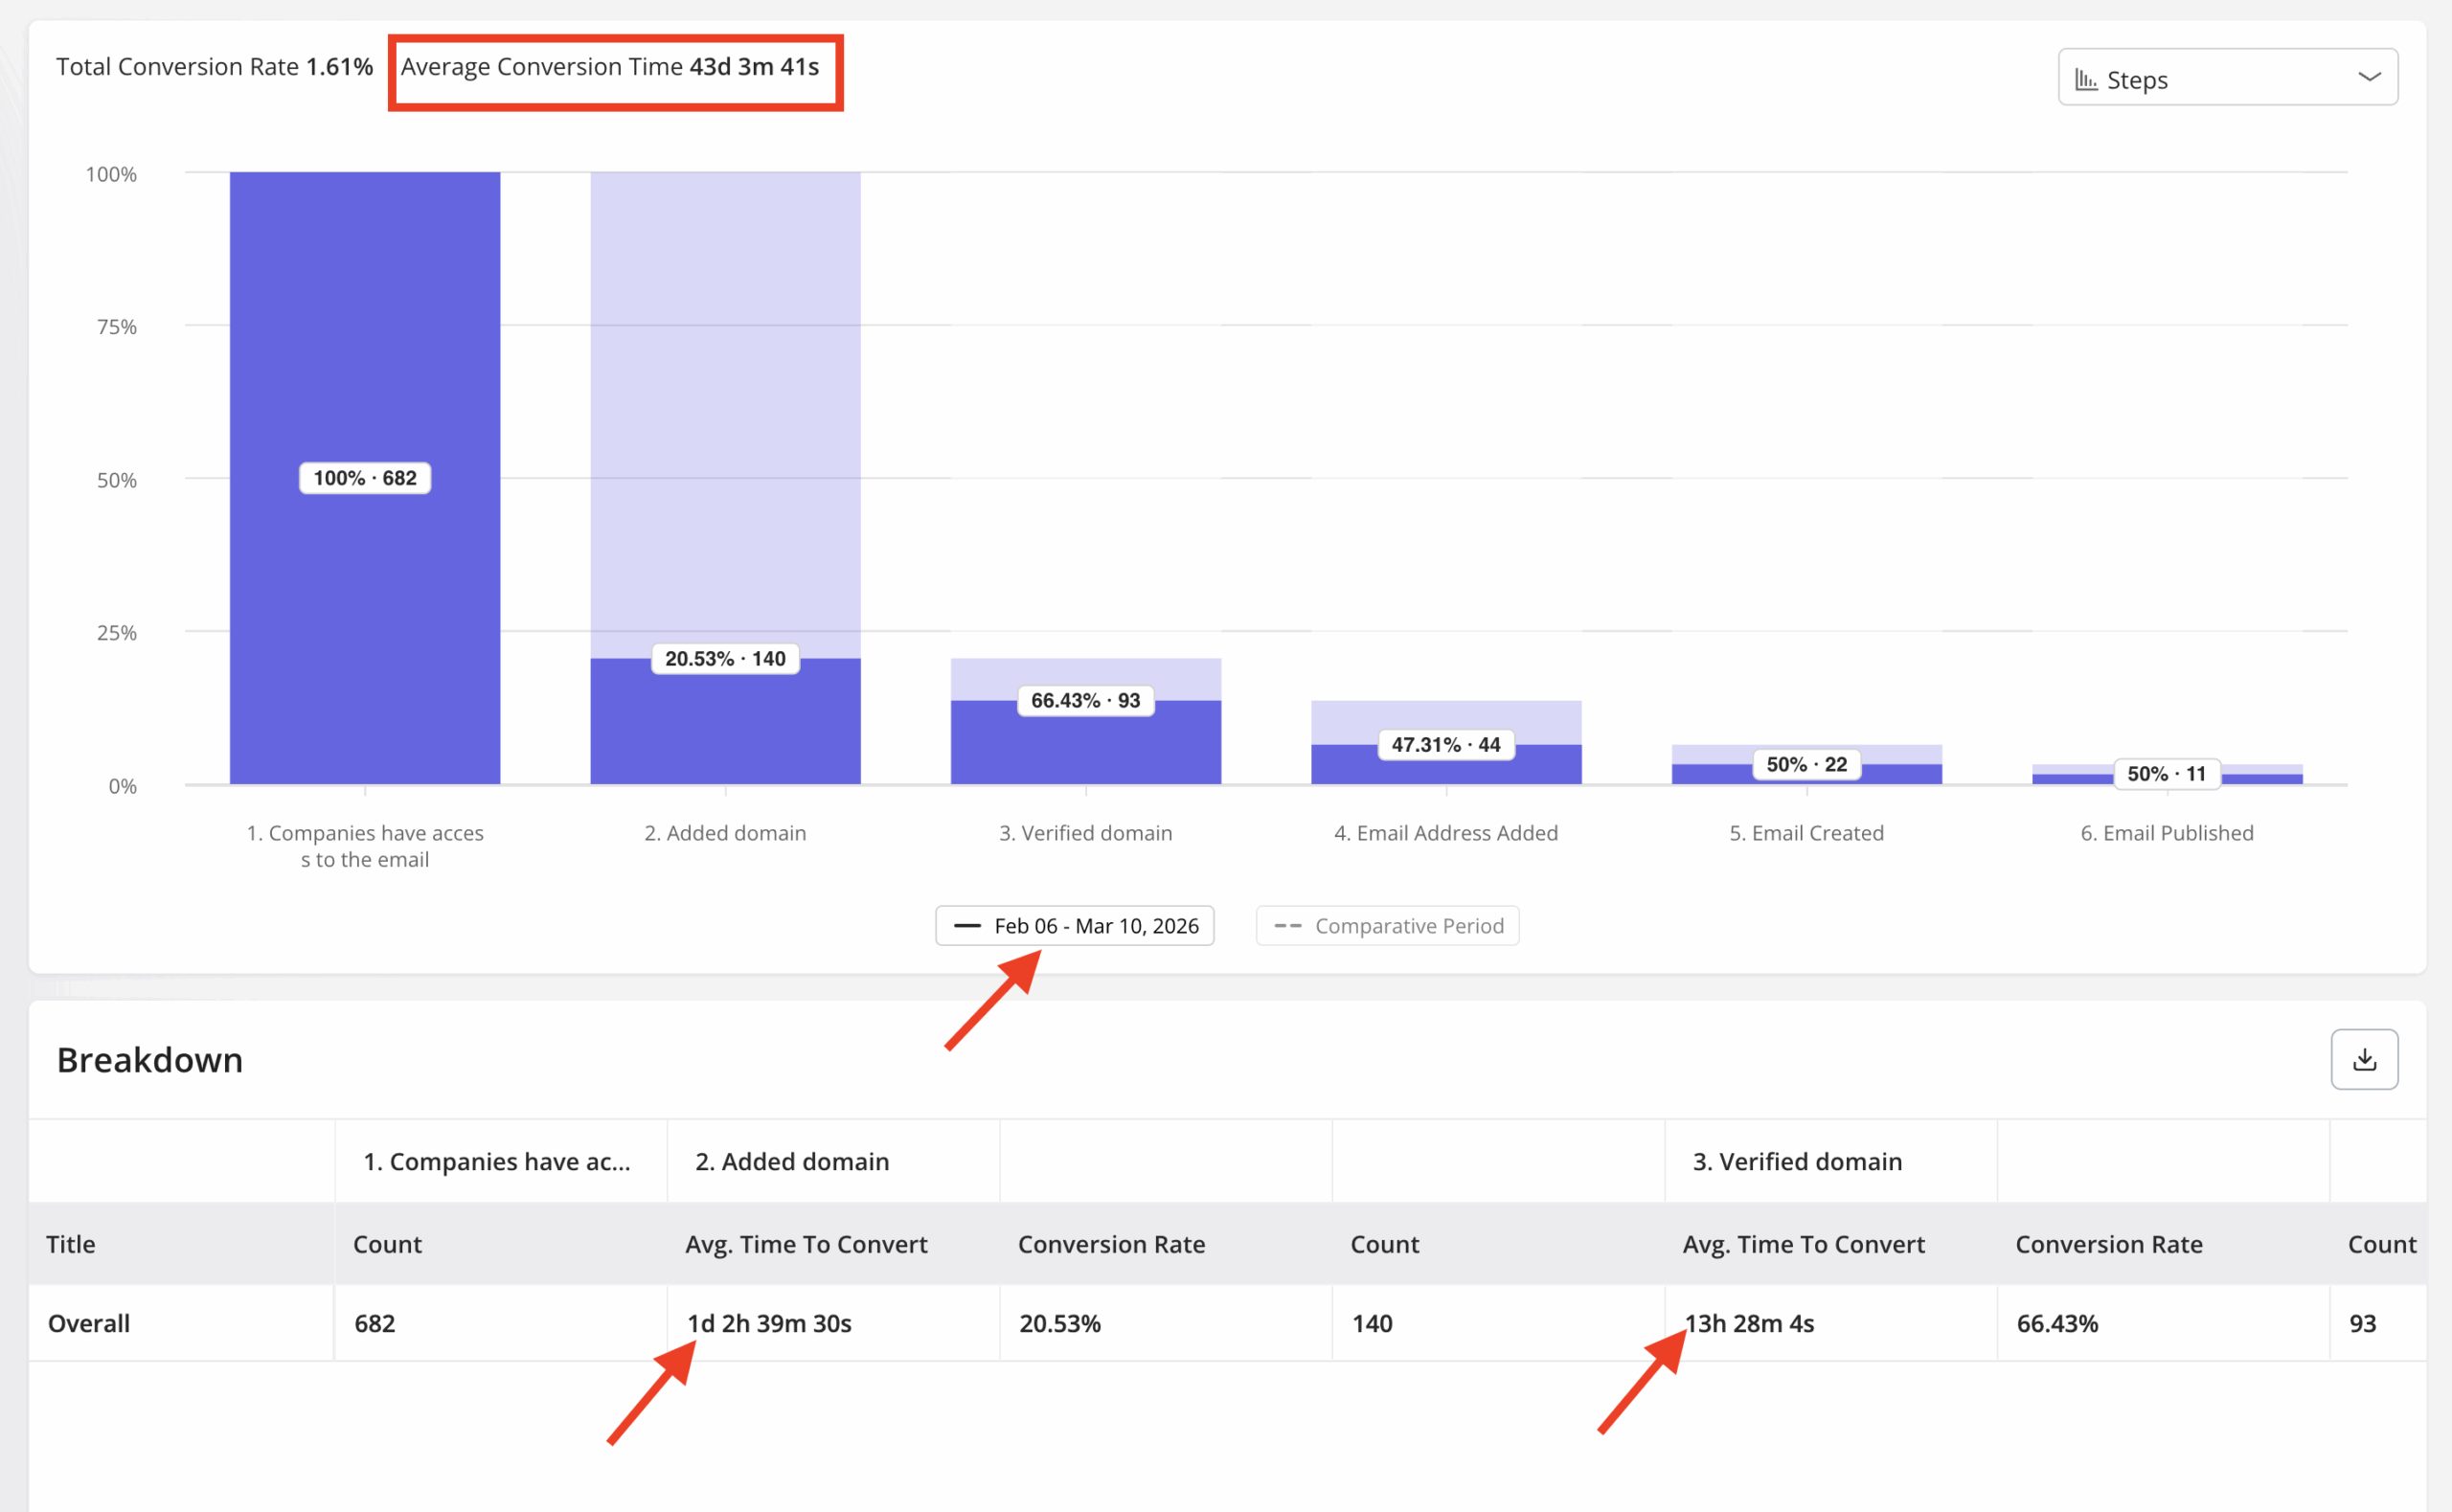
The highest-ROI loop I’ve found is to identify the friction through funnel analysis, deploy a contextual checklist or tooltip at that exact moment in Userpilot, and then check whether the “high logins, zero outcomes” signal clears.
Most of the time, what looks like a customer success problem is actually a missing in-product touchpoint at a critical step.
It also clarifies the diagnosis: if in-app guidance moves the metric, the issue was UX confusion. If it doesn’t, you have a real product gap that needs engineering.
Use funnel analysis and session replay together (location + context)
Funnel analysis tells you where users drop off at customer journey touchpoints. Session replay tells you why. Together, they close the diagnostic gap that leaves most teams writing guesses in tickets instead of evidence.
The combination is most useful at owned touchpoints where the funnel shows drop-off, but the reason isn’t immediately obvious.
When a user abandons a setup step, is it due to confusion around the input field, a technical error, or a deliberate decision to come back later?
Watching multiple session replays from users who dropped off at the same step will usually answer that question after just a few minutes of playback.
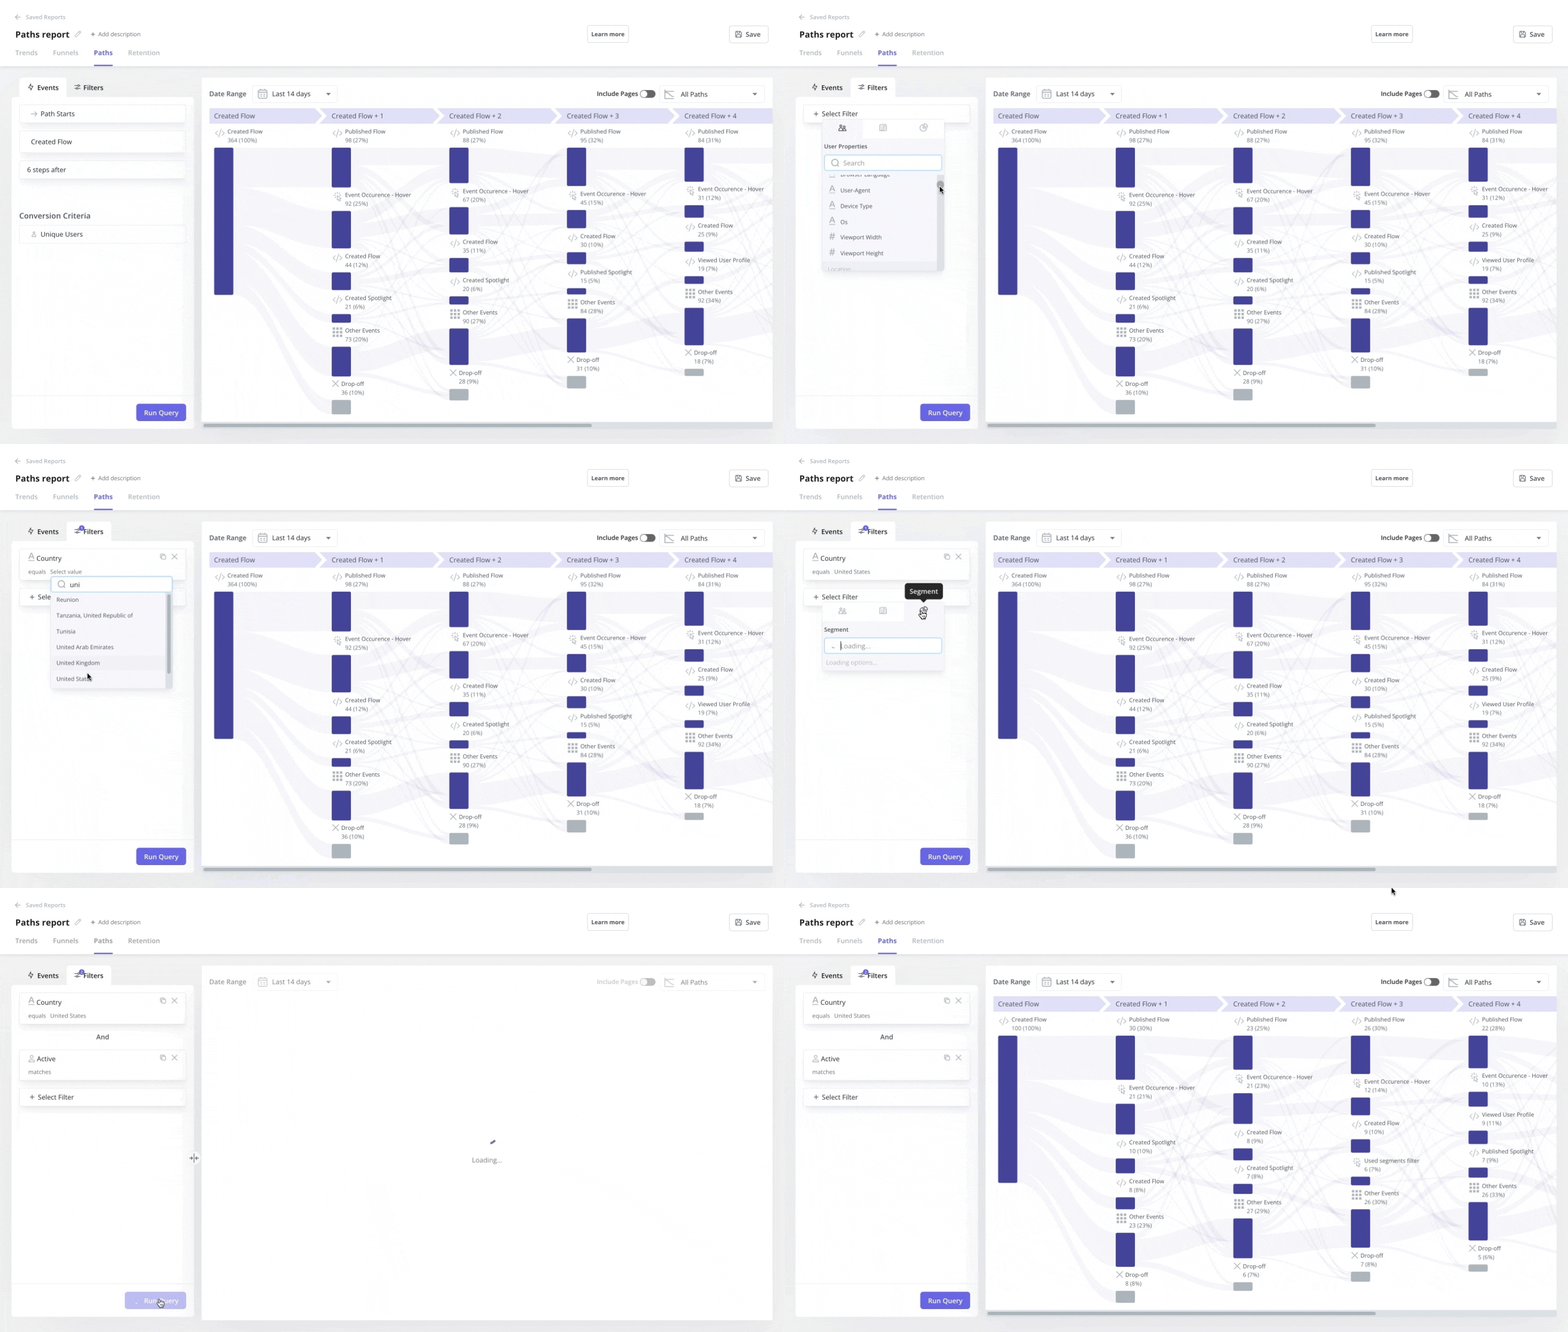
Path analysis maps exactly what users did before and after any event, critical for identifying unexpected touchpoints and diagnosing drop-off context.
Prioritize the touchpoints gating stage transitions
Not all owned touchpoints are created equal. The activation cluster (onboarding flow, welcome survey, and first-value milestone or ‘Aha!’ moment) has compounding effects on everything downstream.
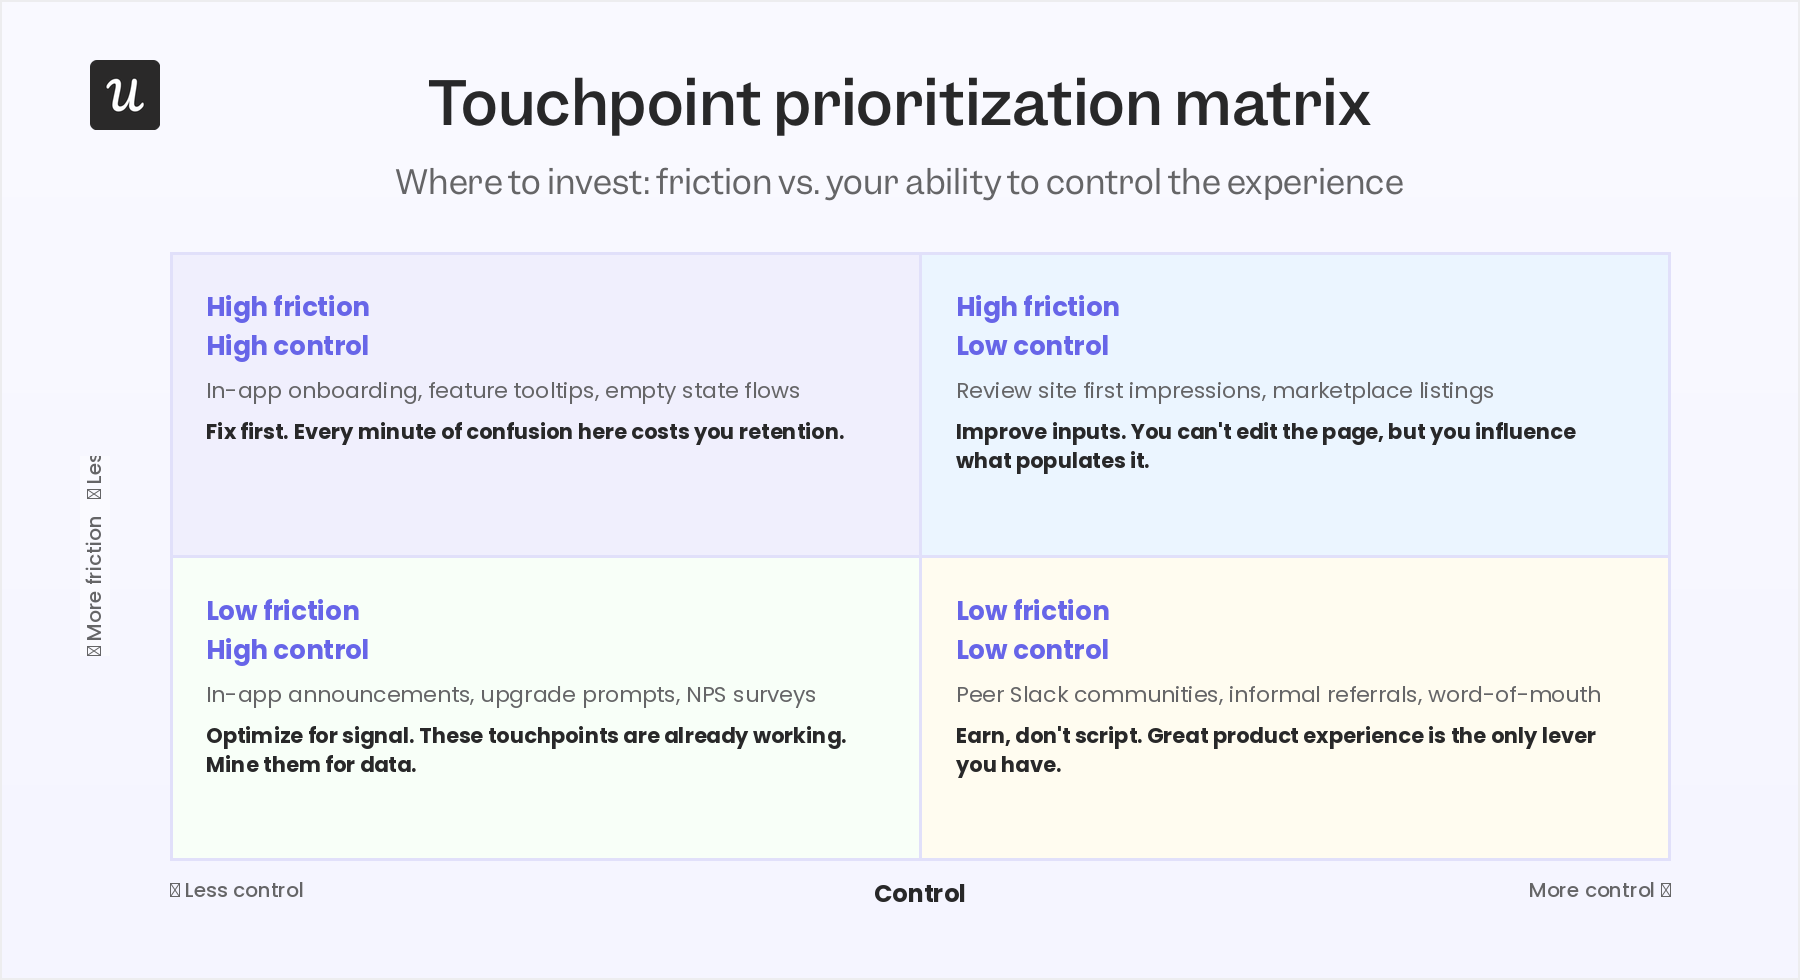
A user who activates fully is more likely to adopt deeply.
They’re also more likely to renew without a second thought and even expand into higher plans.
In contrast, someone who doesn’t activate cleanly tends to generate disproportionate customer success workloads only to churn anyway in the end.
The prioritization logic is to use funnel data to identify which owned touchpoints have the largest drop-off relative to the stage transition they’re supposed to enable and then score each by friction on a scale of 1-5.
Eliminating friction points from stage-gating touchpoints is your highest-ROI fix.
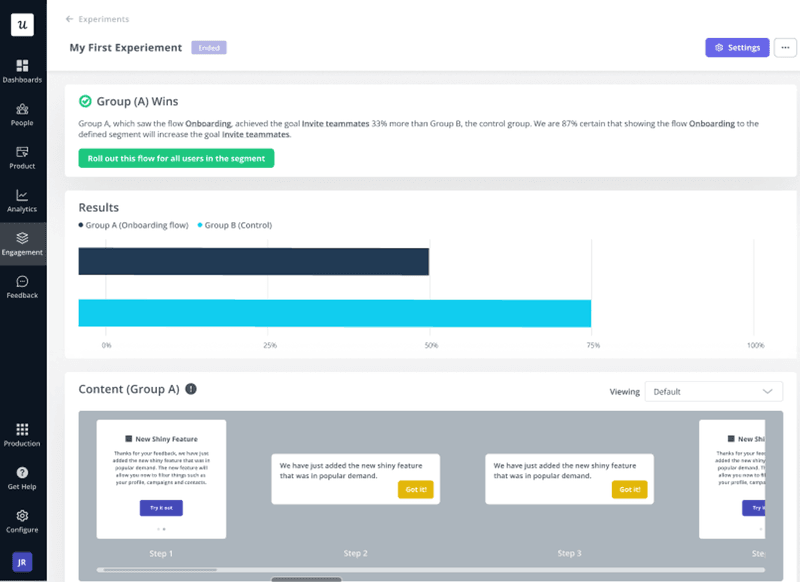
A/B test flows from hypotheses, not instincts
A/B testing is most valuable when you start with a specific hypothesis rather than running it as a default response to a bad metric.
Before testing a touchpoint, document three things:
- Friction signal that prompted the test.
- Specific change you’re testing.
- A/B testing metric you expect to move.
Without those inputs, you generate data that contradicts without explaining. In Userpilot, A/B tests on in-app flows run without engineering involvement, which removes the cost barrier that keeps teams from testing as often as they should.
Keep the customer journey map current
Customer journey mapping isn’t a quarterly initiative. Your product changes, user segments evolve, and new touchpoints appear (including ones you didn’t create).
Every major feature launch adds at least one new owned touchpoint, and each pattern your CS team surfaces partially invalidates the existing map. The bare minimum should be to review it every time a major feature ships, every time funnel data shows an unexpected change at an owned touchpoint, and every time your NPS distribution shifts by more than 10 points.
The touchpoints you can’t control
There’s a temptation, once you’ve classified your dark and partner-managed touchpoints, to immediately ask how to bend them to your will. You can’t, and trying anyway does nothing but waste resources that belong to your owned tier.
What you can do is make your product worth recommending and make your data legible to the AI systems who are increasingly doing the shortlisting on behalf of buyers. If your pricing page is image-heavy and unstructured, your documentation is thin, or your product metadata is inconsistent, you don’t exist in the agent-mediated buying decisions that Chauhan and Jayswal’s CMR research described.
The fix is the same as age-old SEO best practices: structured content, clean APIs, and consistent product data across every surface where buyers might find you.
For products where users interact via AI agents (such as through MCP or similar protocols), there’s a new category of owned touchpoint emerging: the agent-initiated task.
Userpilot’s Agent Analytics tracks how AI agents use your product, which tasks they complete, where they fail, and compares satisfaction scores of human versus agent sessions. For any product where agents are a meaningful share of the user base, ignoring this data tier is the same mistake teams made back in 2020 when they were ignoring mobile session data.
Optimize the touchpoints you own, accept the ones you can’t
The 266-touchpoint figure is not a task list. Most of those touchpoints are happening in channels where product investment has no direct effect. Trying to map and optimize all of them is how you end up with a sophisticated journey diagram but mediocre in-product experiences.
The shift worth making is much simpler.
Classify every touchpoint by ownership tier, score friction for each owned one, and fix the highest-friction owned touchpoints first. Connect those touchpoints so the signal from each one informs the next. Then use what you learn from your owned journey touchpoints to build a product that earns its positive dark-touchpoint outcomes (recommendations, referrals, reviews) without having to engineer them directly.
If you want to see how Userpilot helps you diagnose, prioritize, and fix the owned customer journey touchpoints that are tanking your retention rate, book a demo here.
FAQ
What is an example of a customer touchpoint?
A customer touchpoint could be a social media marketing post building initial awareness, an exchange in an online community forum responding to customer feedback, or a customer interaction with an associate in a brick-and-mortar store. Other examples specific to B2B SaaS include a product landing page and a cancellation survey. (Of course, that list of examples isn’t exhaustive, as customer journey touchpoints examples abound across our digital and physical worlds.)
What are the 7 touchpoints in a customer journey?
Though customer journeys can differ from product to product, most key customer journey touchpoints fall within one of these seven buckets:
- Awareness: Pre-purchase touchpoints start in the awareness bucket when your potential customer learns about the product, from a social media post or other initial touchpoints.
- Consideration: The customer evaluates the product as a potential solution to their problem, for example, by trialing it or comparing it to competitors.
- Decision or Purchase: The interactions in this bucket include a customer signing up for the product or service or purchasing a paid version.
- Provisioning and Implementation: Post-purchase touchpoints begin here, when new customers transition from buyer to user by gaining access to the product or service, including steps like account creation and data migration. (In the context of B2C physical goods, this touchpoint might be referred to as delivery and fulfillment.)
- Activation: In activation interactions, your customer completes onboarding, typically through digital channels, and reaches their first moment of fully understanding and appreciating how your product or service can provide real value.
- Adoption, Expansion: Your product or service becomes a trusted, habitual solution, meeting customer expectations (or even exceeding them). Your customer may be repeating purchases or even buying add-on services or upgrading to a higher plan.
- Loyalty, Advocacy: Your customer appreciates the value of the product and the positive change it brings and isn’t likely to switch to competing solutions; even better, some customers promote the product through word of mouth or referral programs.
What are the 5 pillars of the customer journey?
The five pillars of the customer journey architect the stages a customer moves through, from initial awareness to buying process and beyond (originating from traditional marketing funnels).
- Awareness: A customer need arises, and customers discover your brand.
- Consideration: The customer actively measures your offering against alternatives.
- Purchase or Decision: The customer takes action, committing to and buying your product or service.
- Retention: Your customers continue using your offering, and with the help of customer success and other teams, you work to keep them engaged.
- Advocacy: Your customers become promoters and brand champions, sharing positive customer perspectives that help refer new business, boost conversion rates, and improve sales.
About the author