Try Userpilot Now
See Why 1,000+ Teams Choose Userpilot

What are product management KPIs?
Product management KPIs or Key Performance Indicators are quantifiable measures of product performance that allow product teams to outline and track the success of the product or business.
These KPIs help product managers to identify issues that need their attention, set goals, and make better decisions.
What’s the difference between KPIs and OKRs?
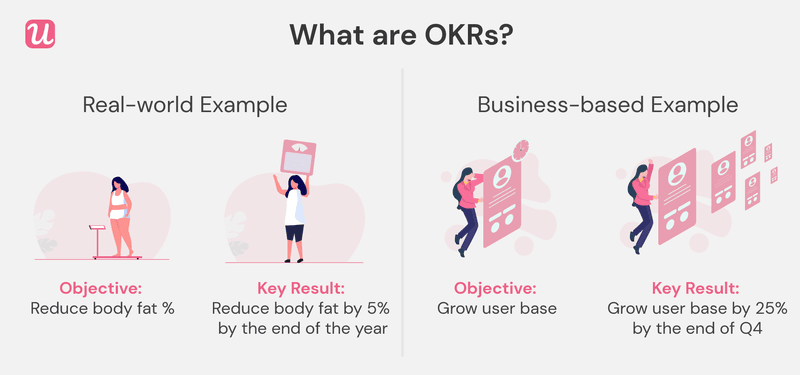
OKR stands for Objectives and Key Results.

Objectives are desired, measurable goals, while Key results are the impact of your work towards achieving the objective. KPI, on the other hand, shows you how successful you are to reach that result.
While KPIs are business metrics that reflect performance, OKR is a goal-setting method that helps you improve performance and drive change. OKRs and KPIs differ based on what you’re measuring and how you are measuring them.
OKRs can also help you understand if you need to change or improve something in your product.
Besides, you need to collect and review OKRs multiple times weekly, as these are used to make prioritization decisions. Whereas, a regular review of KPIs is enough.
Here’s an example of how OKRs and KPIs are related and yet are different from each other:
- Objective: Growing user base.
- Key Result: Growing user base by 20% by the end of Q4.
- Initiative: Optimize in-app onboarding.
- Key Performance Indicator (KPI): Monthly Recurring Revenue (MRR) is increasing steadily by 4%.
What’s the difference between KPIs and metrics?
I’ve already mentioned that KPIs allow you to understand if your business is reaching its core objectives.
Metrics help you understand if you are reaching your business goals – core or not.
A KPI is also a metric, but a metric doesn’t always have to be a KPI.
This is because KPIs are metrics that focus on key business objectives. If it’s measuring anything other than a key objective, it’s just a metric.
Both Product Management KPIs and metrics help you improve your product management process. Therefore, both have a crucial role in measuring your business performance.
Key product management KPIs and metrics for SaaS product managers
It can get quite tricky for SaaS product managers to select the right KPIs and Metrics due to the sheer amount of data available to them. We’ve compiled a list of important KPIs and metrics for you to track, which will help you make better decisions as a PM.
We’ve categorized the product management KPIs and metrics to make it easier for you:
- Product usage and engagement KPIs.
- Customer KPIs.
- Product development and quality KPIs.
- Business performance KPIs.
Alternatively, try using the Google HEART framework to track a combination of user-centered metrics.
Product usage and user engagement KPIs
1. Product onboarding engagement rate
Product onboarding engagement rate measures how many users actually engage with your in-app onboarding.
You should note that even though most SaaS businesses focus solely on the primary onboarding stage, SaaS products have 3 stages of onboarding.
Here are the 3 SaaS onboarding stages:
- Primary onboarding: The first stage of onboarding, which is focused on getting new customers to the activation point by engaging with key product features.
- Secondary onboarding: The second stage of onboarding, is focused on introducing users to secondary features for delivering repeated value.
- Tertiary onboarding: Final onboarding stage that’s focused on creating product advocates and driving account expansion.
You need to measure the product onboarding engagement rate and continuously test in-app experiences to improve engagement. This will have a direct impact on your product adoption and retention.
To calculate the product onboarding engagement rate, you need to look at each stage of the onboarding journey separately and then track user engagement for each.
For example, you can use in-app checklists that guide users to perform key actions in your product to experience value during the primary onboarding stage. You can then track the percentage of users who finish the checklist in a given period over the number of users who start engaging with it.
It’s totally up to you to decide what to measure at each onboarding stage.
However, here are five ways to calculate onboarding engagement:
- Percentage of users that complete the onboarding process over the number of users that start the onboarding process.
- Percentage of users that achieve all onboarding goals within 24 hours after signup over the number of users that go through the entire onboarding process.
- The median value of key tasks completed is divided by the number of key onboarding tasks to be completed.
- The average time taken by users to accomplish all the onboarding tasks.
- Rate of progress through each onboarding step (%).
2. Product usage and adoption
Product adoption occurs when users move from the free trial stage to actually pay for the product as a solution.
Key adoption metrics include breadth of adoption, depth of adoption, and duration of the adoption.
Breadth, depth, and frequency of adoption
The breadth of adoption measures how much of your trial users shift to actually paying for the product.
This helps you understand if your efforts are enough for your target users to realize enough value of your product to start investing in it.
Depth refers to how many core features of your product have been adopted. You need to understand if the customers are using key features that will make them ”sticky”. Better feature engagement will ensure that the customers who have “adopted” your product will keep using it.
The frequency of adoption measures how often users are using your product. Monitoring the frequency of product usage helps you understand if your customers are finding your product easy to use and are getting value from it.
3. Time to value
Time to value (TTV) for SaaS products is the time it takes for a user to realize the expected value from your product.
SaaS teams strive to reduce TTV, and for good reason.
The more your TTV, the longer it takes for your customers to start receiving value from your product – which is not a good sign for most products.
4. Number of user actions per session
The number of user actions per session is related to your product’s core feature usage and secondary features.
For example, if your product is an email marketing automation tool, your product’s core usage key actions might be:
- Scheduling an email automation campaign
- Checking email campaign performance
- Tweaking email campaigns
You need to track if the user performs key actions and how they are engaging with secondary features.
This tells you if users are getting value from your product. If you can ensure this, you’ll have a happy user base, which will lead to lower churn.
5. Product stickiness (DAU to MAU ratio)
Product stickiness is measured by dividing your daily active users by your monthly active users (DAU/MAU).
Stickiness helps you measure product health by identifying your product’s natural cadence and offering you insights that can help you streamline your entire onboarding process.
Customer KPIs
6. Net Promoter Score (NPS)
NPS stands for Net Promoter Score. It tracks user sentiment on your product by conducting a simple survey that asks them, on a scale of 0-10, how likely they are to recommend it to friends (10 being most likely).
You can segment NPS survey respondents into 3 categories based on NPS scores:
- Detractors: 0 – 6
- Passives: 7 – 8
- Promoters: 9 – 10.
You can calculate the NPS metric by subtracting the percentage of detractors from the percentage of promoters.
7. Customer satisfaction score (CSAT)
Measuring customer satisfaction involves collecting user feedback and sentiment on your product/service, brand, and overall user experience.
You can measure customer satisfaction by customer satisfaction surveys like Customer Satisfaction Score (CSAT). CSAT is an instant measurement of a customer’s satisfaction levels with a specific product, feature, or interaction with support staff.
CSAT helps Product Managers to uncover friction in the product by offering you insights into potential loopholes.
8. Conversion rate from trial to paid
A trial to paid conversion rate is the percentage of your users who sign up for a paid account once their trial period ends.
You can calculate you trial-to-paid conversion rate for a specific period by dividing the total number of conversions by the number of free trial users and multiplying it by 100.
SaaS businesses spend a lot of time and money on the customer acquisition channels and the product itself to get new users to try a product.
But if they don’t convert to paid users, your business won’t be profitable.
If your conversion rate is low, you are either not attracting the right users or not providing value with your product. If it’s the latter, your product management team should try to understand why.
Feedback surveys help you do exactly that. Userpilot lets you customize in-app mobile surveys with any type of question and trigger.
9. Retention rate
Retention rate measures how much of your total users you retained over a specific period.
Although you can measure retention rate in multiple ways, the basic principle is simple – divide the number of paying customers in a period by the total number of paying customers at the beginning of that period, and multiply it by 100.
Explore how you can improve the retention in your mobile app with Userpilot’s brand-new mobile features.
10. Customer churn
Customer churn indicates the number of users lost in a specific time frame (usually in a month). Customer churn only accounts for the users that stop paying for a subscription.
You can calculate customer churn in a specific period by dividing the churned customer during the period by the number of customers at the start of the period and multiplying it by 100.
You need to calculate both the retention rate and churn rate for your SaaS product.
This will help you understand how and why customers are leaving and where the funnel they are dropping out. Then you can craft better product experiences that’ll help you boost retention rate and reduce churn rate (aim for negative churn here!)
Product development and quality KPIs
11. Velocity KPIs
Team velocity helps you estimate how long product management teams will take to complete a project.
You can calculate team velocity by measuring the number of units of work completed in a specific interval.
Team velocity helps PMs validate engineering estimates compared against their proven record, which results in better accuracy in time estimates and more reliable roadmaps.
12. Product bugs
When it comes to product bugs, two types of measurements come in handy:
- Breaking down product bugs by feature
- The number of bugs reported vs. the number of bugs fixed
Breaking down product bugs by feature helps you identify the parts of your products that are more buggy and require more resources to fix.
You can also prioritize the parts that are used more by your customers.
Tracking the number of bugs reported vs. the number of bugs fixed (or net bugs) over time helps you understand your product quality. This also allows you to gauge the efficiency of your team in dealing with bugs.
13. Support tickets created
Created Support tickets is another metric that you need to track over time. For best results, you can also collect relevant metrics like support tickets resolved, resolution time, and more.
A good time of using this metric is after you’ve enhanced your product or implemented self-service support in-app (like guides and resource centre).
You can track whether or not user experience has improved by measuring the number of support tickets created over time.
Calculating created support tickets for a period is simple: sum up all tickets within the period. You can also use additional parameters to gain better insights (e.g., severity).
14. Roadmap scoring
Product roadmap scoring is a great KPI to help you prioritize the work in your product roadmap.
You can come up with your own way of product roadmap scoring. But remember to keep it consistent and not switch it up midway.
Here’s an example of how product roadmap scoring can be done:
- Reach: Calculate how many users a work item in the roadmap impacts.
- Impact: Identify the impact of the proposed work item.
- Confidence: Set your level of confidence while assessing the impact.
- Effort: Calculate the required effort to complete a work item in the product roadmap.
Now, you can calculate the product roadmap score for the given work by multiplying reach, impact, and confidence and dividing it by effort. Here’s what the formula looks like:
Product roadmap score = (Reach x Impact x Confidence)/effort.
Revenue and business performance KPIs
15. Monthly recurring revenue (MRR)
MRR is the amount of revenue that your company can expect to earn monthly. You can calculate MRR by multiplying the number of monthly subscribers by the average revenue per user (ARPU).
On the other hand, Net Monthly Recurring Revenue (MRR) Churn represents how much money you’re losing in a particular month due to churn (includes account cancelations and downgrades).
Net MRR Churn Rate = {(Churned MRR – Expansion MRR)/Starting MRR} x 100
MRR is the key to survival for a SaaS business, making it crucial for companies to monitor it constantly. If Net MRR Churn is above zero, it means that you earned less than that of the last month – which acts as a warning sign for your business.
16. Percentage of revenue from new users
“Percentage of revenue from new users” indicates the amount of revenue you generate from new users vs. recurring users.
Customer acquisition is essential for your SaaS business to be healthy. You need new users to grow while continuing to generate and increase revenue from existing users (expansion revenue).
Percentage of revenue from new users = (Revenue from new users/Total revenue) X 100
17. Expansion revenue
Expansion MRR is the monthly recurring revenue generated from your existing customers.
You can drive expansion revenue through:
- upsells (upgrading plans, trial to paid conversion, etc.)
- cross-sells (additional products on top of your main offering)
- add-ons (similar to cross-sells but exclusive to your primary product)
You can calculate Expansion MRR using the following formula:
Expansion MRR rate = {(Expansion MRR at the end of the month – Expansion MRR at the beginning of the month)/ Expansion MRR at the beginning of the month} x100.
18. Customer lifetime value (LTV)
Customer Lifetime Value or LTV is the average amount of money a business earns from a user over their time as a paying customer.
You can calculate Gross LTV by finding out the total revenue users have paid you over their time as a customer.
On the other hand, Net LTV is calculated by adding up all the revenue customers have paid you and subtracting the servicing and customer acquisition cost.
Here’s another way you can calculate Customer Lifetime Value:
Customer Lifetime Value (LTV) = Margin x (Retention rate/(1+ discount rate – retention rate)
Measuring the lifetime value is crucial.
A higher customer lifetime value indicates that you have more loyal customers who can fuel the growth of your SaaS business.
The best way to track and measure your product management KPIs
You can start tracking all these KPIs using goals, custom events, and feature tagging options.
First, you need to define what you want to track, and then you need to use tools to start tracking them.
Feature tagging
Feature tagging lets you tag any UI element, which then allows you to track engagement in your product with that specific product feature.
For instance, if your product is a social media scheduling tool, you might want to track the number of users who schedule a post using your app.
Feature tagging will allow you to track the number of clicks on the “schedule post” button.
This lets you track user engagement without writing a single line of code. Simply enter the URL of your web app and select the element on the UI directly.
Tool for product managers
You’ll find a large number of tools in the market that let you track and measure product management KPIs. Here are some of the best tools you can use, regardless of the type of your SaaS product:
- Userpilot: A product adoption and growth tool that comes with analytics and is completely code-free. Create intuitive mobile app KPI metrics and dashboards that provide clear insights into user behavior, engagement, and retention. (Get a demo of Userpilot and try it free)
- Heap: A standalone comprehensive product analytics suite.
- FullStory: Can track all user interactions without needing any prior configuration (similar to Heap). Comes with session recording functionality.
- Mixpanel: Has a wide range of features for tracking and collating user data (excels in real-time data analysis) but can be quite hard to implement.
- Iteratively: Allows you to combine all your other data sources in one place. Works with Mixpanel and Heap, and also offers integrations with Google Analytics, Segment, Intercom, and more.
Conclusion
A SaaS product manager needs to track the right product management KPIs if they want to make better decisions that help them drive business growth.
As we have covered in the article, KPIs need to measure the performance of your core business objectives.
We’ve elaborated on 18 KPIs that you need to measure: product usage and engagement KPIs, Customer KPIs, Product development and quality KPIs, and Business performance KPIs.
While tracking these many KPIs isn’t necessarily an easy task, the right tool can make it a lot easier and efficient.
Want to start measuring the right KPIs for SaaS products? Get a Userpilot Demo and see how you can get actionable growth insights, and see how easy it is to build no-code mobile app KPI dashboards.


