What is Product NPS and Why Should Product Managers Care?


Product NPS has a reputation for SaaS product managers, and it’s not always a positive one. Years after the initial boom, many treat it as a vanity metric or overlook it.
But here at Userpilot, we treat it as a core part of our offering, and always include it in our product strategy. That’s because, when combined with other metrics, NPS helps us accurately track sentiment towards our product and segment our user base. And that enables us to make more accurate product design decisions, spot early churn signals, and provide our users with personalized experiences.
In this article, I’ll explain how to design high-quality product NPS surveys and share tips on how to use the collected data for better product design.
What is product NPS?
At its core, the Product Net Promoter Score (NPS) measures customer satisfaction and loyalty tied to your product. Its goal is to track customers’ readiness to promote a product to their colleagues.
Fred Reichheld introduced the Product NPS in his 2003 Harvard Business Review article, “The One Number You Need to Grow,” as the most reliable predictor of customer satisfaction.
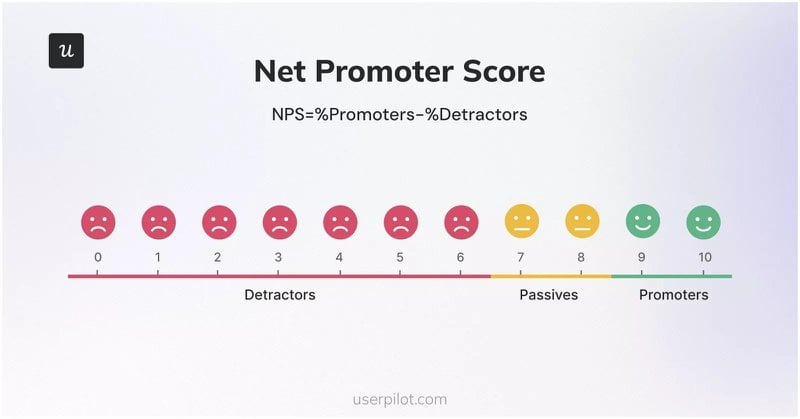
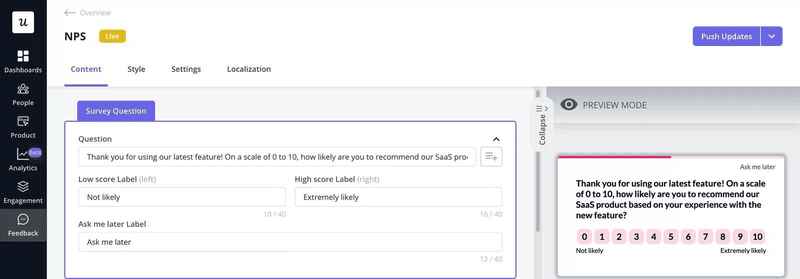
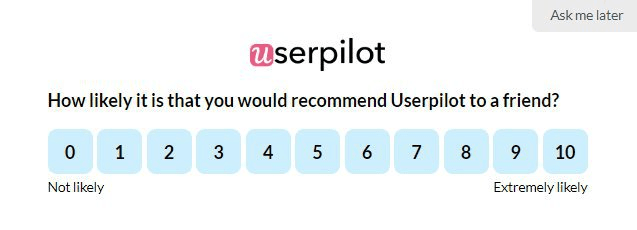
Every NPS survey starts with a simple question: “On a scale of 0 to 10, how likely are you to recommend [our product] to a friend or colleague?”. Based on their responses, users are categorized into three groups:
- Promoters (9-10): These are your product’s evangelists. They’re highly engaged power users who find value in your product and are likely to refer it to others.
- Passives (7-8): They’re satisfied, but not enthusiastic customers. They are ‘fence-sitters,’ who may use a few features, but are not deeply committed. As a result, they can be easily swayed by a competitor.
- Detractors (0-6): These are unhappy customers. They see your product’s flaws, are likely to churn, and may even discourage others from signing up.
How do you calculate Net Promoter Score (NPS)?
To calculate the NPS score, subtract the percentage of detractors from that of promoters. You’ll get a score between -100 and +100.
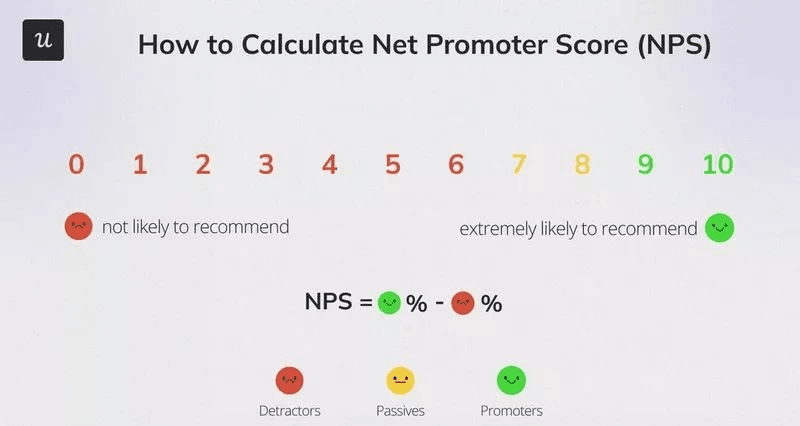
For example, assume your NPS survey has 80 responses, with 50 promoters and 10 detractors. Your NPS score will be:
62.5 (% Promoters) - 12.5 (% Detractors) = 50As a rule of thumb, higher scores indicate greater customer satisfaction and loyalty.
Why is NPS important for product managers?
Although the product NPS is mostly popular in the context of marketing or customer success, our product team finds it useful for design and analytics purposes. Here’s how NPS helps:
- Measures general product satisfaction and stickiness: A high NPS score often correlates with a good product-market fit. This indicates high product adoption and engagement.
- Provides context to product data: Promoters can help you understand which features and experiences resonate the most with users. Detractors can help you identify critical missing features or bugs with the most impact on user satisfaction.
- Inspires user-centric design: Regularly reviewing and acting on the NPS score keeps users at the center of your product decisions. Making the product even better for satisfied customers and fixing friction points for dissatisfied ones improves the customer experience.
How do you design an NPS survey to get accurate data?
Here are a few best practices for designing NPS surveys that will ensure NPS data accuracy and usefulness:
Add open-ended questions to your survey
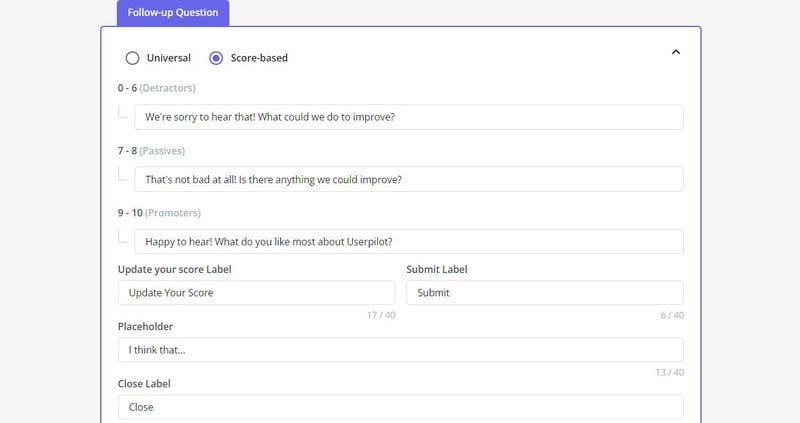
Always include an open-ended follow-up question after the NPS question. It will help you identify the “why” behind the NPS score.
This qualitative data tells you exactly what to prioritize. It shows you what promoters love, which can shape your go-to-market strategy, and reveals what detractors dislike.
💡 Pro tip: Use survey branching and logic to ask different questions to each NPS group. For example, you can ask Promoters about their ideas for new product features or request them to rate or refer your product. As for passives and detractors, you can ask what you could do to improve.
Collect data from the right users
To capture relevant feedback, you need to target the right user groups.
For example, NPS survey answers from users who have just signed up won’t be actionable since they haven’t gotten acquainted with your app yet.
Similarly, sometimes I want to measure customer satisfaction within a smaller group (power users, paying customers, or users with a specific JTBD) to focus on just one segment.
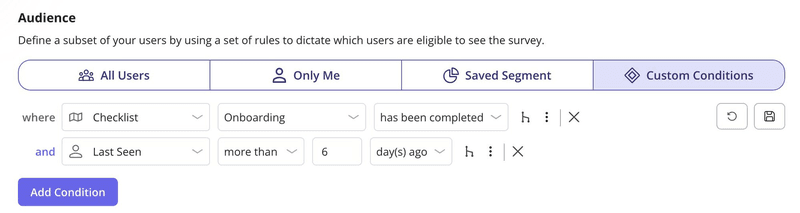
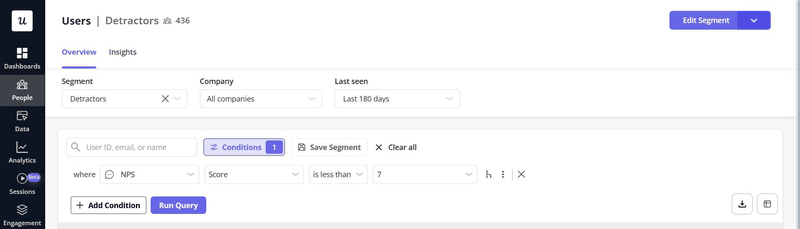
You can make your NPS surveys more targeted with segmentation and custom conditions. In Userpilot, I can target users who meet specific criteria using pre-existing or newly set up segments.
Combine transactional and relationship NPS survey types
The context in which a survey appears is crucial. You must first decide the overarching goal of your product NPS survey before choosing when and where to launch it.
There are two types of NPS surveys:
Transactional NPS surveys (tNPS)
These NPS surveys trigger after a specific interaction or touchpoint in the customer journey (e.g., after a user completes a task, interacts with a new feature, or speaks with customer support).
Transactional NPS checks how the user feels about the experience while it is still fresh in their mind. The survey is contextual, usually displayed as an in-app microsurvey.
Although transactional NPS surveys don’t run in regular intervals, it’s still advisable to repeat them to track your progress, e.g., after major feature improvements.
Relationship NPS surveys
These NPS surveys are sent periodically (e.g., biannually or quarterly) to a broad segment of your active user base. They’re ideal for gauging customer loyalty and sentiment toward your product over time, and they work great for benchmarking.
You can send them inside your app or as email surveys, but for SaaS products, in-app surveys tend to have higher response rates.
Use both surveys strategically to get the complete picture. Transactional NPS will help you pinpoint immediate issues, working similarly to a customer satisfaction score. On the other hand, relationship NPS will help you understand the broader sentiment around your product strategy.
Send NPS surveys regularly
Comparing NPS scores over time reveals trends in customer sentiment, helping you validate your product iterations and identify sentiment shifts early. This is especially true for relationship NPS.
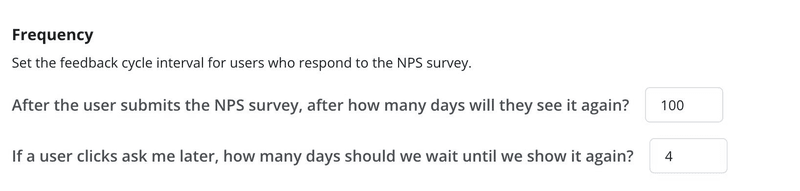
Userpilot lets me automate the process and set up a regular cadence. With frequency settings, I can define when a survey should repeat after the last response.
How smart product managers use the product NPS score to build better products
Let’s see how to ensure the data you collected isn’t just stuck between reports, but actually supports your product team’s work.
Track NPS score with the NPS dashboard
Your NPS scores should be easy to access and analyze. If you keep them in a separate spreadsheet and never cross-reference them with other product metrics, they’re unlikely to make a difference for your product design decisions.
Use a dedicated NPS dashboard to organize scores, visualize trends, and track changes. Here’s what it looks like in Userpilot:
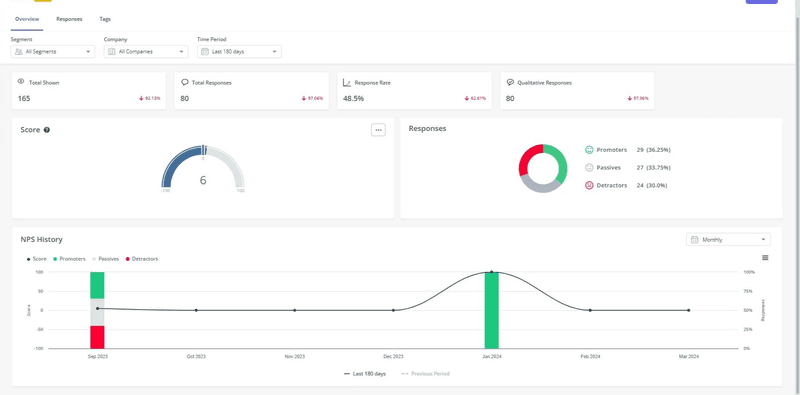
A dashboard enables you to track the NPS score, number of responses, and response rate in one convenient location. You can also see a breakdown of responses for the open-ended questions, as well as filter and tag them for better organization.
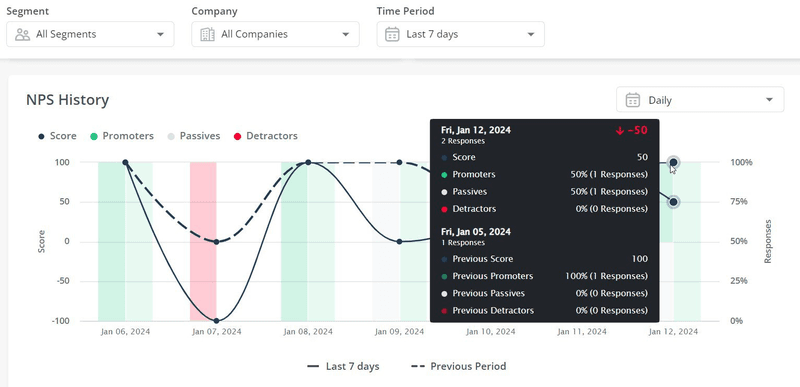
Analyze NPS history to find benchmarks and changes in customer loyalty
In Userpilot, you can compare historical NPS scores to spot changing customer sentiment and track evolving customer feedback. You can view this data for all users or a selected segment for any time frame.
Historical NPS data points help me stay proactive, making it easier to avert a crisis. For example, if we launched a new onboarding flow last month and the detractor percentage suddenly dropped, the data supports the hypothesis that the launch was successful.
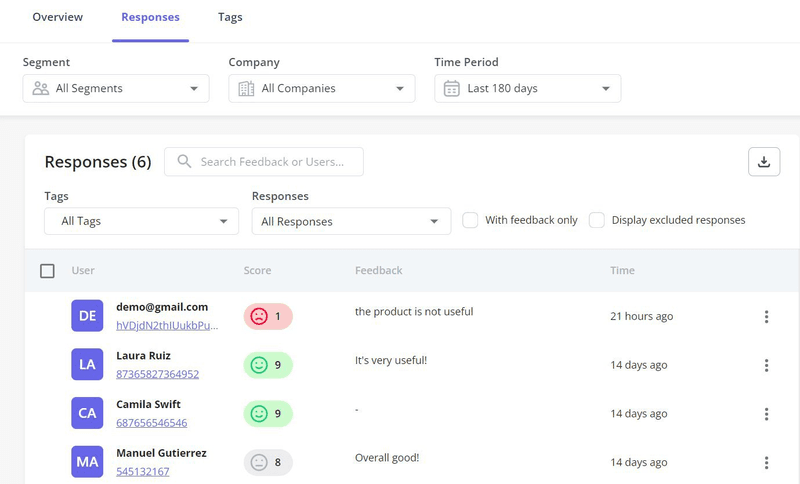
Tag NPS responses for clearer analysis
An NPS dashboard lets you tag qualitative responses to organize and group open-ended answers.
For instance, I can use a “Missing feature suggestions” tag for any new ideas or complaints to identify common pain points. Or, I can tag feedback based on user groups, such as “Usability Testing Participant” or “Enterprise User.”
Build NPS user segments and compare them with product usage and behavioral data
The product NPS score is most powerful when combined with key product usage data.
I create dynamic segments of promoters, passives, and detractors. Then, I use these segments to analyze the product and behavioral data.
Note that this combined analysis will be much easier if you track the product and NPS data with a single tool like Userpilot. Otherwise, you’ll need to find a way to integrate all your datasets.
When integrated, you’ll be able to:
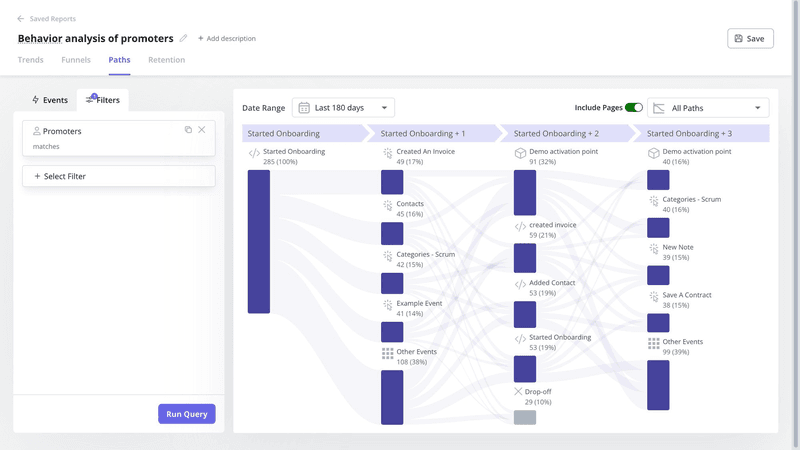
- Define a happy path for your product based on the activities of loyal customers. Identify the chain of events that led them to the activation point.
- Track the most common path for detractors to see which ones lead to dissatisfaction, or use session replays to identify friction points.
- Compare the in-app behavior patterns of promoters and detractors with the same JTBDs to identify the differences in their experience.
Use NPS scores and answers to improve product adoption and customer experience
NPS responses, including the qualitative responses, should shape your product roadmap and inspire your product design process. You can:
- Improve and fix features that detractors mention in NPS surveys, or those you identify as causes of dissatisfaction during your analysis.
- Prioritize features requested by the majority of promoters.
- Use the knowledge of the promoters’ happy paths to improve existing UX and build new features based on that logic.
- Improve the in-app experience with data-driven engagement features.
For instance, if you notice that promoters derive lots of value from particular app features that your detractors don’t use, modify your product adoption strategy accordingly.
One way to do that is by designing interactive walkthroughs that educate relevant user segments about the features.
Look at a high NPS score as an opportunity
A high number of promoters is an opportunity to leverage them for further product growth. Here’s how you can do it:
- Recruit beta testers: Grant promoters early access to new features as part of a beta testing group. Their deep understanding of your product and positive sentiment make their feedback useful during the early development phases.
- Build an ideal customer profile: What common characteristics (industry, feature usage, etc.) do your promoters share? Identifying this trait will help you refine your ideal customer profile (ICP).
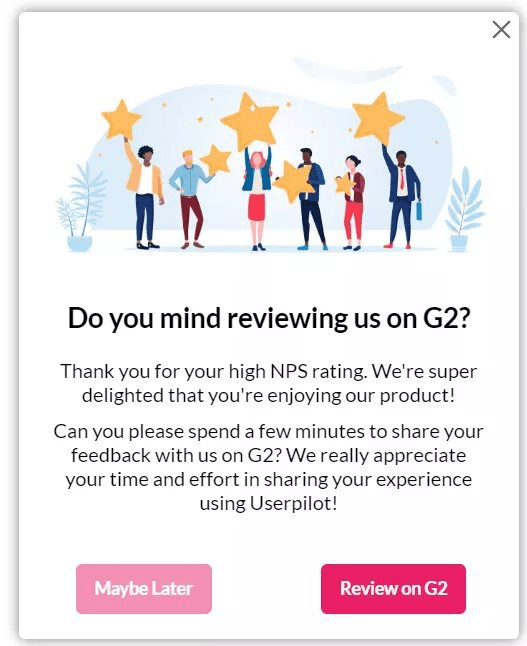
- Get customer advocacy: Promoters are your product’s biggest fans. I always encourage marketing teams to contact them for testimonials, case studies, and reviews. At the end of your survey, you can encourage them to provide feedback on third-party platforms like G2 or ask them to refer your product.
What other metrics are relevant for tracking customer sentiment?
NPS isn’t an infallible metric, so it works best when combined with other customer satisfaction metrics and tools. Here are others that my product team tracks:
| Metric | Product-Market Fit Score | Customer Effort Score (CES) | New referral customers | Customer satisfaction score (CSAT) | Customer health score |
|---|---|---|---|---|---|
| Survey question | “How would you feel if you could no longer use [our product]?” | “How easy was it to solve [X] problem today?””To what extent do you agree with the statement: [Product] made it easy to handle my issue?” | “How did you hear about [our product]?” (with options like “Word of Mouth” or “Friend/Colleague”). | “How satisfied were you with [this interaction/your recent experience]?” | There’s no single survey question as the customer health score is a composite metric built from various data points. |
| Score scale | Very disappointed Somewhat disappointed Not disappointed |
Typically, a 1-7 scale. 1 = Very Difficult / Strongly Disagree and 7 = Very Easy / Strongly Agree. | The “score” is determined by the percentage of referral responses. | A 1-5, 1-7, or 1-10 scale. 1 = Very dissatisfied and 5/7/10 = Very satisfied. | The score scale is subjective. It can be numerical (e.g., 1-100) or categorical (e.g., Healthy/At-Risk/Critical). |
| Use case | It gauges how essential your product is to its users. The higher the percentage of “Very disappointed” responses, the stronger your PMF. | Great for evaluating the ease of a specific interaction or feature usage within your product and support channels. | Unlike NPS, it tracks actual referrals. The higher the percentage of new referral customers, the more loyal your existing customers are. | It tracks user’s satisfaction with a recent interaction, so it can highlight the strenghts and weaknesses across the customer journey. | It measures whether a customer is healthy (primed for upselling) or at risk of churning. |
| Limitations | Best for early-stage products.Requires a decent sample size.Needs a follow-up question to contextualize answers. | Ideal for a specific task, not overall satisfaction or loyalty. It focuses on the ease of an experience, not how delightful it has been. | Difficult to attribute all word-of-mouth referrals without a trackable referral scheme. | A high CSAT for an interaction doesn’t equal overall or long-term product satisfaction. It’s also prone to recency bias. | There’s no universal formula for customer health. A single score can oversimplify complex customer relationships. |
Inform product design and build customer loyalty with NPS in Userpilot
Good NPS data collection can improve product roadmap and design, help you identify your best features and paths, gauge stickiness and loyalty, and power your marketing and referral schemes.
With Userpilot, you can launch customized product NPS surveys without code and directly target your desired users. Userpilot also boasts a complete suite of product engagement and insights features, bringing all your data to one place for more insights.
Want to see how it all works? Book a demo today!
FAQ
What is a good Net Promoter Score?
What makes for a good NPS score is relative. As a rule of thumb, anything above 30 is good, and anything above 50 is excellent. However, benchmarks vary significantly between industries.
What are the limitations and criticisms of the NPS survey?
-
It oversimplifies complex customer sentiment using broad groupings and can fail to capture nuances.
-
Low response rates and cultural differences around recommendations may lead to bias.
When should you send an NPS survey?
Transactional NPS should be sent right after key interactions or milestones. However, relationship NPS, which measures overall customer loyalty, should be sent quarterly or biannually.
How to improve a low NPS?
-
Educate users via in-app tutorials, interactive walkthroughs, and support resources to maximize the product value.
-
Identify the best-performing user paths and optimize user journeys along those paths.
About the author