Quantitative Data: Definition, Examples, Types and Analysis


35% of startups fail because there is no market need. This is because they haven’t conducted any customer research to determine whether the product they are building is actually what customers want.
To gather the information needed to avoid this, quantitative data is a valuable tool for all startups. This article will examine quantitative data, the difference between quantitative and qualitative data, and how to collect the former.
What is quantitative data?
Quantitative data is information that can be measured and expressed numerically. It is essential for making data-driven decisions, as it provides a concrete foundation for analysis and evaluation.
In various fields, such as market research, quantitative data helps businesses understand consumer behavior, market trends, and overall performance. Companies can gain insights that drive strategic decisions and improve their products or services by collecting and analyzing numerical data.
Whether conducting a survey, running experiments, or gathering information from other sources, quantitative data analysis is key to uncovering patterns, testing hypotheses, and making informed decisions based on solid evidence.
What are examples of quantitative data?
Quantitative data comes in many forms and is used across various industries to provide measurable and numerical insights. Here are some examples of quantitative data:
- Daily Active Users (DAU): This metric counts the number of unique users interacting with a product or service daily. It is crucial for understanding user engagement and product usage trends.
- Monthly Recurring Revenue (MRR): For SaaS businesses, MRR is a vital metric that shows the predictable revenue generated each month from subscriptions. It helps forecast growth and financial planning.
- Sales figures: This includes the total number of products sold or services rendered over a specific period. Sales data helps in evaluating business performance and market demand.
- Customer satisfaction scores: Often collected through surveys, these scores quantify customers’ satisfaction with a product or service.
- Website traffic: Measured in terms of visits, page views, and unique visitors, this quantitative data helps businesses understand their online presence and the effectiveness of their marketing efforts.
- Conversion rates: This metric shows the percentage of users who take a desired action, such as making a purchase or signing up for a newsletter, out of the total number of visitors.
- Churn rate: This represents the percentage of customers who stop using a product or service over time. It’s essential for understanding customer retention.
- Average Revenue Per User (ARPU): This metric calculates the average revenue generated per user, which helps assess each customer’s value to the business.
- Bounce rate: In web analytics, the bounce rate indicates the percentage of visitors who leave a website after viewing only one page. It’s useful for evaluating the effectiveness of a website’s content and user experience.
Differences between quantitative and qualitative data
Quantitative data and qualitative data are two fundamental types of information used in research and analysis, each serving distinct purposes and represented in different forms.
Quantitative data is numeric and measurable. It allows you to quantify variables and identify patterns or trends that can be generalized. For example, tracking product trends or analyzing charts to understand market movements. Some quantitative data examples include:
- The number of daily active users on a platform.
- Monthly recurring revenue.
- Customer satisfaction scores.
- Website traffic metrics, like page views.
On the other hand, qualitative data is descriptive and subjective, often represented in words and visuals. It aims to explore deeper insights, understand data, and provide context to behaviors and experiences.
Examples of qualitative data include:
- Customer reviews and testimonials.
- Interview responses.
- Social media interactions.
- Observations recorded during user tests.
Different types of quantitative data
Understanding the different types of quantitative data is essential for effective data analysis. These types help categorize and analyze data accurately to derive meaningful insights and make informed decisions.
Nominal data
Nominal data categorizes information without a specific order or ranking. It is used to label variables that do not have a quantitative value.
For instance, in a SaaS platform, user roles can be categorized as ‘admin,’ ‘editor,’ or ‘viewer.’ Subscription types might be classified as ‘free,’ ‘basic,’ ‘premium,’ or ‘enterprise.’
This data type is typically represented using bar charts or pie charts to show the frequency or proportion of each category.
Ordinal data
Ordinal data categorizes information with a specific order or ranking. It is used to label variables that follow a particular sequence.
Examples include:
- Rating customer satisfaction as ‘poor,’ ‘fair,’ ‘good,’ ‘very good,’ or ‘excellent.’
- Ranking support ticket priorities as ‘low,’ ‘medium,’ or ‘high.’
- User feedback ratings on features as ‘1 star’ to ‘5 stars.’
This type of data is typically represented using bar charts or stacked bar charts to illustrate the order and frequency of each category.
Discrete data
Discrete data is numerical values that can only take on specific values and cannot be subdivided meaningfully.
Examples include the number of new sign-ups daily, the count of support tickets received, and the number of active users at a given time.
This type of numerical data is often represented using bar charts or column charts to display the frequency of each value.
Continuous data
Continuous data is numerical information that can take on any numerical value within a range.
In a SaaS context, examples include measuring the amount of time users spend on a platform, the bandwidth usage of an application, and the revenue generated over a specific period. Continuous data, along with interval data, helps identify patterns and trends over time.
Pros of analyzing quantitative data
Analyzing quantitative data offers several advantages, making it a valuable approach in various fields, especially in SaaS. Here are some key benefits:
Provides measurable and verifiable data
Quantitative data is numeric and objective, allowing for precise measurement and verification. This reduces the influence of personal biases and subjectivity in analysis, leading to more reliable and consistent results.
Analyzing customer data using quantitative methods can provide clear insights into user behavior and preferences, helping businesses make data-driven decisions.
Enables analysis of large datasets
Quantitative data analysis can handle large datasets efficiently, enabling the identification of patterns and trends across extensive samples.
This capability makes it possible to draw broad, generalized conclusions that can be applied to larger populations. For example, a company might analyze usage data from thousands of users to understand overall engagement trends and identify areas for improvement.
Allows easy comparison across different groups, time periods, and variables
Quantitative data allows straightforward comparisons across various groups, time periods, and variables. This facilitates the evaluation of changes over time, differences between demographics, and the impact of different factors on outcomes.
For instance, comparing customer satisfaction scores before and after a product update can help assess the effectiveness of the changes and guide future improvements.
Cons of quantitative data analysis
While quantitative data analysis offers many benefits, it also has some drawbacks:
Lacks contextual understanding
Quantitative data can miss the deeper context and nuances of human behavior, focusing solely on numbers without explaining the reasons behind actions. For example, tracking user behavior may show usage patterns but not the motivations or feelings behind them.
Requires analytical expertise
Accurate analysis and interpretation of quantitative data require specialized skills. Without proper expertise, there is a risk of misinterpretation and incorrect conclusions, which can negatively impact decision-making.
Influenced by data collection quality
The reliability of quantitative analysis depends on the data collection methods and the quality of measurement tools. Poor data collection can lead to data discrepancies, affecting the validity of the results. Ensuring consistent, high-quality data collection is essential for accurate analysis.
How to collect data for quantitative research?
Collecting data for quantitative research involves using systematic and structured methods to gather numerical information. Let’s look at a few methods in detail.
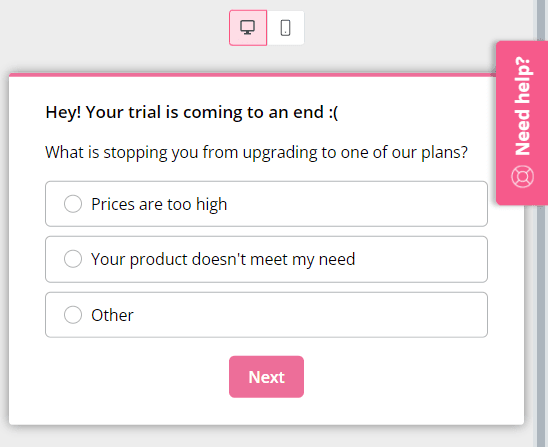
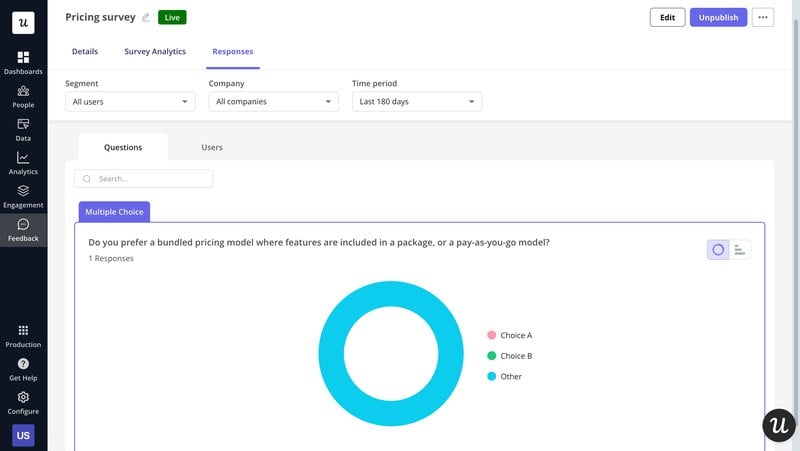
Customer feedback surveys
Customer feedback surveys are a key method for collecting quantitative data. Tools like Userpilot can trigger in-app surveys with closed-ended questions to ensure consistent data collection.
Conducting these surveys quarterly or after a specific period helps track changes in customer satisfaction and other important metrics. This approach provides reliable, numerical insights into customer opinions and experiences.
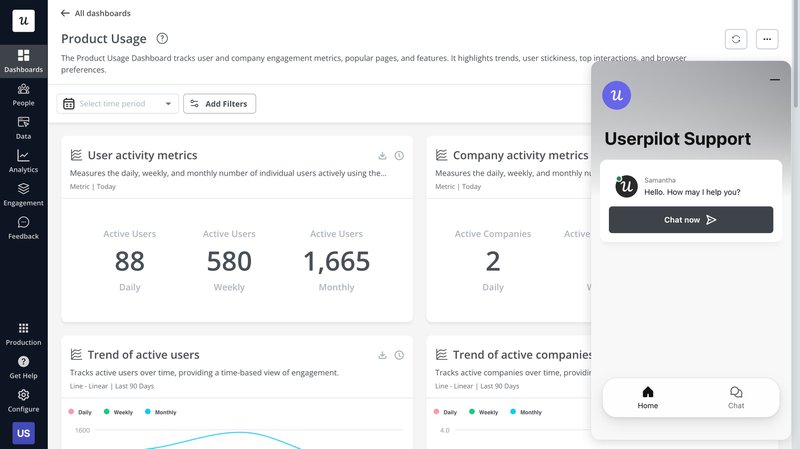
Product usage data
Product analytics tools are essential for tracking user interactions and feature usage. Utilizing these tools allows you to monitor metrics such as user sessions, feature adoption, and user engagement regularly.
This quantitative data provides valuable insights into how users interact with your product, helping you understand their behavior and improve the overall user experience.
Customer support data
Tracking customer support data is crucial for quantitative research. You can record details such as ticket number, issue type, resolution time, and customer feedback by monitoring support tickets.
Organize these tickets into categories, such as feature requests, to identify common problems and areas needing product improvement. This approach helps understand customer needs and enhance overall service quality.
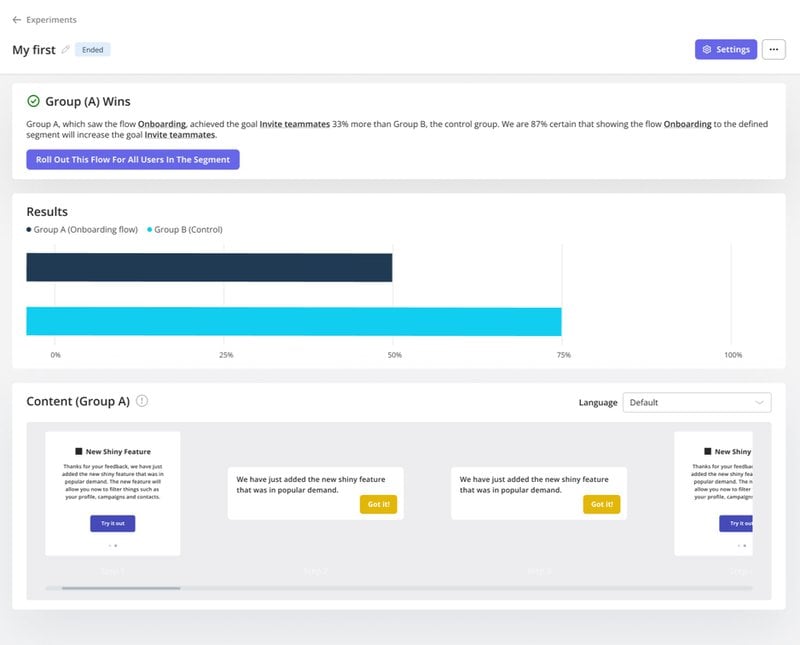
Experiments
Implementing experiments, such as A/B tests, is a powerful method for collecting quantitative data. By comparing the performance of different features or designs, you can gain valuable insights into what works best for your users.
Use the insights gained from these A/B tests and other product experimentation methods to make informed decisions that enhance your product and user experience.
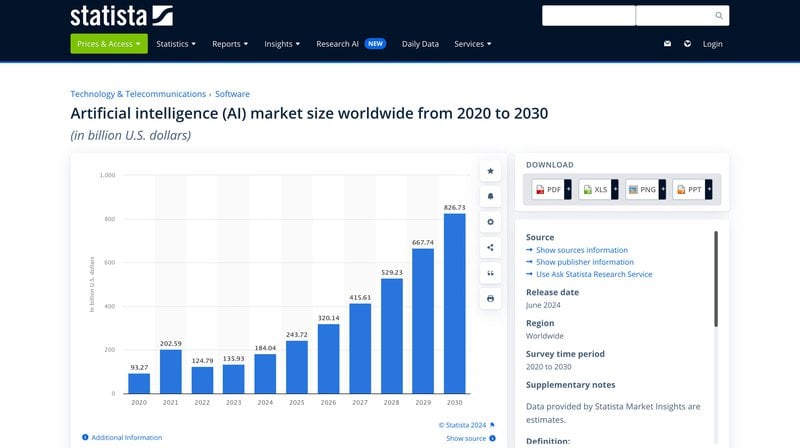
Open-source datasets
Searching for datasets on platforms like Kaggle or Statista can provide valuable information relevant to your research. However, to avoid issues with data discrepancy, ensure these datasets are accurate and reliable before incorporating them into your analysis.
Utilizing accurate open-source datasets can significantly enhance your product analysis by providing a broader context and more robust quantitative data for comparison and insights.
Quantitative data analysis methods for gathering actionable insights
Analyzing quantitative data involves using various methods to extract meaningful and actionable insights. These techniques help understand the data’s patterns, trends, and relationships, enabling informed decision-making and strategic planning.
Statistical analysis
Statistical analysis involves using mathematical techniques to summarize, describe, and infer patterns from data. This method helps validate hypotheses and make data-driven decisions.
For SaaS companies, statistical analysis can be crucial in understanding user behavior, evaluating the effectiveness of new features, and identifying trends in user engagement.
By leveraging statistical techniques, SaaS businesses can derive meaningful insights from their data, allowing them to optimize their products and services based on empirical evidence.
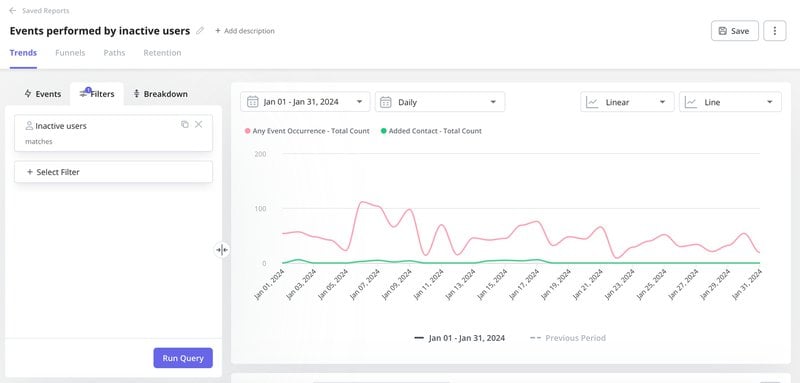
Trend analysis
Trend analysis involves tracking quantitative data points and metrics to identify consistent patterns. Using a tool like Userpilot, SaaS companies can generate detailed trend analysis reports that provide valuable insights into how various metrics evolve.
This method enables SaaS companies to forecast future outcomes, understand seasonal variations, and plan strategic initiatives accordingly. By identifying trends, businesses can anticipate changes, adapt their strategies, and stay ahead of market dynamics.
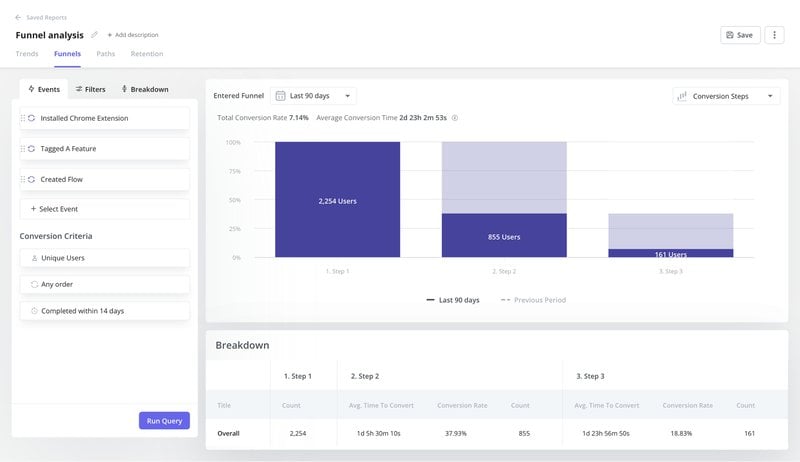
Funnel analysis
Funnel analysis defines key stages in the user journey and tracks the number of users progressing through each stage.
This method helps SaaS companies identify friction and drop-off points within the funnel. By understanding where users are dropping off, businesses can implement targeted improvements to enhance user experience and increase conversions.
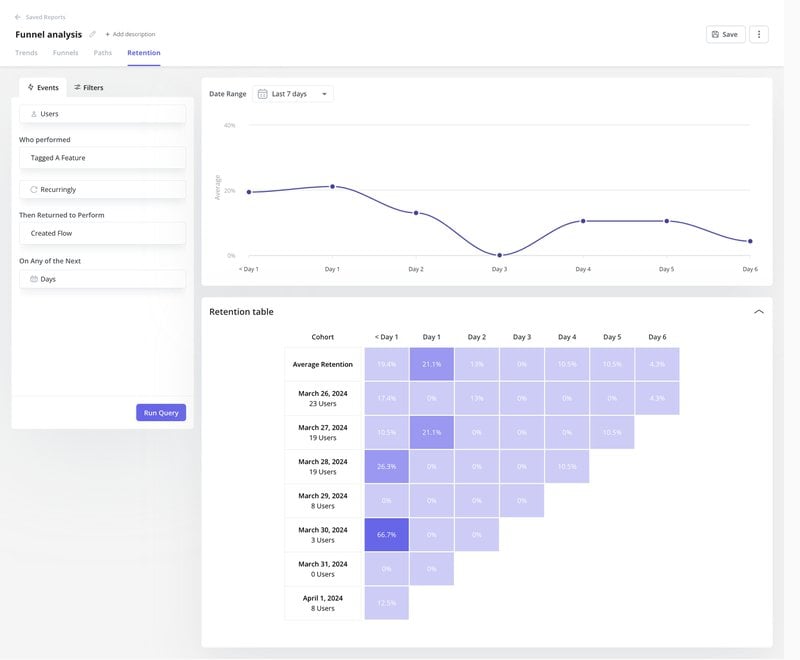
Cohort analysis
Cohort analysis groups users into cohorts based on attributes such as the month of sign-up or acquisition channel and tracks their behavior over time.
This method allows SaaS companies to understand user retention and engagement patterns by comparing how cohorts perform over various periods. By analyzing these patterns, businesses can identify successful strategies and improvement areas.
Path analysis
Path analysis maps user journeys and analyzes the actions taken by users. This method helps SaaS companies identify the “happy path” or the optimal route users take to achieve their goals.
By understanding these paths, businesses can streamline the user experience, making it more intuitive and efficient.
Feedback analysis
Feedback analysis involves using questionnaires and examining responses to close-ended questions to identify patterns in customer feedback. This quantitative data helps you to understand common user sentiments, preferences, and areas needing improvement.
Businesses can make informed decisions to enhance their products and services by systematically analyzing feedback.
Conclusion
Collecting quantitative data is important if you want a product that will succeed. Your customers are the only people who can signal your success, so speaking to them and analyzing the quantitative data you collect will help you to produce the best product you can.
About the author