Trend analysis reports help you make data-driven decisions that boost SaaS performance metrics such as user activation, product stickiness, and retention.
But where do you start from, what data points should you track, and how can you leverage these insights?
This article helps answer core trend analysis questions. As you read on, you will also find use cases and examples to inspire your own analytics.
Try Userpilot Now
See Why 1,000+ Teams Choose Userpilot

What is trend analysis?
Trend analysis is the process of tracking and analyzing changes in key metrics over time.
By analyzing this data, you can spot patterns and…
- Identify trends in growth, decline, or stagnation
- Determine the most important drivers of change
- Forecast future events based on historical trends
- Make informed decisions about product development, marketing, and sales
With all this data in one place, you can keep track of seasonal changes, investigate any unusual numbers, and predict future trends. Consequently, trend analysis gives you the data to make better product decisions.
Types of trend analysis reports to collect actionable insights
Trend analysis is widely implemented across different industries to serve varying purposes.
For example, you can use trend analysis for:
- Market trends report
- Consumer insights report
- Financial statements trends report
- Future stock price movements analysis.
In SaaS, trend analysis helps to understand customer behavior and predict future events based on current and historical data. You can use it to answer questions related to growth, such as: Which products or features are most popular with customers? Has the customer experience improved this quarter compared to the last?
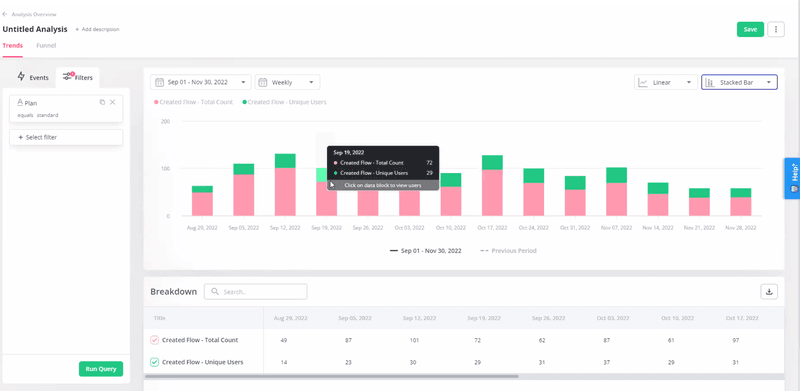
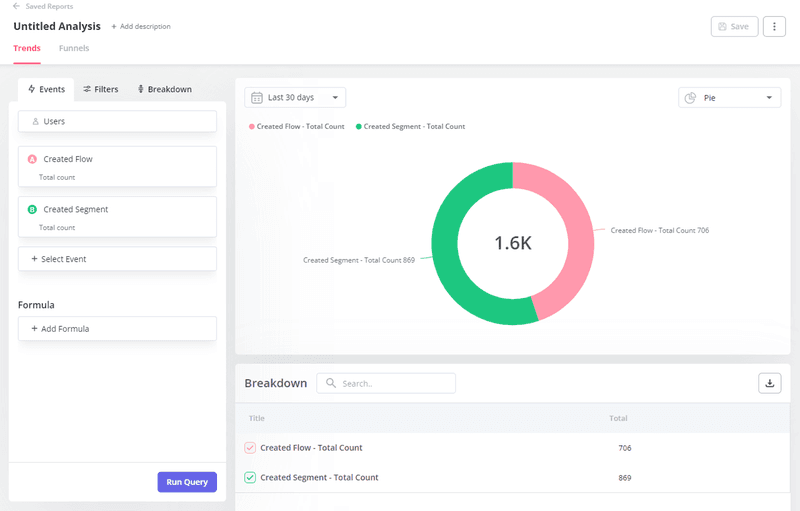
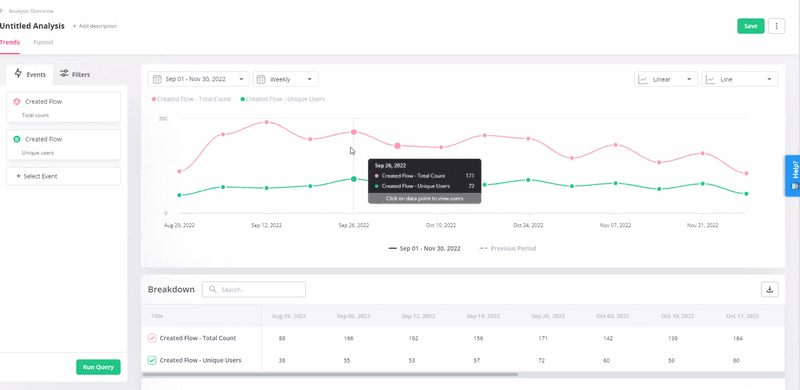
For example, consider this trend report generated with Userpilot. At a glance, the breakdown shows you month-to-month growth along with user engagement over time. This can help you understand how changes in your app are influencing product stickiness.
What are the benefits of trend reports?
Trend reports enable you to make data-driven decisions. These help product managers build powerful products and deliver positive customer experiences. Let’s learn how.
Guide product planning
Product planning ensures your tool remains valuable to users, but you need user data to find the right direction. This is where trend analysis comes in.
By regularly tracking trends in product usage, you’re able to stay informed on changing customer needs and are better positioned to create an effective roadmap. For example, your usage reports can help identify popular features. You can then build these features further to deliver greater value to your users.
Spot changes in user behavior
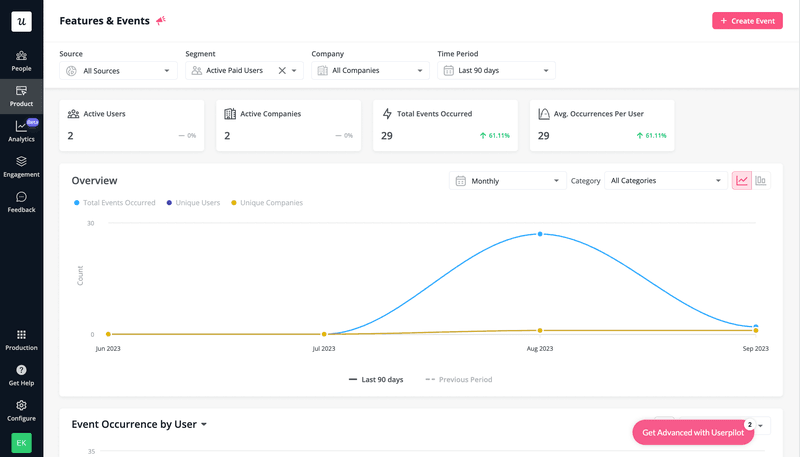
By analyzing trends in user engagement metrics, such as decreased login frequency or reduced feature usage, you can detect early signs of user dissatisfaction or friction with the product.
These subtle changes often go unnoticed until they become an issue, but regular trend analysis helps you spot and address them well before time.
Understand user sentiment and customer satisfaction
Tracking feedback survey trends allows you to monitor changing trends in user satisfaction regularly. This is extremely crucial in the competitive world of SaaS where new and stronger competition is always creeping up.
But how do you do this?
Set benchmarks and customer satisfaction goals for your team and monitor the numbers you average over time. When you see a healthy customer satisfaction score dip, you know it’s time to take action.
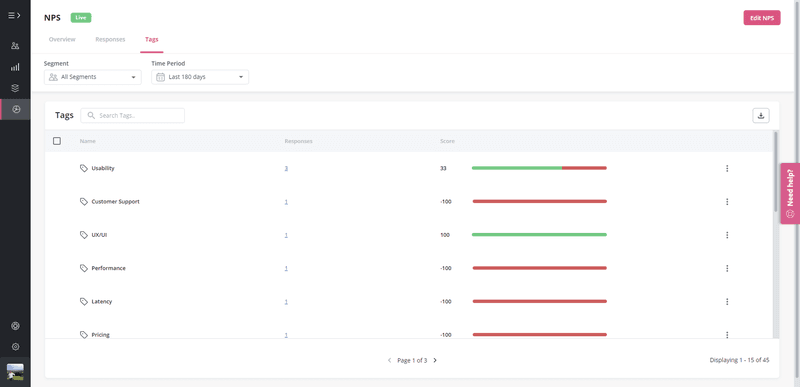
For example, you might notice that customers with high NPS scores often quote “fast and responsive customer support” in their feedback, while those with low scores complain about “frequent bugs”.
These can be great indicators of what to double down on and what to eliminate to improve customer satisfaction.
How to create a trend analysis report
Now that you’ve seen the benefits, it’s time to begin reaping them. Follow these five steps to create comprehensive trend reports for your product.
1. Define what aspect needs to be analyzed
Start by defining what part of the user journey you want to analyze and improve upon. This objective will help formulate questions for your trends analysis, enabling you to drive core insights.
Keep in mind that your objective needs to be specific and actionable, such as reducing churn rate for new users or improving adoption rates for a new feature.
2. Define relevant metrics for your analysis
After defining your objectives and scope, the next question to answer is: which metrics will tell us how we’re performing currently, and which data points will we need to improve?
Here are some examples of trend analysis objectives and the corresponding metrics to look at.
Objective: Measure user engagement with a new feature
- Question: How many users have adopted the newly released feature, and how has this adoption trend evolved?
- Metric: Feature adoption rate
Objective: Measure website landing page performance
- Question: Are visitors effectively navigating from the landing page to other sections of the website? Are they easily navigating to the sign-up page?
- Metric: Click-through rate, bounce rate, page views
Objective: Improve customer support ticket resolution
- Question: How quickly are customer support tickets being addressed, and is there a noticeable trend in response times that may impact customer satisfaction?
- Metric: Average response time
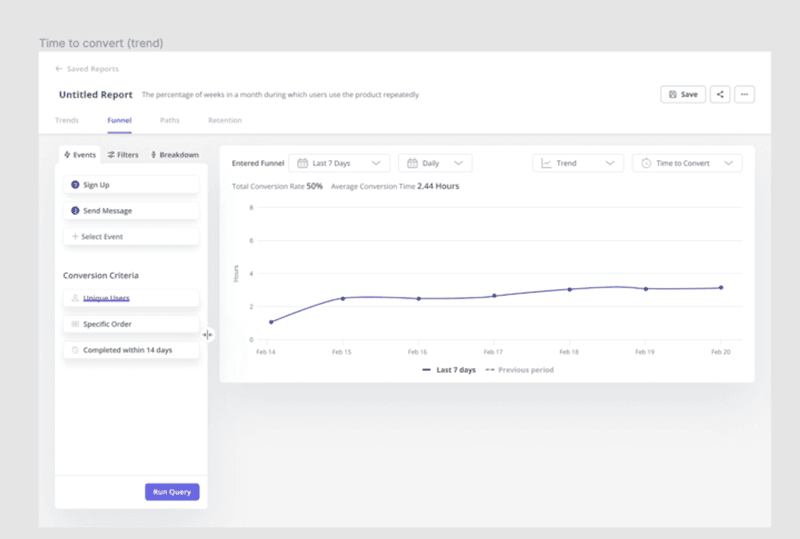
3. Use cohorts for relevant insights
Cohorts are groups of users that share a common characteristic, such as the date they signed up for your product or the features they use.
Using cohorts for your analysis can help you identify trends that are specific to certain user groups, such as their needs and preferences. For example, you might want to compare the device preferences of different cohorts, such as users who signed up in the last month vs. users who signed up over a year ago.
Cohorts work well when you’re looking into specific searches like the example above. Extra data might alter the results. So, always aim for trend reports of highly specific user segments.
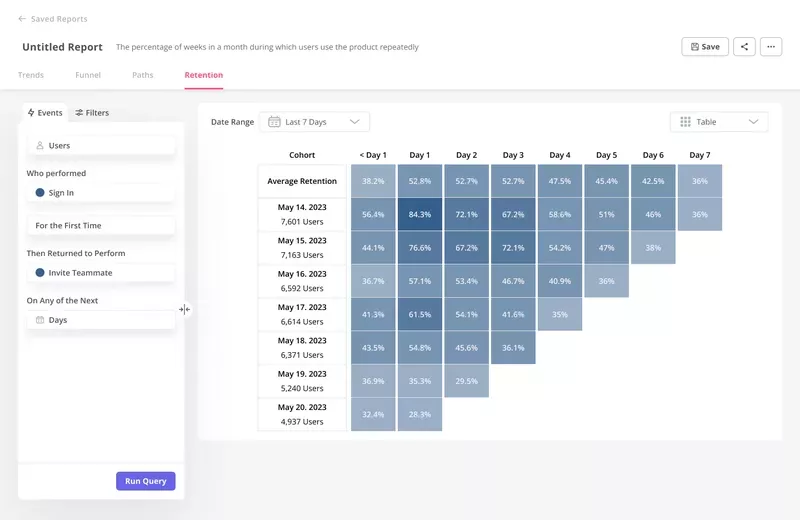
4. Set a relevant and specific period of time
Determine the time frame for your trend analysis. The period should align with your objectives and be enough to gather relevant data.
Compare data from different periods to see if any change has occurred. For instance, you can view historical data for engagement with a specific page of your app and contrast it with data for the same period from last month/year.
This approach is particularly useful for spotting seasonal trends and predicting future behavior.
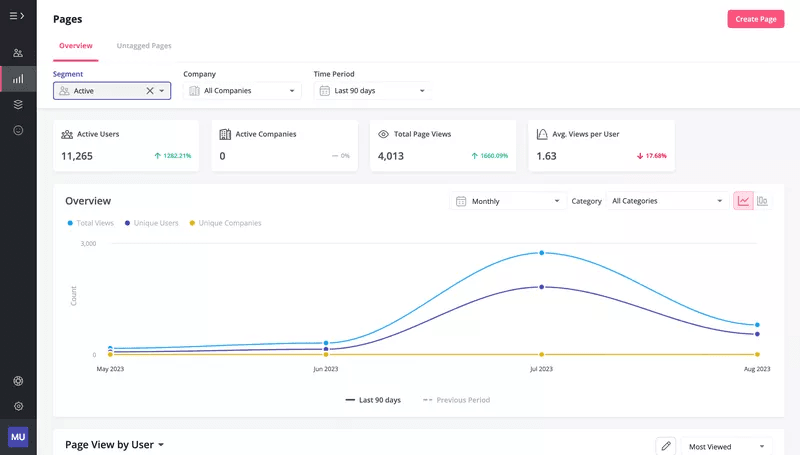
5. Visualize and save reports to spot trends over time
There’s no point in performing trend analysis and collecting historical data if you aren’t going to act upon your observations. You need to share your insights with key stakeholders and plan the next steps.
Visualization is a vital part of this process as it helps make complicated numbers easy to understand and interpret.
Fortunately, most trend analysis tools contain multiple visualization options for your trend analysis reports —bar charts, pie charts, line graphs, etc., depending on your preferences and the tool you’re using.
Trend analysis report use cases and examples for understanding customer behavior
Wondering where to begin your analysis, or just need some inspiration?
Here are some use cases for trend analysis in SaaS.
1. Compare active users’ trends with trial users
Compare data for paying users vs. trial users over time. Aim to analyze the conversion rate and find reasons to explain the positive or negative patterns in the data.
For example, if you have more trial users than paying customers, you could be targeting the wrong audience, or your onboarding flow isn’t effective. Those could be areas to look into.
Fortunately, you don’t have to guess the answer.
Use trend analysis to see why trial users aren’t converting—check which features they are engaging with or not to understand if they are not converting due to a lack of getting value from the product.
Through trend analysis paired with feedback analysis, you can know if it’s an onboarding problem or not.
2. Understand product adoption and usage trends
Track product usage across different variables to see how well users have adopted it. In addition to trend reports, other reports that can help you monitor usage are:
- Funnel reports to see how many users progress through the funnel to complete an action.
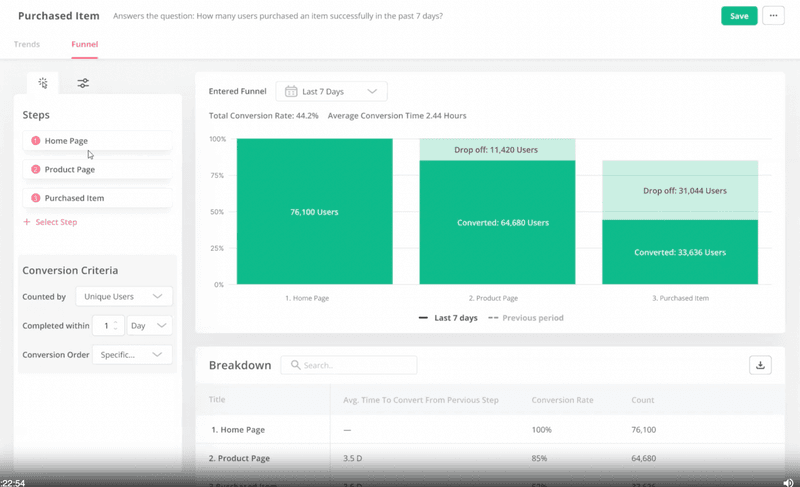
- User path reports for a technical analysis of how users find their way to the feature.
You’ll naturally find positive and negative usage trends across these. Boosting the positive trends and reducing the negative ones are the keys to product success.
For instance, if the data shows users aren’t adopting a specific feature, investigate further.
Some areas you can look into are how easily users find their way to a specific feature, how intuitive the user experience is, and whether the feature is solving the problem. You might need to improve your in-app guidance to make the feature easier to access and use.
3. Understand what drives customer satisfaction
Use trend reports to track features that contribute to boosting key metrics such as user activation, product adoption, and retention.
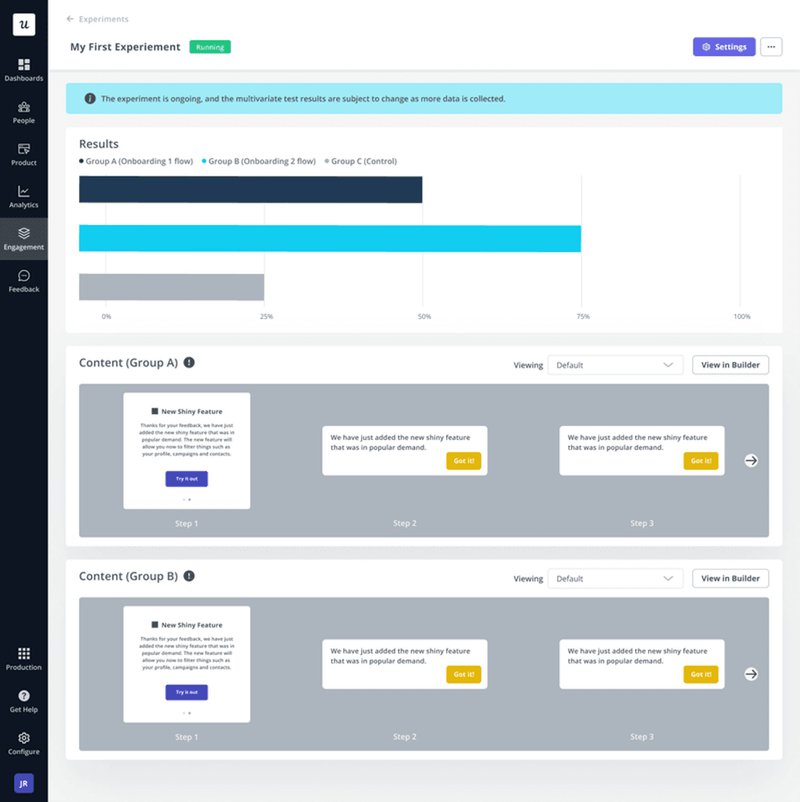
Continuously optimize these features so they deliver the best value to users. One way to do so is by running A/B tests on UI/UX enhancements to understand what drives better engagement.
To run an A/B test, start with a hypothesis such as “A side-bar menu will offer higher feature discovery compared to a top-bar menu.” Confirm or reject your hypothesis by creating two user segments and sending them a different variation each.
4. Pair trends analysis with funnel reports
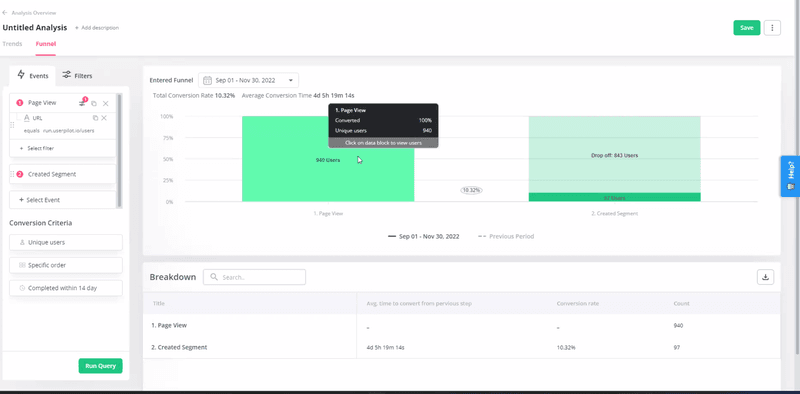
Pairing trend analysis with funnel reports provides a holistic view of user behavior and the conversion process.
Track your customer journey map and monitor how users behave at each stage. This will allow you to flag drop-off points and devise strategies for trend reversal, such as diagnosing a drop in a retention report.
Userpilot: Best trend analysis reports tool for SaaS
Userpilot is a product growth platform with analytics to help you track and analyze trends in user behavior.
With Userpilot you can:
- Create and save reports: Userpilot automatically keeps track of all your product reports. Create tons of different reports to monitor product metrics and discover key insights.
- Analyze user interactions: Tag specific features of your app and see how users engage with them over time. You can also create Custom Events that club multiple features and user actions together to better understand the big picture.
- Customize your reports: Visualize your reports however you like. Userpilot lets you create pie charts, bar graphs, and more. You can also filter your results based on different properties for more granular insights.
- Use formulas to dig deeper into data: Add various formulae to your reports and see the results change in real time based on your operators.
- Run customer satisfaction surveys: Gather qualitative and quantitative insights directly from your users. Host in-app surveys by using the built-in templates or create your own to tap into user sentiment.
Conclusion
Regular trend analysis can help spot both minor and major changes in user behavior that impact growth. Taking this proactive approach toward product enhancement will help you drive better engagement, retention, and revenue.
Userpilot can help you generate dynamic trend analysis reports for your SaaS. Book a demo now to see how our platform can help you gather in-app behavior data, trigger and analyze feedback surveys, and make improvements to drive growth.


