
Behavioral and product analytics is paramount for SaaS companies aiming to optimize their products and enhance user experience. To achieve this, leveraging user behavior analytics software becomes indispensable.
In this article, we’ll highlight 9 best options and their main features for behavioral analytics!
Try Userpilot Now
See Why 1,000+ Teams Choose Userpilot

Overview of user behavior analytics software
- User behavior analytics involves tracking user activity for analyzing metrics like engagement and conversions.
- When choosing user behavioral analytics tools, look for features like event tracking, behavior reports, etc.
- These tools can be categorized into two main types based on the data they track: quantitative and qualitative.
- To help you narrow down the options, here are the top choices.
- For collecting and analyzing qualitative user behavior data, we have:
- Userpilot is a product growth platform that drives user activation, feature adoption, and expansion revenue. It also helps collect in-app feedback, streamline onboarding, and gather actionable insights from analytics.
- Heap is a robust product analytics platform that provides users with in-depth insights into user behavior and needs.
- Mixpanel is an advanced user behavior analytics tool that allows tracking and analyzing in-app product engagement.
- Amplitude is a powerful analytics tool for real-time insights into product usage and user behavior.
- If you are looking for a free option, Google Analytics is the right fit. It is a web analytics service offered by Google that tracks and reports website or app traffic and events.
- For collecting and analyzing quantitative user behavior data, we have:
- FullStory is a user behavior analytics solution that comes with Session Replays and Heat maps. It works for both web and mobile apps.
- Hotjar is another robust customer and website analytics tool that comes with features like heat maps and in-app feedback surveys.
- Baremetrics is a subscription analytics and insights management platform that helps businesses get hundreds of valuable metrics and insights, achieving real-time growth.
- GainsightPX is a powerful product experience platform that helps you gather insights into how users interact with your software or app.
- If you seek a user behavior analytics tool that facilitates action based on collected data, book a Userpilot demo to see how it helps!
What is user behavior analytics?
User behavior analytics (UBA) involves recording user activity, grouping them into behavioral cohorts, and analyzing metrics such as engagement and conversions.
Moreover, you can monitor how users are interacting with your product and how efficiently they’re passing through multiple stages of the user journey.
User behavior analytics also helps you identify the hurdles that your users come across so that you can find ways to ensure a smoother user experience.
2 Types of user behavior analytics tools
Behavioral analytics tools vary in their capabilities. While some tools help with tracking user interactions, others enable you to solicit direct feedback from users regarding your product.
In essence, these tools can be categorized into two main types based on the data they track: quantitative and qualitative data.
- Analytics tools for quantitative data analysis focus on tracking in-app behavior, usage patterns, user engagement, and core product metrics like stickiness, retention, etc.
- On the other hand, qualitative analytics tools continue by offering features like heatmap and user feedback, providing deeper insights into user interactions with specific elements.
Best user behavior analytics software for qualitative data
Qualitative data analysis is crucial for understanding user behavior on a deeper level, allowing businesses to make informed decisions. Let’s explore some of the best user behavior analytics tools that excel in collecting and interpreting qualitative data.
Userpilot
Userpilot helps product teams collect voice of the user feedback, streamline onboarding, and gather actionable insights from analytics – all without requiring technical expertise.
Main features
Here are some Userpilot features you can use for user behavior tracking:
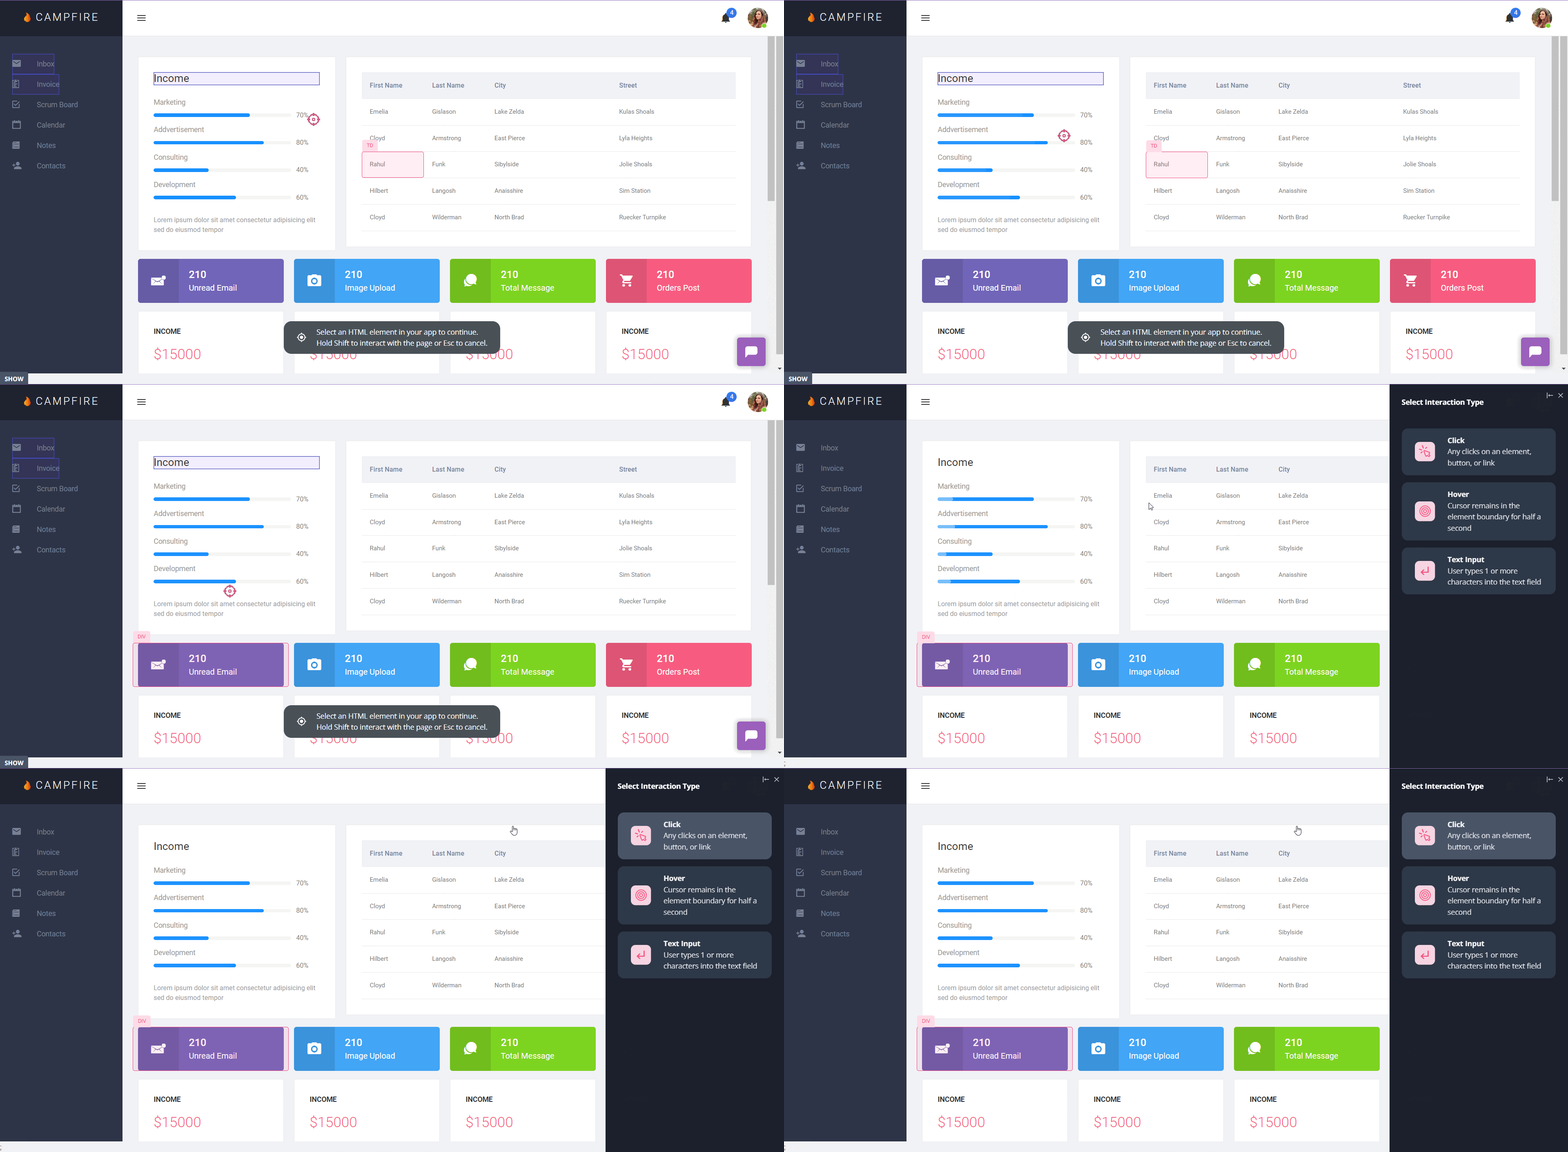
- No-Code Feature Tagging: Userpilot’s click-to-track feature tagger lets you mark features, buttons, and elements to collect behavioral data. You’ll be able to track user interactions such as clicks, hovers, or inputs to get an accurate behavioral view for specific features.
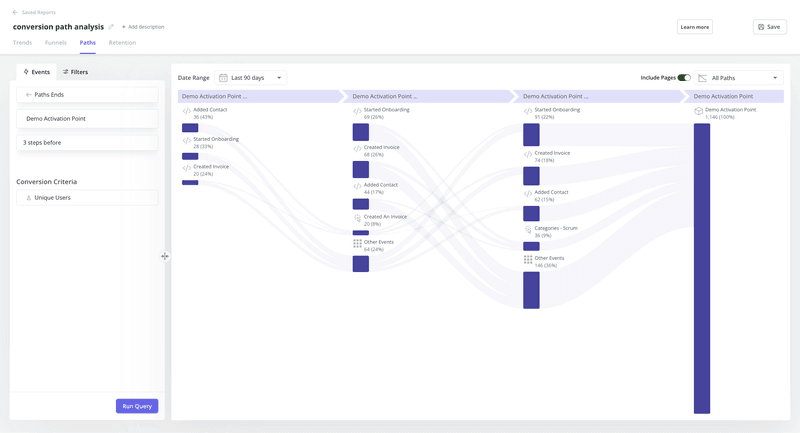
- Analytics reports: Userpilot comes with a wide range of analytics reports like trends, funnels, and paths. These reports let you track certain events like a specific feature’s usage, add filters to narrow down the data, and then create a breakdown based on segmentation data or user attributes — offering quick and actionable CX reports.
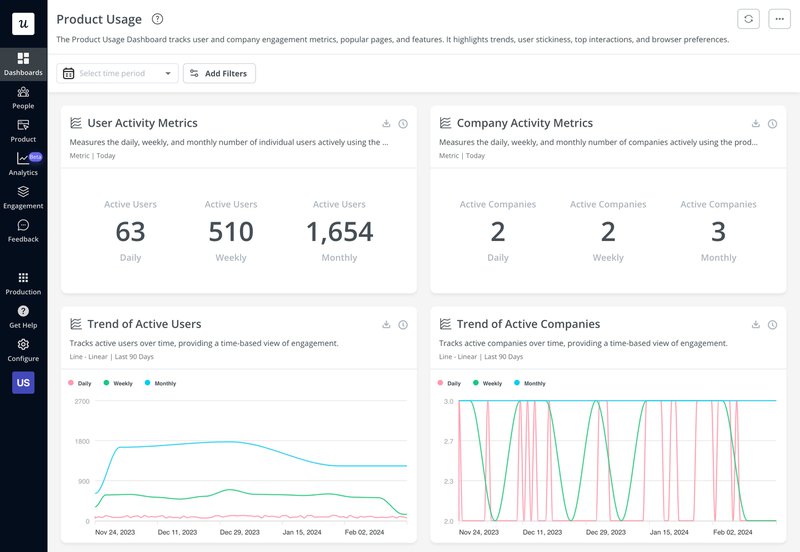
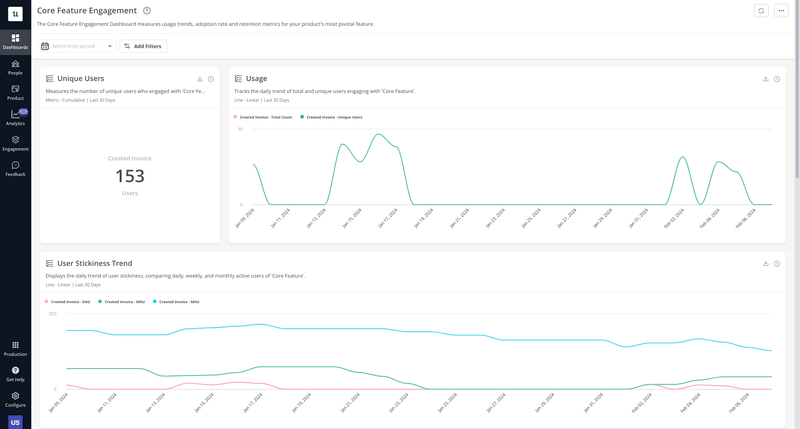
- Analytics Dashboards: Userpilot also comes with a wide range of dashboards to help you track all the core product metrics i.e. product engagement, activation, retention, etc. – these play as signals for customer behavior changes.
- User analytics: The Users dashboard gives you an overview of all your users while letting you sort by segment, company, or when they were last seen. You can also click on each user or company profile for a more granular data breakdown of Top events, Top pages, Sessions, etc. Tracking user/company behavior on an individual level helps you understand how specifically they engage with your product or platform.
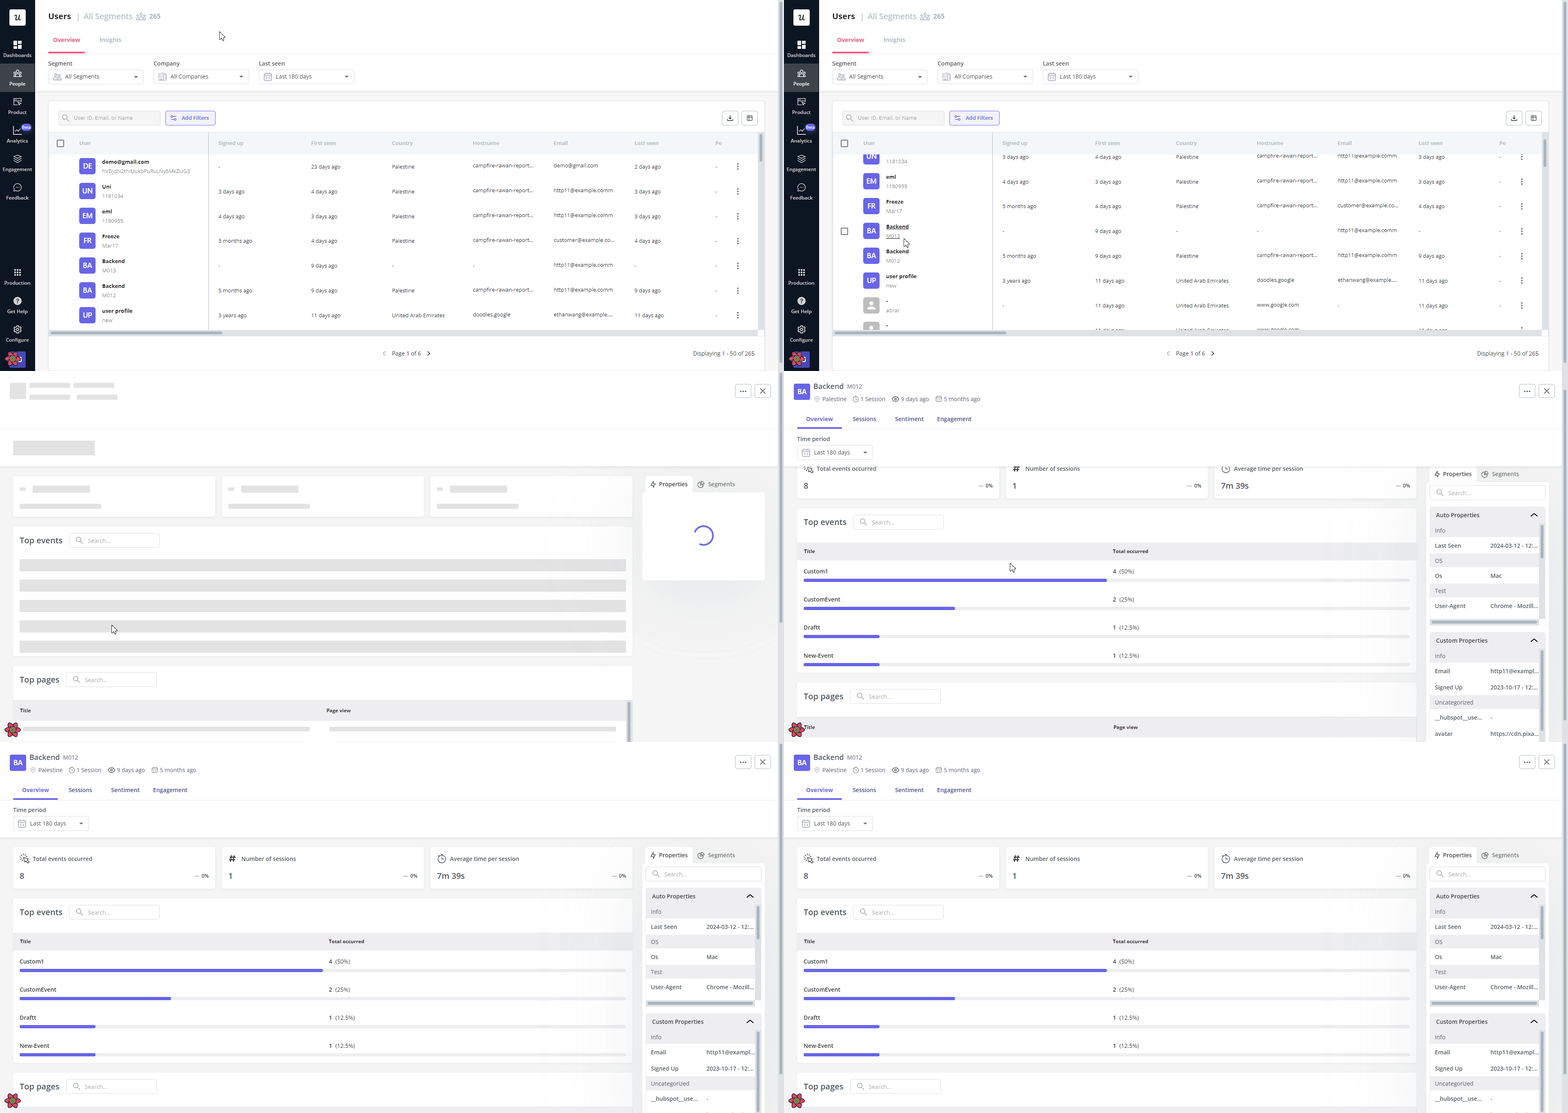
User profile analytics with granular insights into what feature a user often engages with[/caption]
Pricing
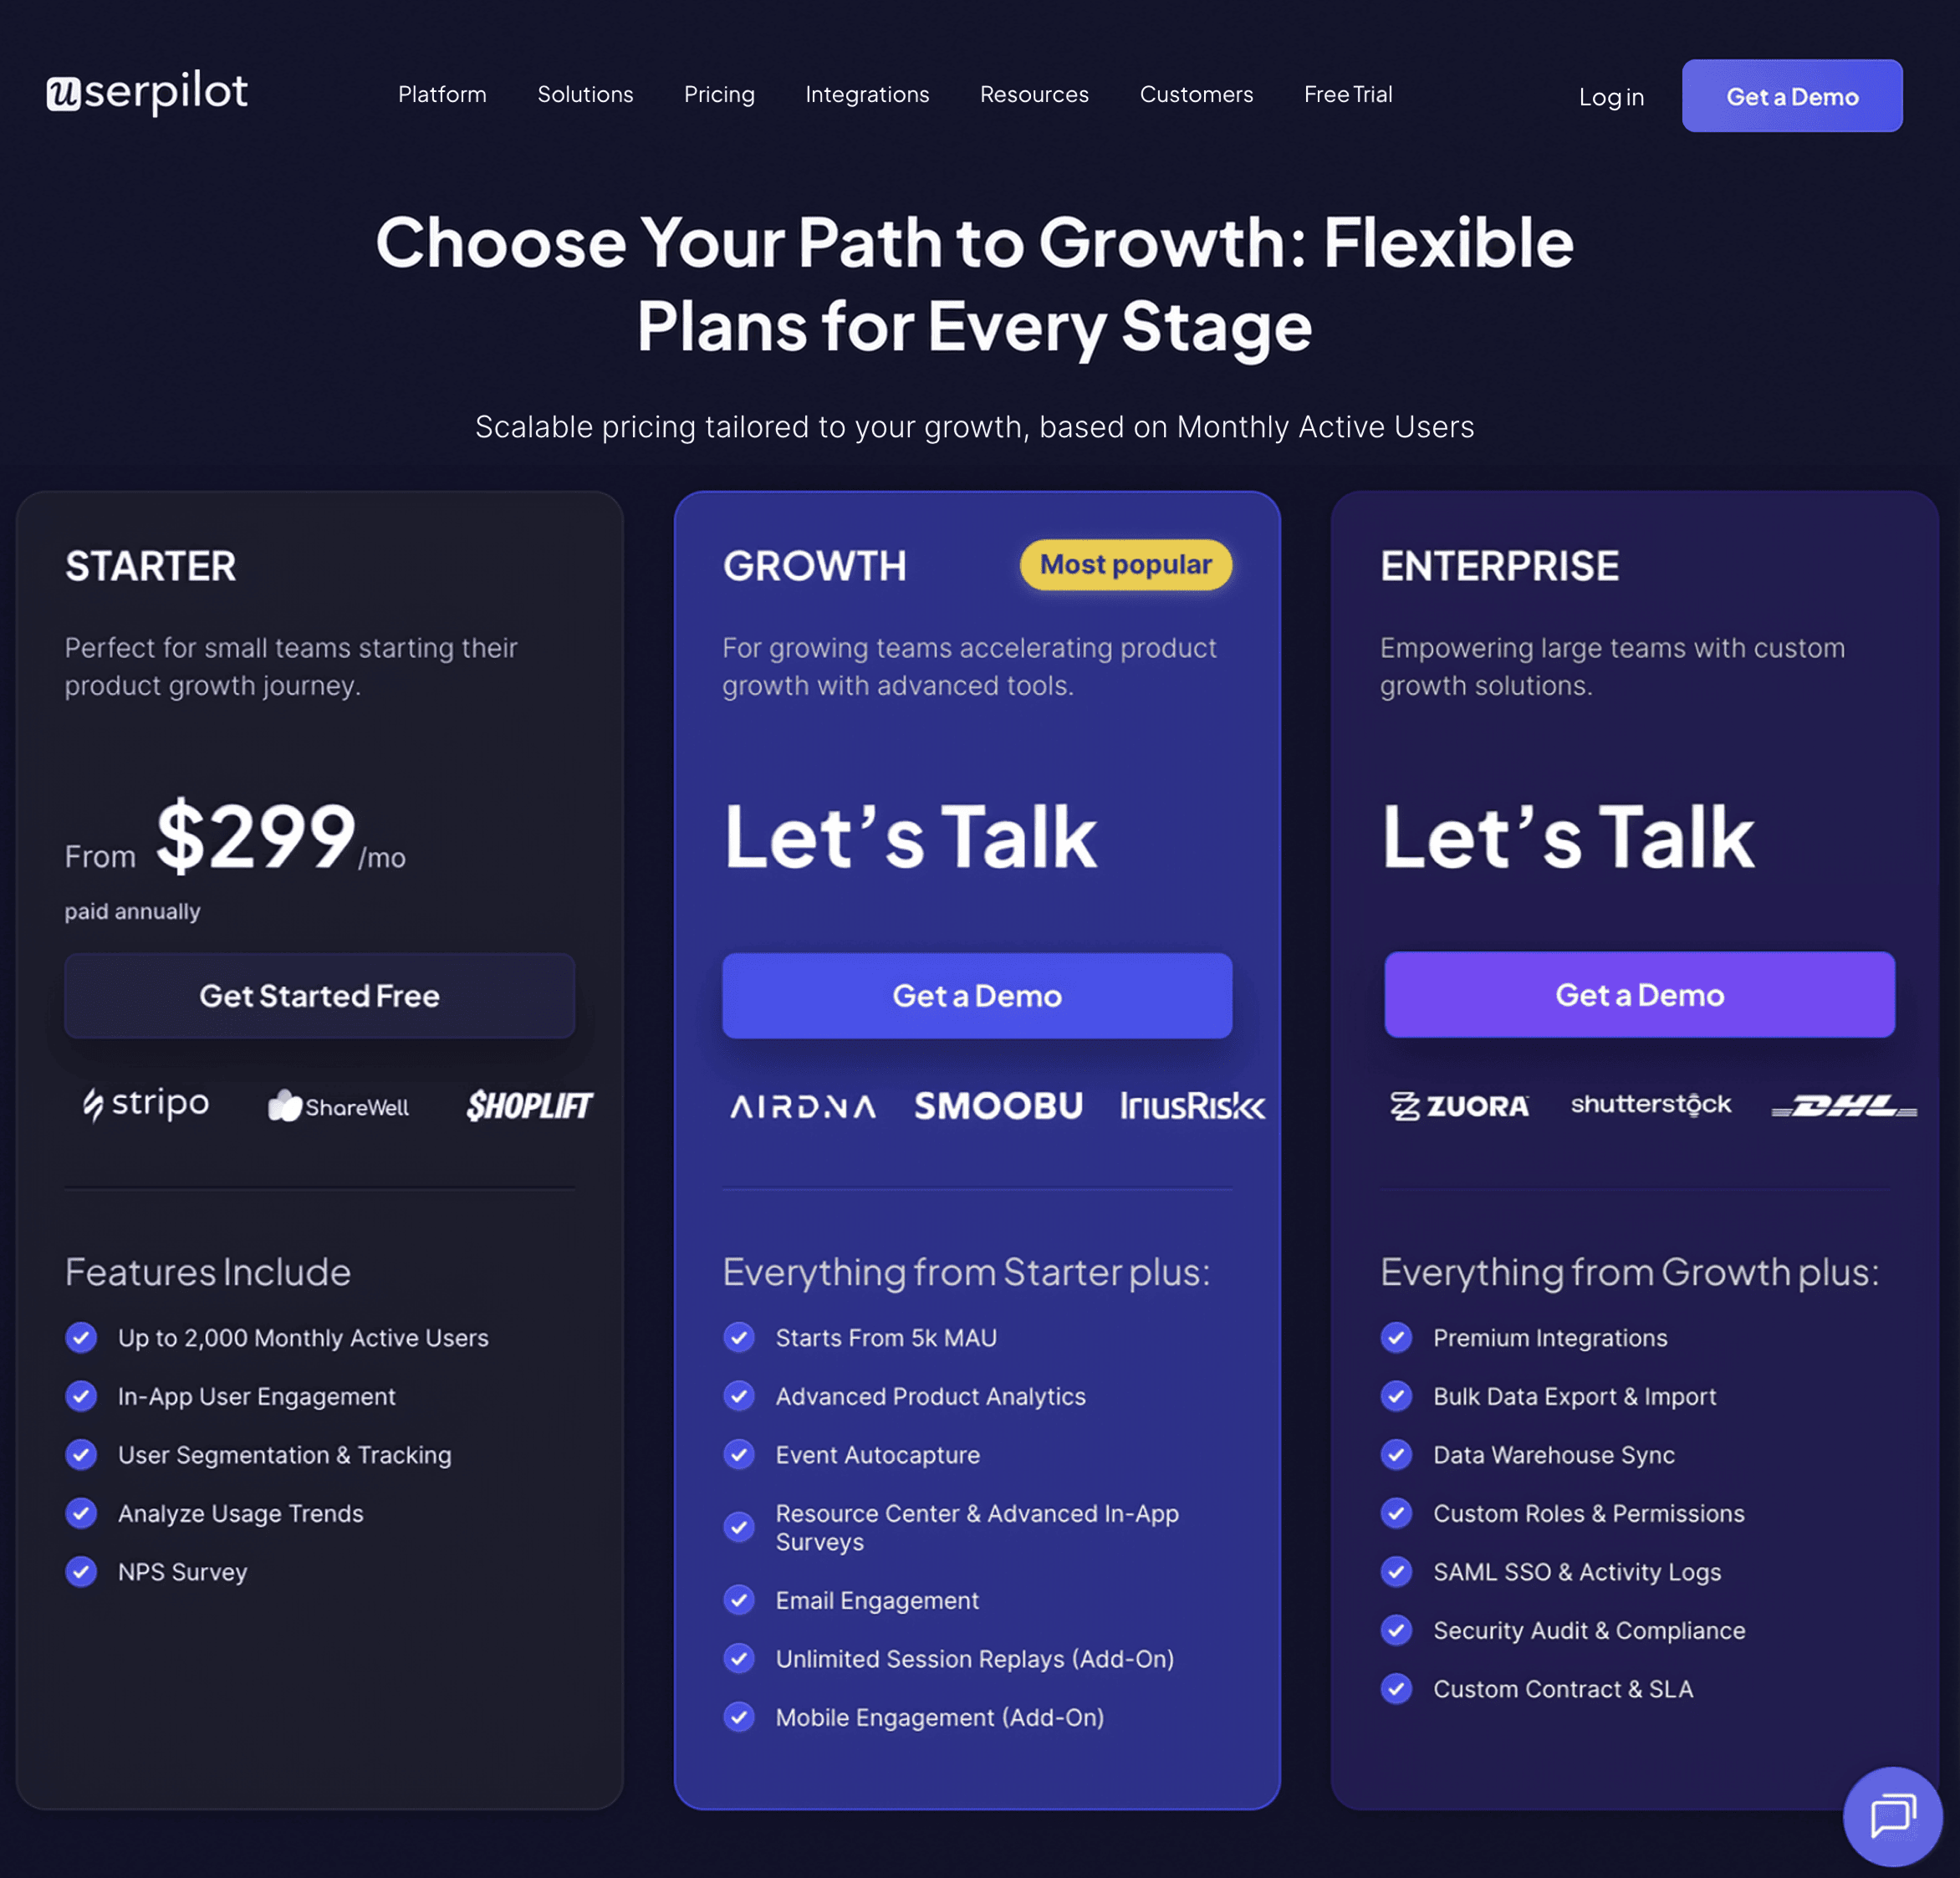
Userpilot offers flexible pricing based on your monthly active users (MAUs). Plans start at $299 per month for smaller teams and scale as your user base grows.
Below are the pricing tiers you can choose from:
- The Starter plan begins at $299/month (billed annually) for up to 2,000 monthly active users. It includes in-app user engagement, usage trend analysis, NPS surveys, and essential product analytics—ideal for mid-market SaaS teams getting started.
- The Growth plan offers custom pricing and adds advanced analytics, retroactive event auto-capture, in-app surveys, session replay, and more. It’s the most popular choice for growing teams that need deeper insights and scale.
- The Enterprise plan offers custom pricing and includes everything in Growth, plus bulk data handling, custom roles and permissions, SOC 2 Type 2 compliance, and enterprise-level support.
Heap
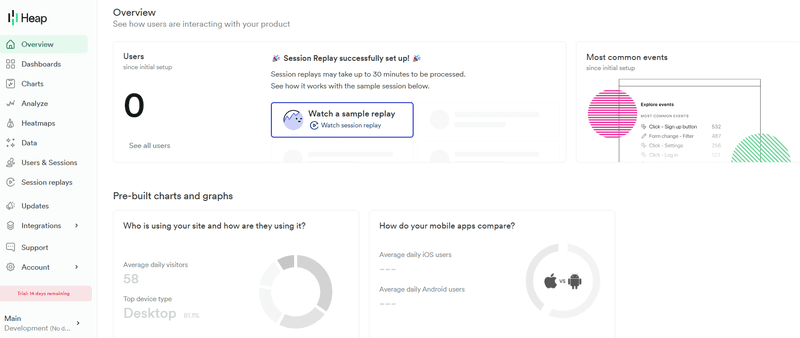
Heap is a robust product analytics platform that provides users with a plethora of in-depth insights into user behavior and needs. With Heap, you can collect user behavior data in real time across all touch points within your product.
Insights from Heap help you dig deeper into the paths users take when navigating your product and identify precise points of friction. Plus, the platform uses sophisticated data science capabilities to help you make better-informed, data-driven decisions to improve user experience.
Main features
Heap offers several features to help you track user actions, behavior, and properties. It lets you dig deeper into how users navigate your product and interact with different elements on a page.
The particularly useful features include:
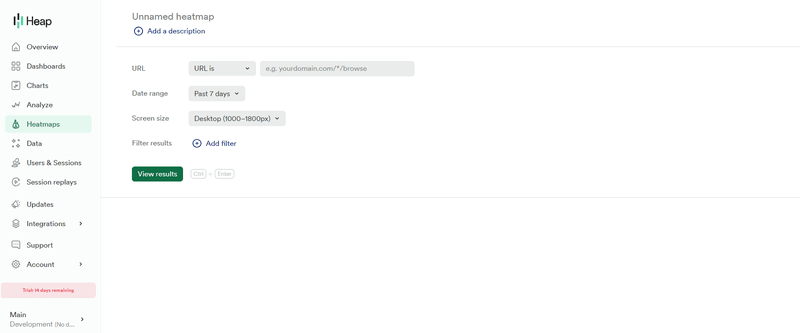
- You can use a variety of heatmaps (Clickmaps, Scroll Depth, and Attention Maps) to understand user intent, identify points of friction, and improve UI.
- The Session Replays feature lets you visualize the exact user journey when they perform an action.
- You can use the Funnels, Journey Maps, Engagement, and Retention analysis features for a more detailed look at how users interact with your product.
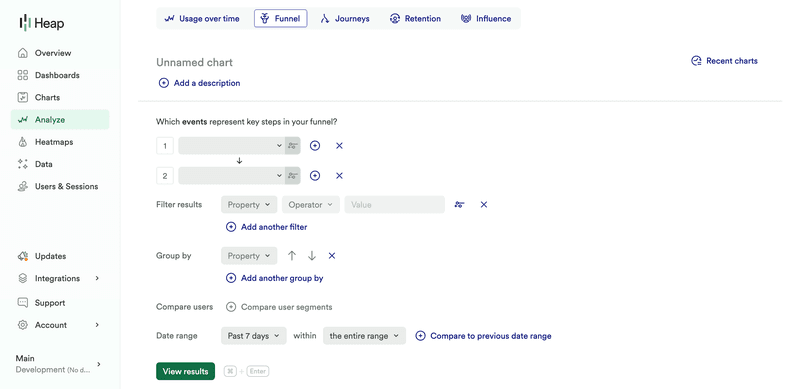
- You can segment users into different groups and filter all kinds of data for each segment. Loads of segment criteria are offered by Heap too.
- The Pro and Premier plans also offer account-based analytics to help you monitor account health and churn. It’s particularly valuable for B2B companies and helps minimize churn.
Pricing
Pricing for Heap is available on request. You’ll have to contact the sales team for a quote. The final price will depend on various factors, including the number of sessions and integrations you need.
That said, Heap offers a free plan that lets you track up to 10,000 user sessions per month and stores your data for 6 months. Review platforms like G2 say that paid plans start at $3,600 per year. All paid plans come with a 14-day free trial, too.
Mixpanel
Mixpanel is a simple and powerful user behavior analytics tool that allows product teams to track and analyze in-app product engagement. It allows your team to see every moment of the user experience clearly, so you can make changes that work.
In addition, it lets you explore data freely without using SQL. Set up your metrics to measure growth and retention. Slice and dice data to uncover trends and see live updates on how people use your app.
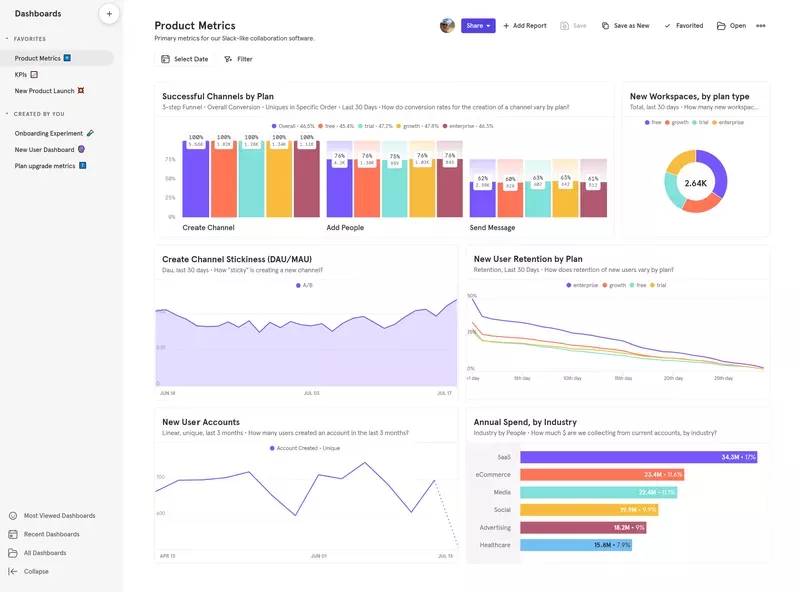
Main features
Mixpanel has features for behavioral analytics that help product teams and developers understand users’ actions.
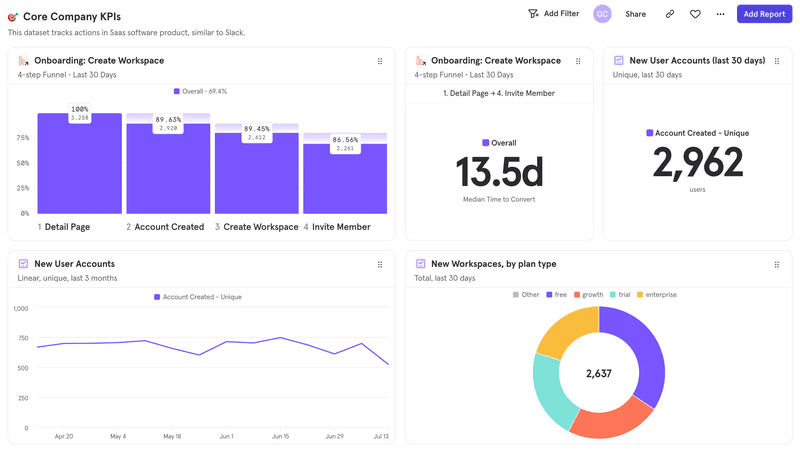
Below are features that are accessible for use when analyzing user behavior on Mixpanel:
- Funnels: To track users’ progress toward outcomes such as purchases or signups, Mixpanel’s funnel feature can help you with funnel reports. Funnels display a series of stages in a user journey and how many users progress from one stage to the next—for example, from download to sign up and purchase. If one stage has a low conversion rate, it’s a signal that that stage needs attention.
- A/B test segmentation: Mixpanel’s segmentation helps teams build more complete customer profiles and create cohorts (defined segments of users based on common important characteristics or experiences). Armed with this information, you can adjust your product and marketing to better address the specific needs of each segment or of the business.
- Data association: Each data point corresponds to a unique user ID, connecting events like sign-ups, cart additions, and interactions.
- Data customization: Mixpanel’s customizable data parameters allow precise user behavior insights, enabling behavioral segmentation for targeted campaigns.
- User activity tracking: Daily, weekly, and monthly active user reports (DAU, WAU, MAU) provide insights into user engagement trends.
- Integration flexibility: Mixpanel seamlessly integrates with tools like Segment, streamlining data sharing. SDKs and an import API further enhance data management.
Pricing
Mixpanel’s pricing plan is divided into 3 plans; the starter plan, the enterprise plan, and the growth plan.
Here’s an overview of the pricing plans and features of each plan:
- Starter plan: This plan features essentials to find product-market fit. It is free and allows up to 20M monthly events.
- Growth plan: This plan costs $20+ per month for up to 100M monthly events. You get all features in the starter plan plus unlimited saved reports to monitor, update, and iterate on KPIs, Mixpanel modeling layer, and group analytics and data pipeline add-ons.
- Enterprise plan: This plan empowers your team, especially if you have a large organization. It costs $833+ per month for up to 5M-100M+ monthly events.
Amplitude
Amplitude is a powerful analytics tool that gives organizations in-depth, real-time insights into product usage and user behavior.
With Amplitude, you can create a custom dashboard to collate multiple charts and reports on a single page. Amplitude’s robust behavior analytics help product and growth teams improve product adoption, identify new monetization opportunities, and maximize customer lifetime value.
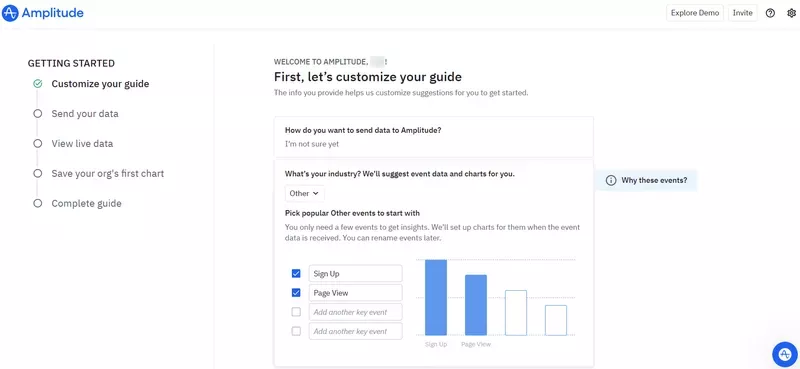
Main features
It offers various features, including event segmentation, funnel analysis, user cohorts, and retention analysis. With Amplitude, you can create a custom dashboard to collate multiple charts and reports on a single page.
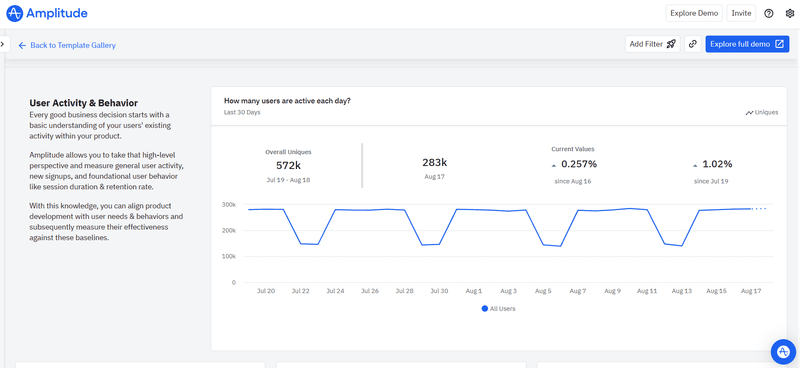
When it comes to user behavior analytics, the most helpful features include:
- Event tracking – You can set up and track custom events to monitor user actions.
- User segmentation – You can group users into different segments and monitor how each segment navigates your product.
- User journey mapping – Amplitude’s Pathfinder feature helps you understand how individual users move through your product.
- Other features, such as user cohorts and retention analysis, also come in handy.
Pricing
Amplitude offers three distinct pricing tiers:
- Starter – A free plan suitable for small teams.
- Growth – Suitable for teams that need to scale fast; pricing is available on request and depends on your requirements.
- Enterprise – Includes advanced governance and security features; pricing is available on request.
However, it’s worth noting that Amplitude’s pricing plans are complex because they’re based on the number of monthly events or features. Other tools like Mixpanel and Userpilot offer more transparent pricing based on the number of monthly active users.
Google Analytics
If you are looking for the best user behavior analytics tool yet free, Google Analytics is the right fit. It is a web analytics service offered by Google that tracks and reports website or app traffic and events, currently as a platform inside the Google Marketing Platform brand.
Main features
Here’s a closer look at some of Google Analytics features for user behavior analytics:
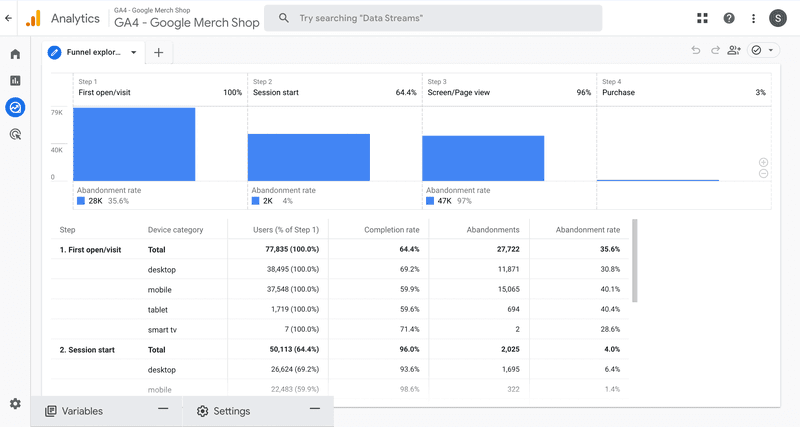
- Users and Active Users: Google Analytics displays the number of users who viewed or interacted with the site or app. Teams can access the Active Users report to see the number of unique users who started sessions on the site or app within a specific timeframe.
- New vs. Returning User: Cookies allow Google to monitor user activity. Cookies are unique to each browser and device. Google creates a distinct ID for each user’s browser or device and stores it in GA when they visit a website. And distinguish between new users (first-time visitors) and returning users (previous visitors).
- User Exploration: You can use Google Analytics’s User Explorer to get detailed information about specific groups of users. For example, a group of users who interacted with your app and website.
The GA4 reports these activities, including views, events, purchases, and goal achievements.
However, you should note that Google Analytics cannot be used to perform cohort analysis, as the data is not identifiable. However, it is still great for time-based analytics.
Pricing
It is a free product analytics tool with paid upgrades available for advanced features. It has two price plans: the free and 360 plans respectively:
- Google Analytics offers a free version that provides a wide range of features for basic website analytics. It’s suitable for individuals, small businesses, and websites with relatively low traffic.
- GA 360 (now GA4) provides higher data limits, BigQuery integration, service level agreements, and more with costs starting from $12,500 per month and $150,000 per year.
Best user behavior analytics software for quantitative data
These tools are designed to capture and interpret numerical data, providing valuable insights into user interactions, patterns, and metrics. Let’s explore some of the top choices for extracting quantitative data.
FullStory
It is a user behavior analytics tool that helps you track a broad range of metrics through the likes of pre-recorded and real-time customer sessions. And it’s brilliant for helping you identify opportunities to improve your customer experience by highlighting aspects within specific sessions that are causing friction.
Main features
Here are the key features in FullStory that help with customer analytics:
- Defined events: You can report on trends and behaviors observed in Session Replays by selecting and naming specific elements of interest in Inspect Mode. When building segments, you can also create events which helps streamline the process of segmenting users based on specific event criteria.
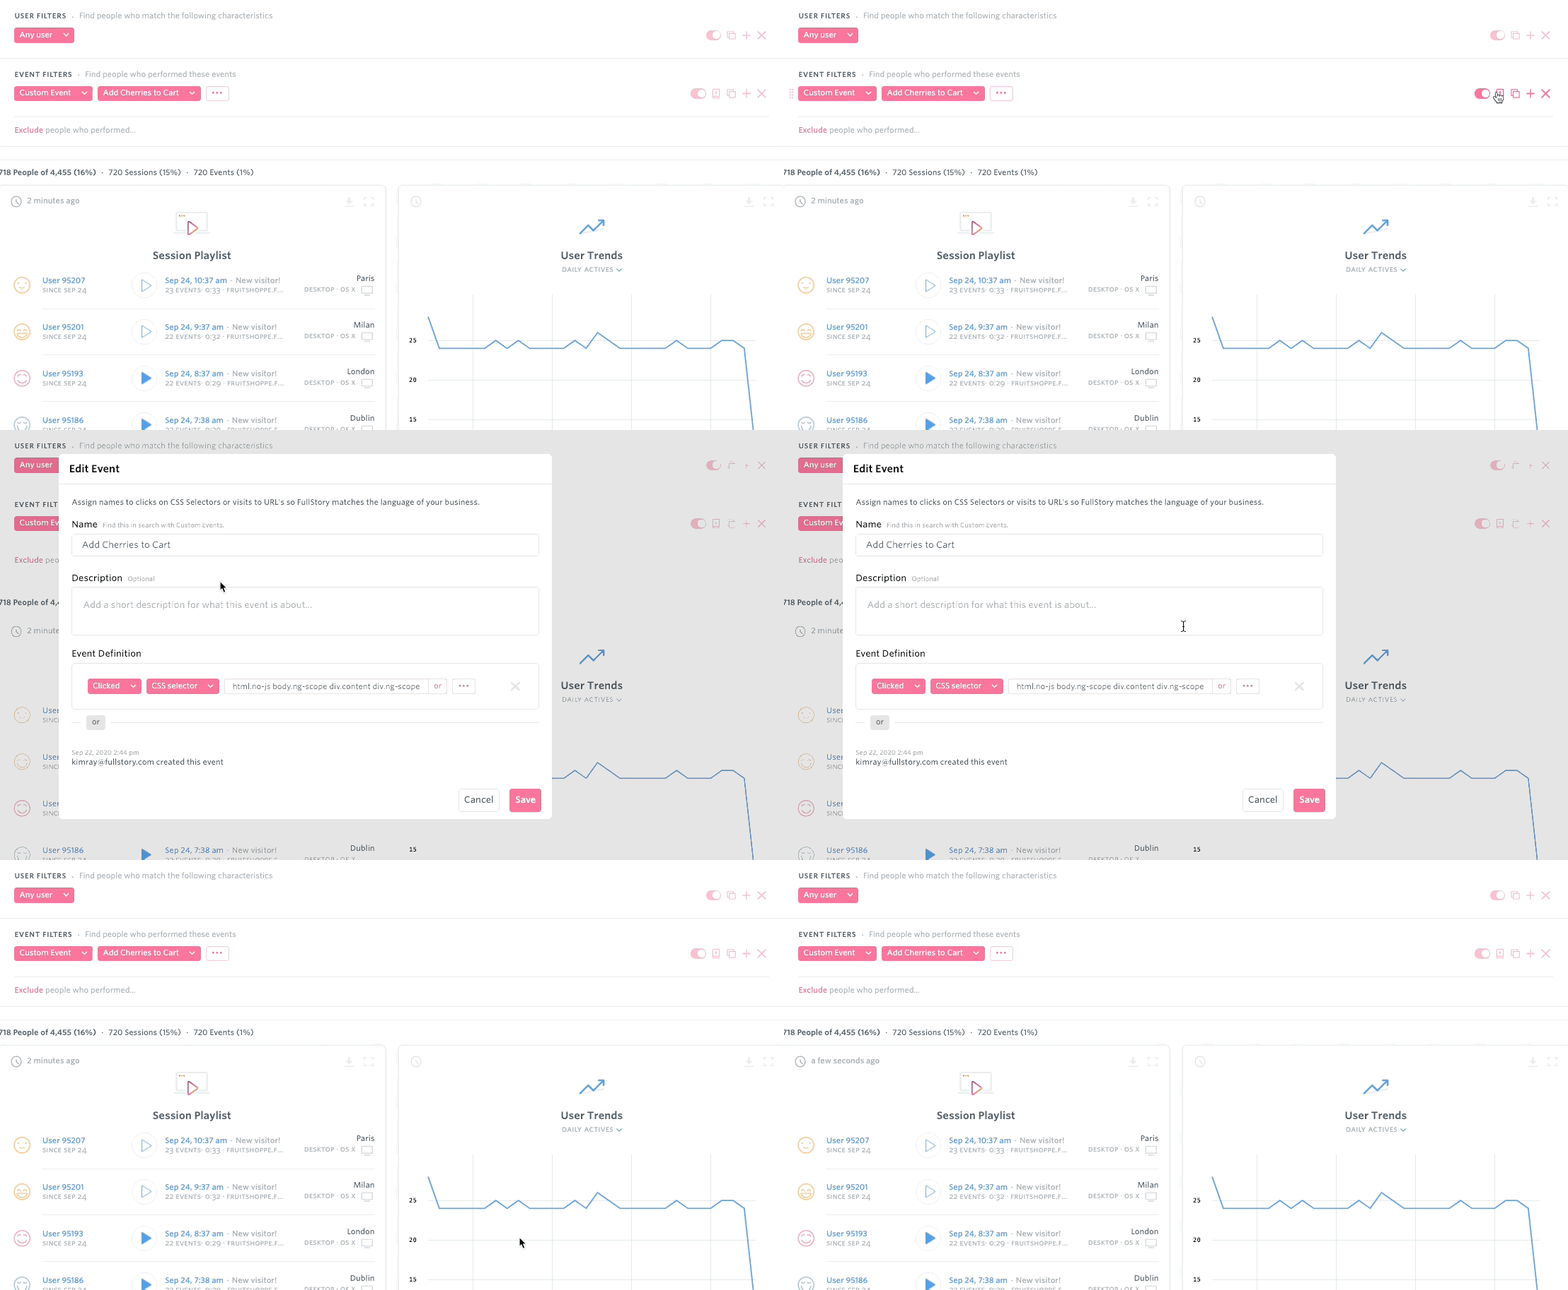
- Funnels: It allows you to track and analyze user behavior for specific goals by defining the steps they should take. You can see how many users complete each step, where drop-offs occur, and why.
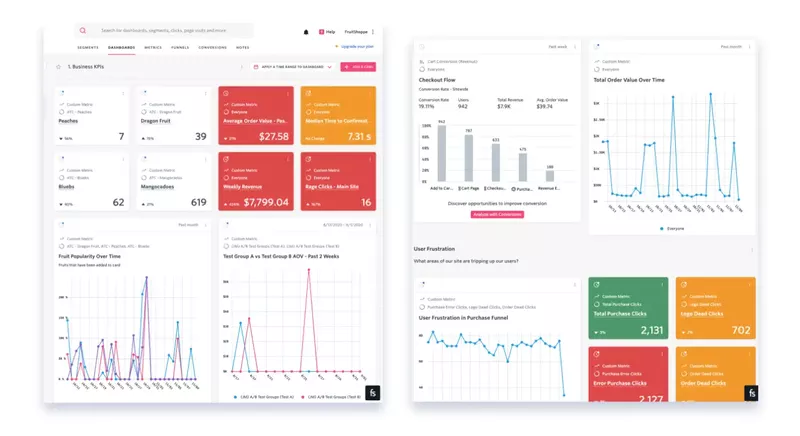
- In FullStory, Metrics are fundamental components used to create Analytics dashboards. They include an event, aggregation type, and data format for tracking specific information.
- In FullStory, Dashboards are customized visual displays that bring together Metrics, Funnels, and Defined Events to provide a comprehensive view of key customer data points.
Pricing
FullStory offers a pricing structure that caters to enterprise users but does not provide transparent pricing on its website. It offers a 14-day free trial and its paid plans – Business and Enterprise – are negotiable.
Hotjar
Hotjar is another robust customer and website analytics tool that comes with a brilliant heatmapping feature and can be a great option for implicit in-app feedback.
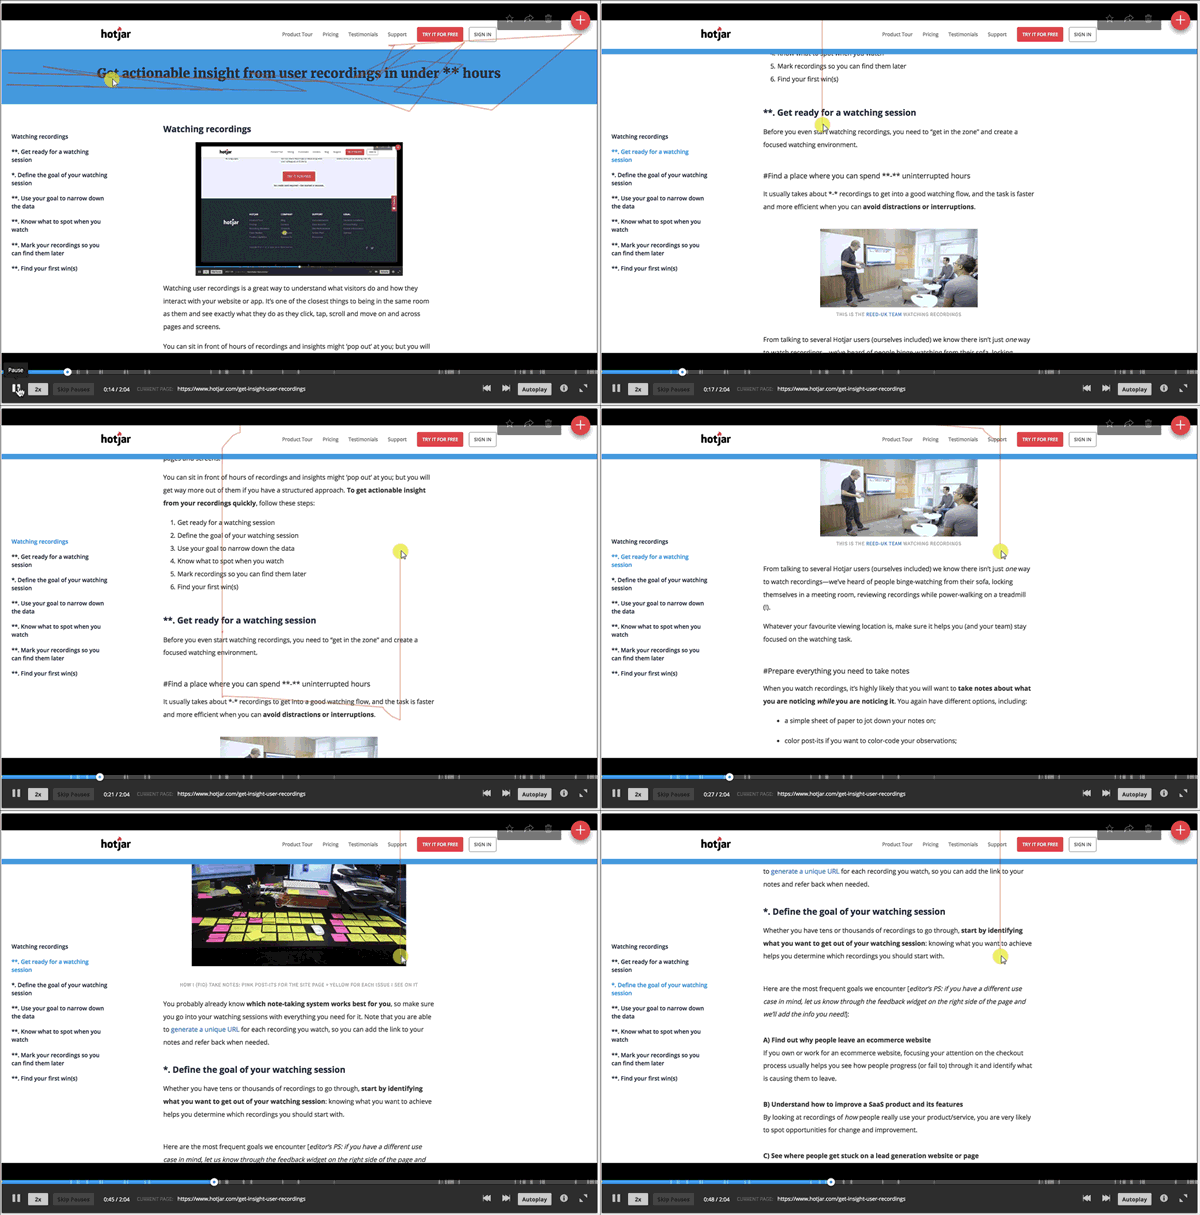
As one of the popular web analytics tools, it allows you to record the browser actions of your customers while they are on your website. This includes clicks, scrolls, and mouse movements.
Main features
For customer analytics, here’s what Hotjar has to offer:
- Hotjar’s heatmaps allow businesses to visualize how their website visitors interact with their website by tracking mouse movements, clicks, and scrolls, and displaying the data in a visual format.
- The Recordings feature captures website sessions, including mouse movements, clicks, and scrolls, providing you with a detailed view of how users interact with your site.
- Surveys: This feature allows you to gather feedback from website visitors through custom surveys. You can target specific visitor segments to deliver your surveys based on their behavior.
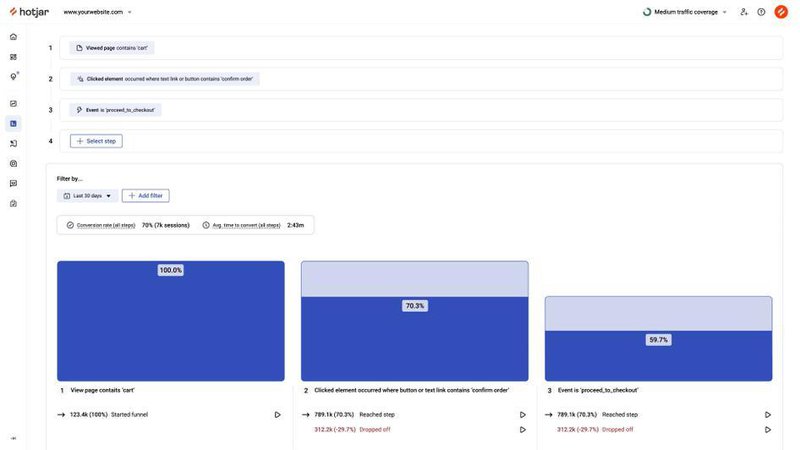
- With the Funnels feature, you can track user journeys towards specific goals, such as completing a purchase or filling out a form.
- Hotjar’s Forms feature tracks customer interactions with online forms, including completion time, skipped fields, and errors.
Pricing
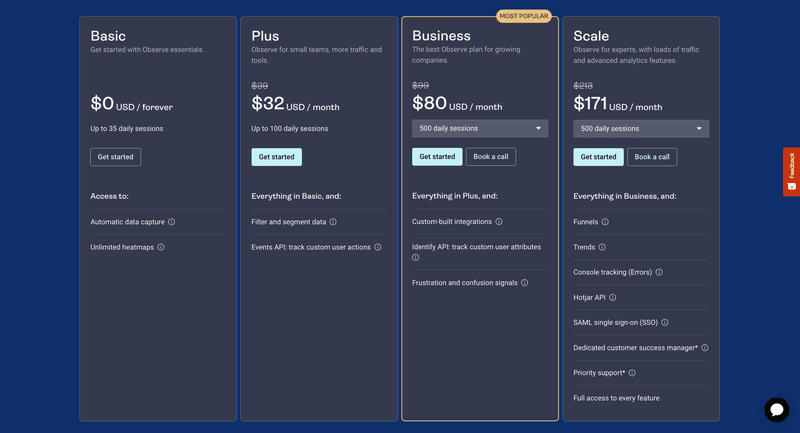
Hotjar offers a range of plans under different categories (Hotjar Observe, Hotjar Ask, Hotjar Engage), as well as custom packages, providing flexibility for users to find a plan that suits their requirements. In general, Hotjar has 3 different plans as follows:
- Plus starts at $39.00 per month.
- Business starts at $99.00 per month.
- Scale starts at $389.00 per month.
It also comes with a Free Forever Plan with limited features. Apart from that, if you only want survey features, you can try it out with a 30-day free trial offer for businesses.
Baremetrics
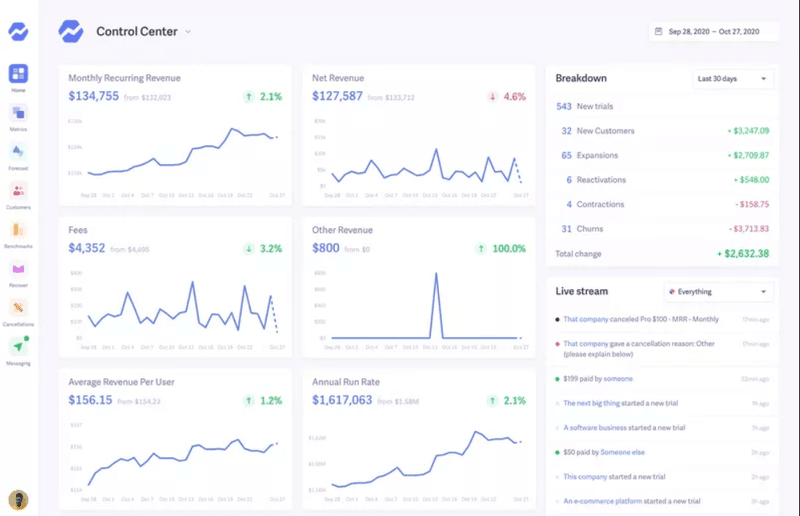
Baremetrics is a subscription analytics and insights management platform that helps businesses get hundreds of valuable metrics and insights, achieving real-time growth.
This software is the easiest way to get the insights you need to understand your performance and where to focus next.
Main features
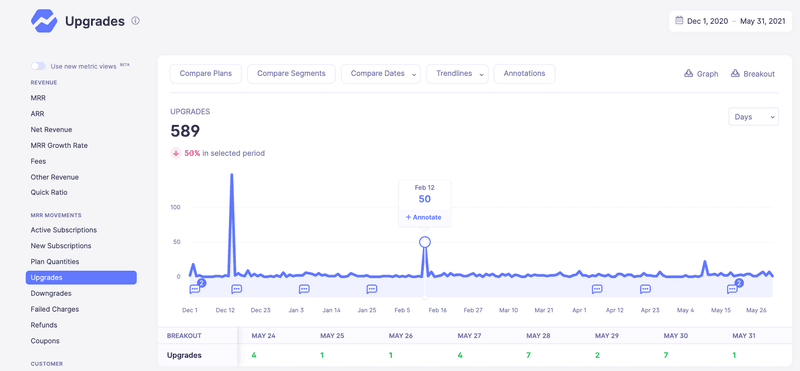
Baremetrics primarily focuses on subscription analytics, but it does offer some user behavior analytics features that can be helpful:
- User segmentation: With Baremetric’s new segmentation, you can create and save groupings of all your customers in seconds. Baremetrics allows you to segment your user base based on various criteria such as subscription plans, location, signup date, etc. This segmentation helps you understand different user groups and their behaviors.
- User churn analysis: When you are tracking user cancellations and the reasons behind them, Baremetrics helps you identify patterns in user churn. This information can be used to improve your product or service and address pain points that lead to cancellations.
- Trial insights feature: You can Improve your conversion rates by monitoring exactly what’s going on while your customers are on trial. With trial insights, you will keep track of conversion rate, average trial length, active trials, and new trials with up-to-the-minute data.
Pricing
Baremetrics has 4 different plans for SaaS companies looking to scale their subscription-based business model. These plans range from a core suite of metrics to many modules that can supercharge your SaaS growth, reduce churn, recover failed charges, and plan for the future.
Here’s a brief overview of the features of each plan and their price tags:
Note: Each pricing plan value depends on your current MRR. So, we are using the $0K value as a benchmark to review the different plans.

- Metrics plan: $108/mo. Features include—smart dashboards, benchmarks, export data, data enrichment, etc.
- Recover plan: $58/mo. The pros of this plan include—Automated Email reminders to delinquent users, recovery of more than your entire Baremetrics cost or next month is on them, and more.
- Cancellation insights plan: $108/mo. Features include customizing your reasons for cancellation, recovering more than your entire Baremetrics cost, personalized email questionnaires, etc.
- Forecast+ plan: With this plan, you can see intelligent MRR projections with configurable options. It is included with metrics.
GainsightPX
GainsightPX is a powerful product experience platform that helps you gather insights into how users interact with your software or app.
The tool provides advanced enterprise-grade product analytics, native omnichannel engagement features to drive customer engagement, and closed-loop feedback with surveys to gauge your user experience. From NPS surveys to real-time data, GainsightPX has it all.
Main feature
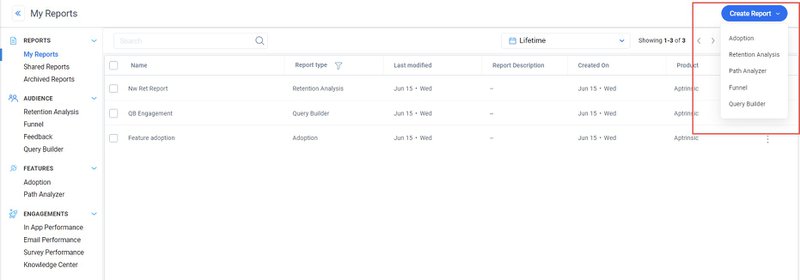
Its user behavior analytics systems come in handy include:
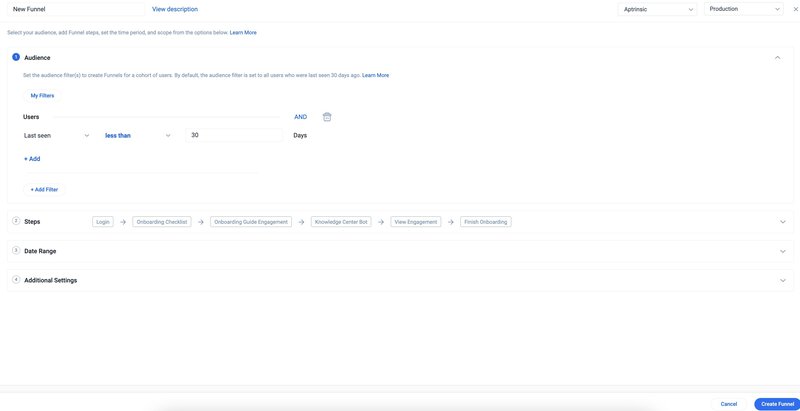
- You can use the Funnel analysis option in Analytics to understand how completion rates have changed over time. All you have to do is edit the funnel and select the right date range. It’ll help you understand whether recent feature releases, product updates, or marketing efforts are headed in the right direction.
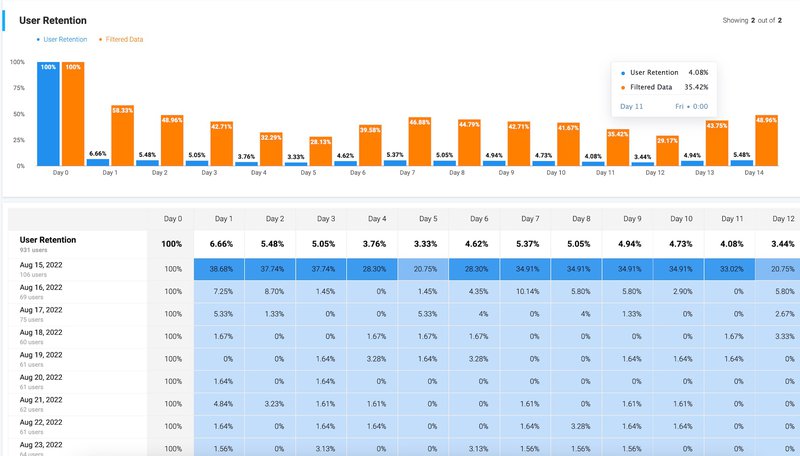
- You can also use the Retention Analysis feature to understand what percentage of users keeps coming back to your product. A steady increase in retention rates is a strong indicator of product growth.
- Similarly, you can use the Adoption feature to understand how your user base responds to different product features. This comes in handy for understanding whether a feature has succeeded in driving stickiness.
- You can even use GainsightPX to run NPS and CES surveys for in-depth insight into user sentiment. Monitor the survey performance and responses in Analytics to identify areas of improvement in your product.
Pricing
Pricing details for GainsightPX aren’t readily available. Instead, you have to request them by filling out a form.
The final pricing of the platform will depend on your requirements. That said, you can get a 30-day free trial of the platform with ease. You could also request a free demo of the platform.
Conclusion
As you might have realized by now, you have lots of options to choose from when it comes to tracking user behavior and generating relevant insights.
The best way to approach this is by combining tools that use quantitative and qualitative methods. As most of these tools offer free plans, you’ll be able to easily test and see what works best for you!
Want more help in creating better user experiences with all that data? Book a demo with Userpilot!
[/vc_column_text][/vc_column][/vc_row][/vc_section]


