
UXCam has been showing up in more and more product conversations lately, and for good reason. As teams look to reduce tool sprawl and get clearer answers from their data, UXCam stands out by bringing together performance monitoring, product analytics, and UX journey insights in a single platform.
This guide breaks down what UXCam is, its key features, and the use cases, to help you determine if this is the right tool for you.
What is UXCam?
In full context, UXCam is a market-leading experience analytics solution built specifically for native mobile apps (iOS, Android, React Native, Flutter).
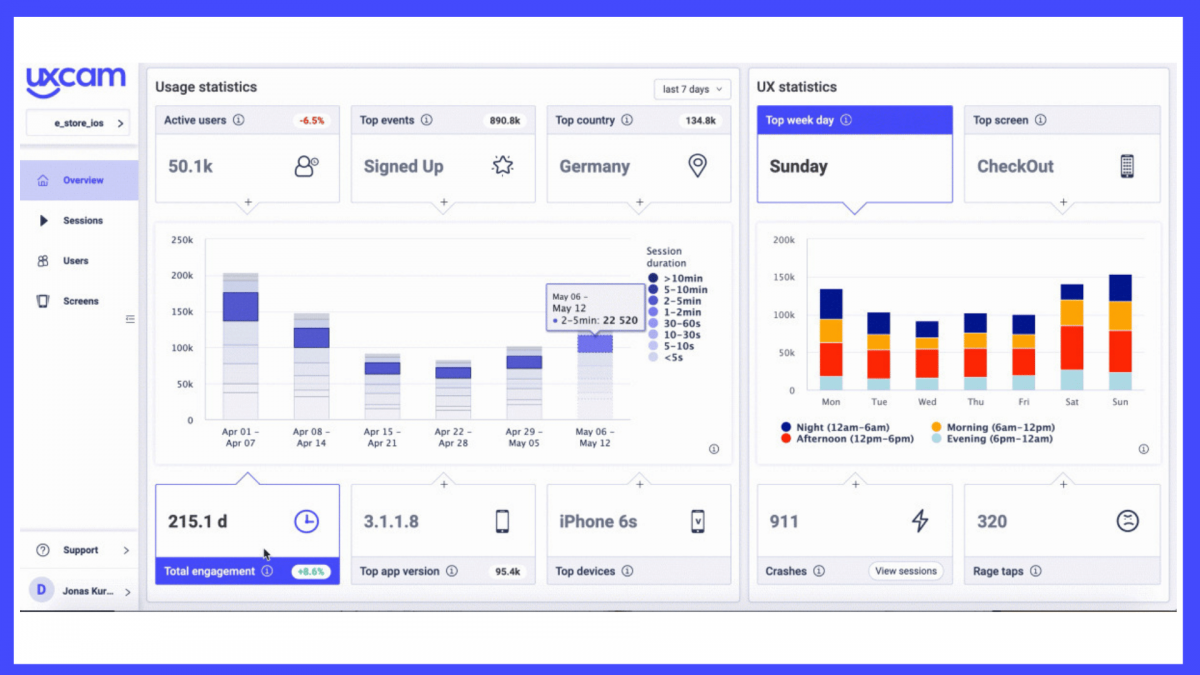
While traditional tools like Google Analytics or Mixpanel focus on counting events (downloads, clicks, screen views), UXCam captures the experience that happens behind those events.
Key UXCam features for user analytics
In the sections below, I’ll give a detailed review of UXCam’s mobile app analytics core capabilities and their application in real-world scenarios.
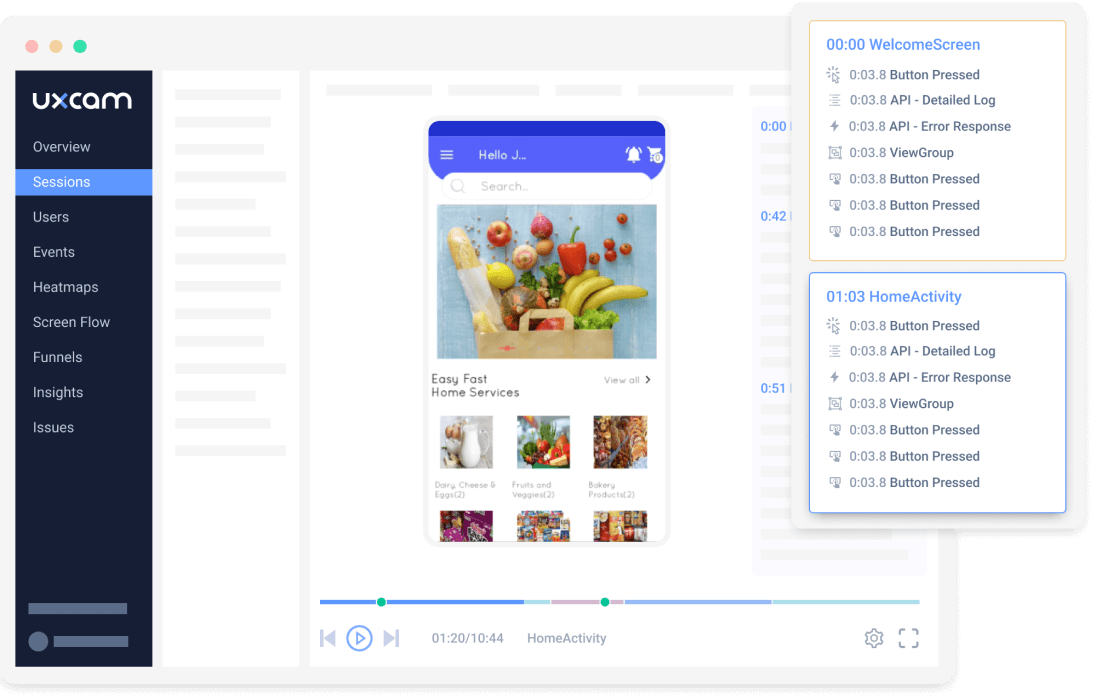
Screen recordings
Session recordings let you see through your users’ eyes. Every interaction, from taps and swipes to navigation paths, is recorded as a video-like replay. Instead of guessing, teams watch real behavior, making it easier to understand true user intent and validate hypotheses.
UXCam also gives you advanced filters (e.g., crashes, rage taps, UI freezes, specific screens, custom events), so you can jump straight to the sessions that matter most and avoid the “looking for a needle in a haystack” experience.
You also get tools for collaboration, like tagging teammates and copyable links.
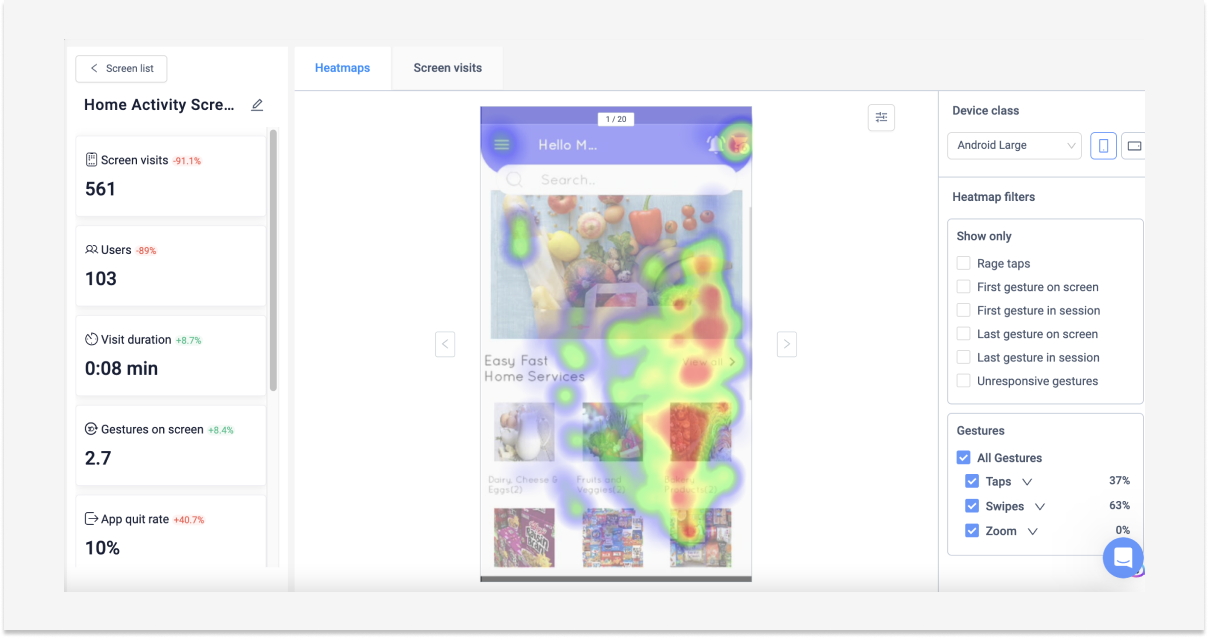
Heatmaps
Heatmaps deliver a visual map of user engagement, showing exactly how users interact with your app.
But unlike basic tap maps, UXCams are gesture-aware: you can see not just taps, but swipes, double-taps, rage taps, unresponsive taps, and other signs of usability issues.
You can segment these heatmaps by device type, operating system, custom events, or user segments, letting you compare how different groups interact with the same UI element.
Automatic event capture
UXCam removes the heavy lifting from analytics setup by automatically tracking key user interactions without requiring manual tagging.
Autocapture empowers product teams to explore retroactively, meaning there is no pressure to anticipate every event you might want to analyze. You can define new analyses after data has already been collected and ask fresh questions of your dataset without re-instrumentation.
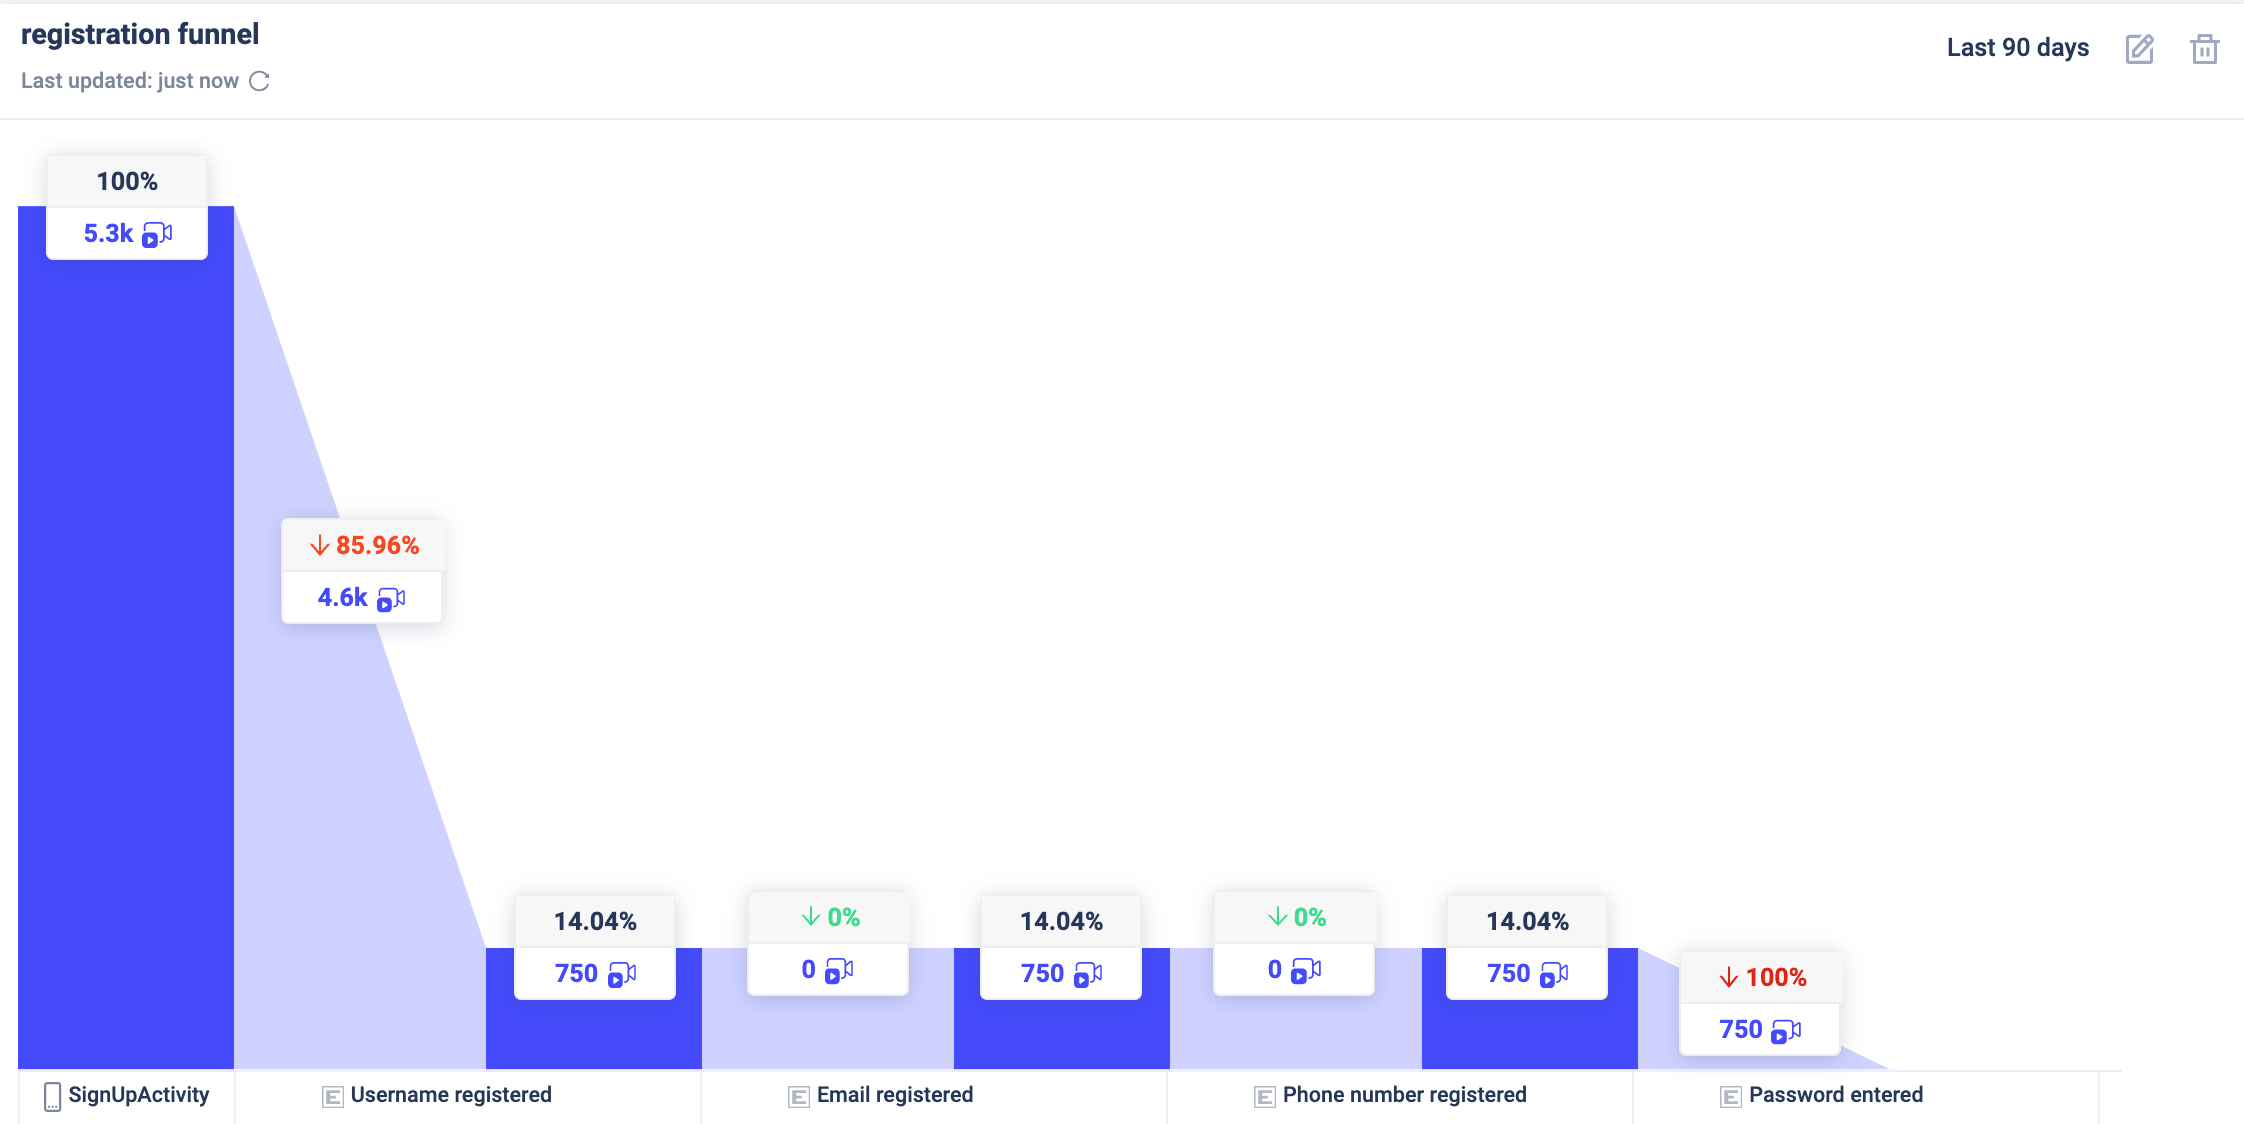
Funnel analytics
UXCam empowers teams to visualize and quantify how users move through critical flows, from onboarding to upsells, measure conversion rates at each step, and pinpoint where users drop off.
Journey analysis in UXCam goes beyond linear funnels. You can map screen flows to see how users move through your app in non-linear paths, identify loops or dead ends, and understand common navigation patterns. This helps product teams optimize navigation logic and screen hierarchy for higher retention and conversion.
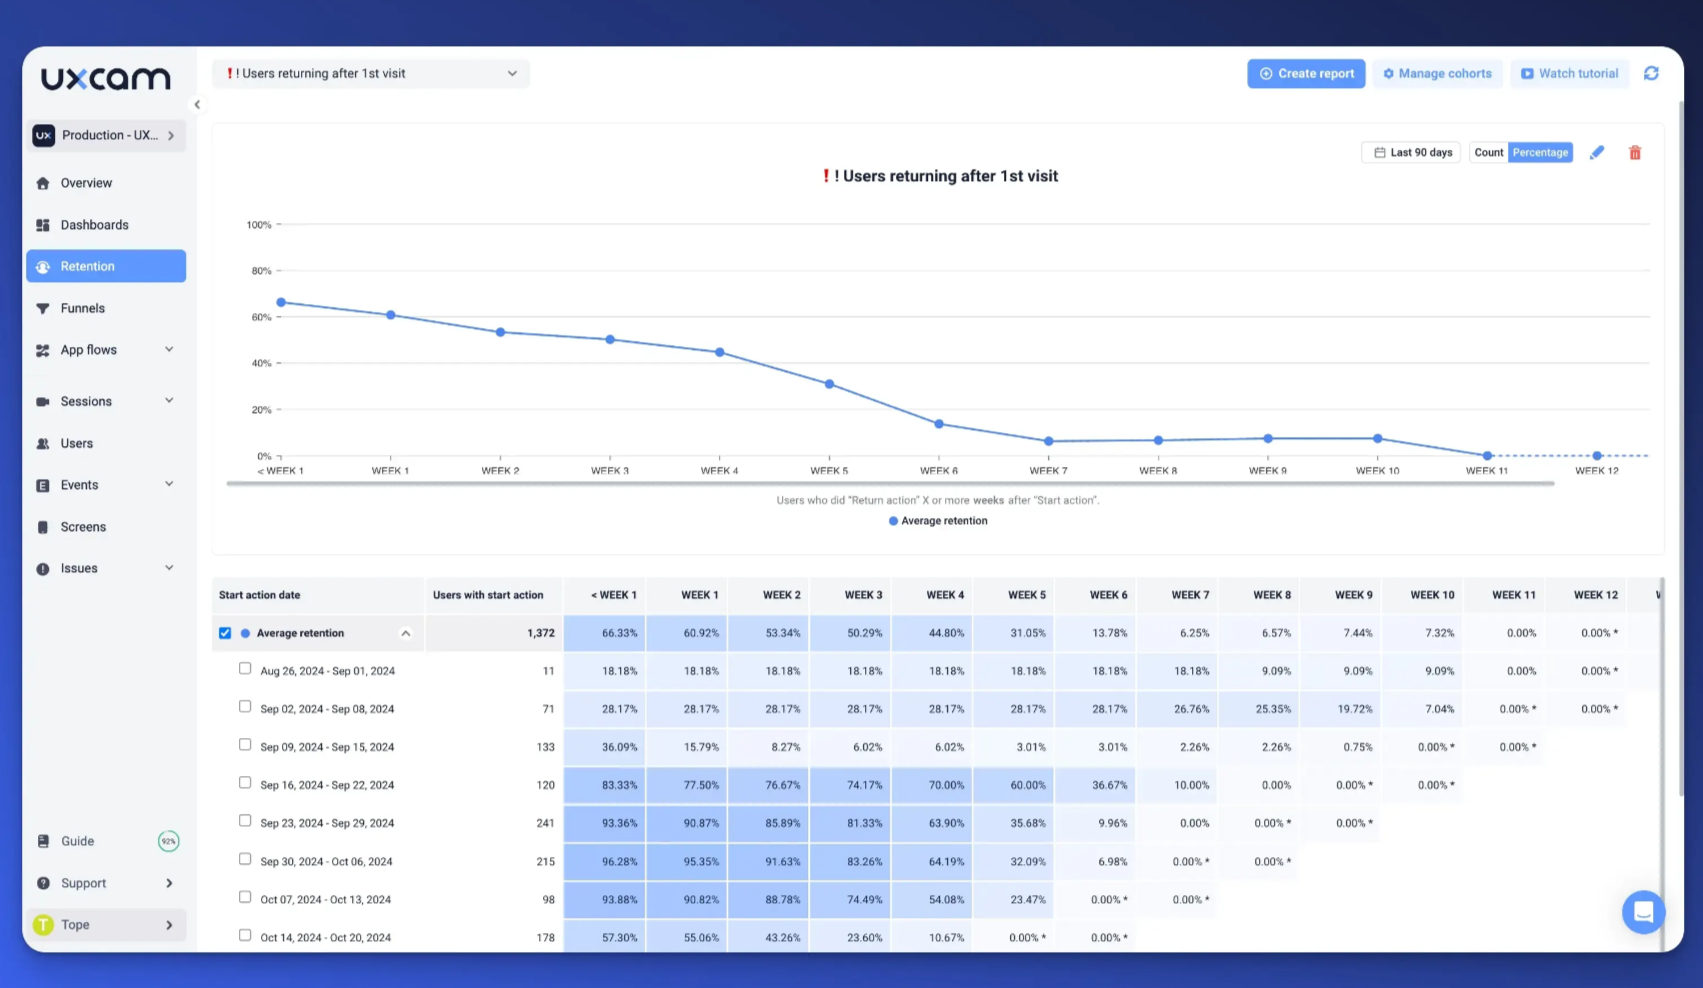
Retention analytics
Retention tables and cohort analysis show you which behaviors drive loyalty. Rather than looking at isolated metrics, this feature groups users who started using your product during the same timeframe (a cohort) and tracks how many of them return or churn across subsequent days, weeks, or months.
This helps you identify which in-app actions correlate with long-term engagement and which user segments are at risk of churning, enabling proactive improvements.
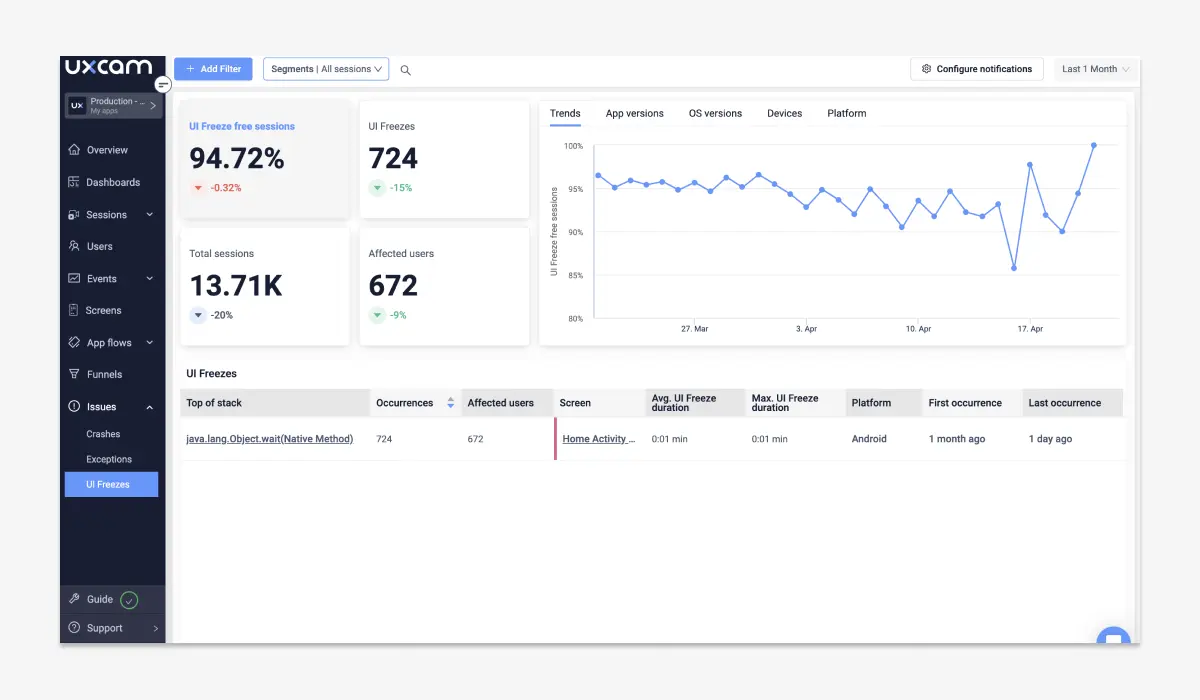
Issue analytics
Issue analytics gives you real-time visibility into technical problems that impact the app experience, such as crashes and UI freezes. Rather than relying on siloed logs, UXCam ties these issues directly to session context so you see the root cause in action.
Issue analytics can be linked to team communication tools (Slack, Teams, etc.) so stakeholders are notified of major regressions or spikes in frustration signals.
How much does UXCam cost?
UXCam pricing is custom; you need to sit through sales calls to get an estimate. According to Vendr, the median annual contract value for UXCam is about $20,991.
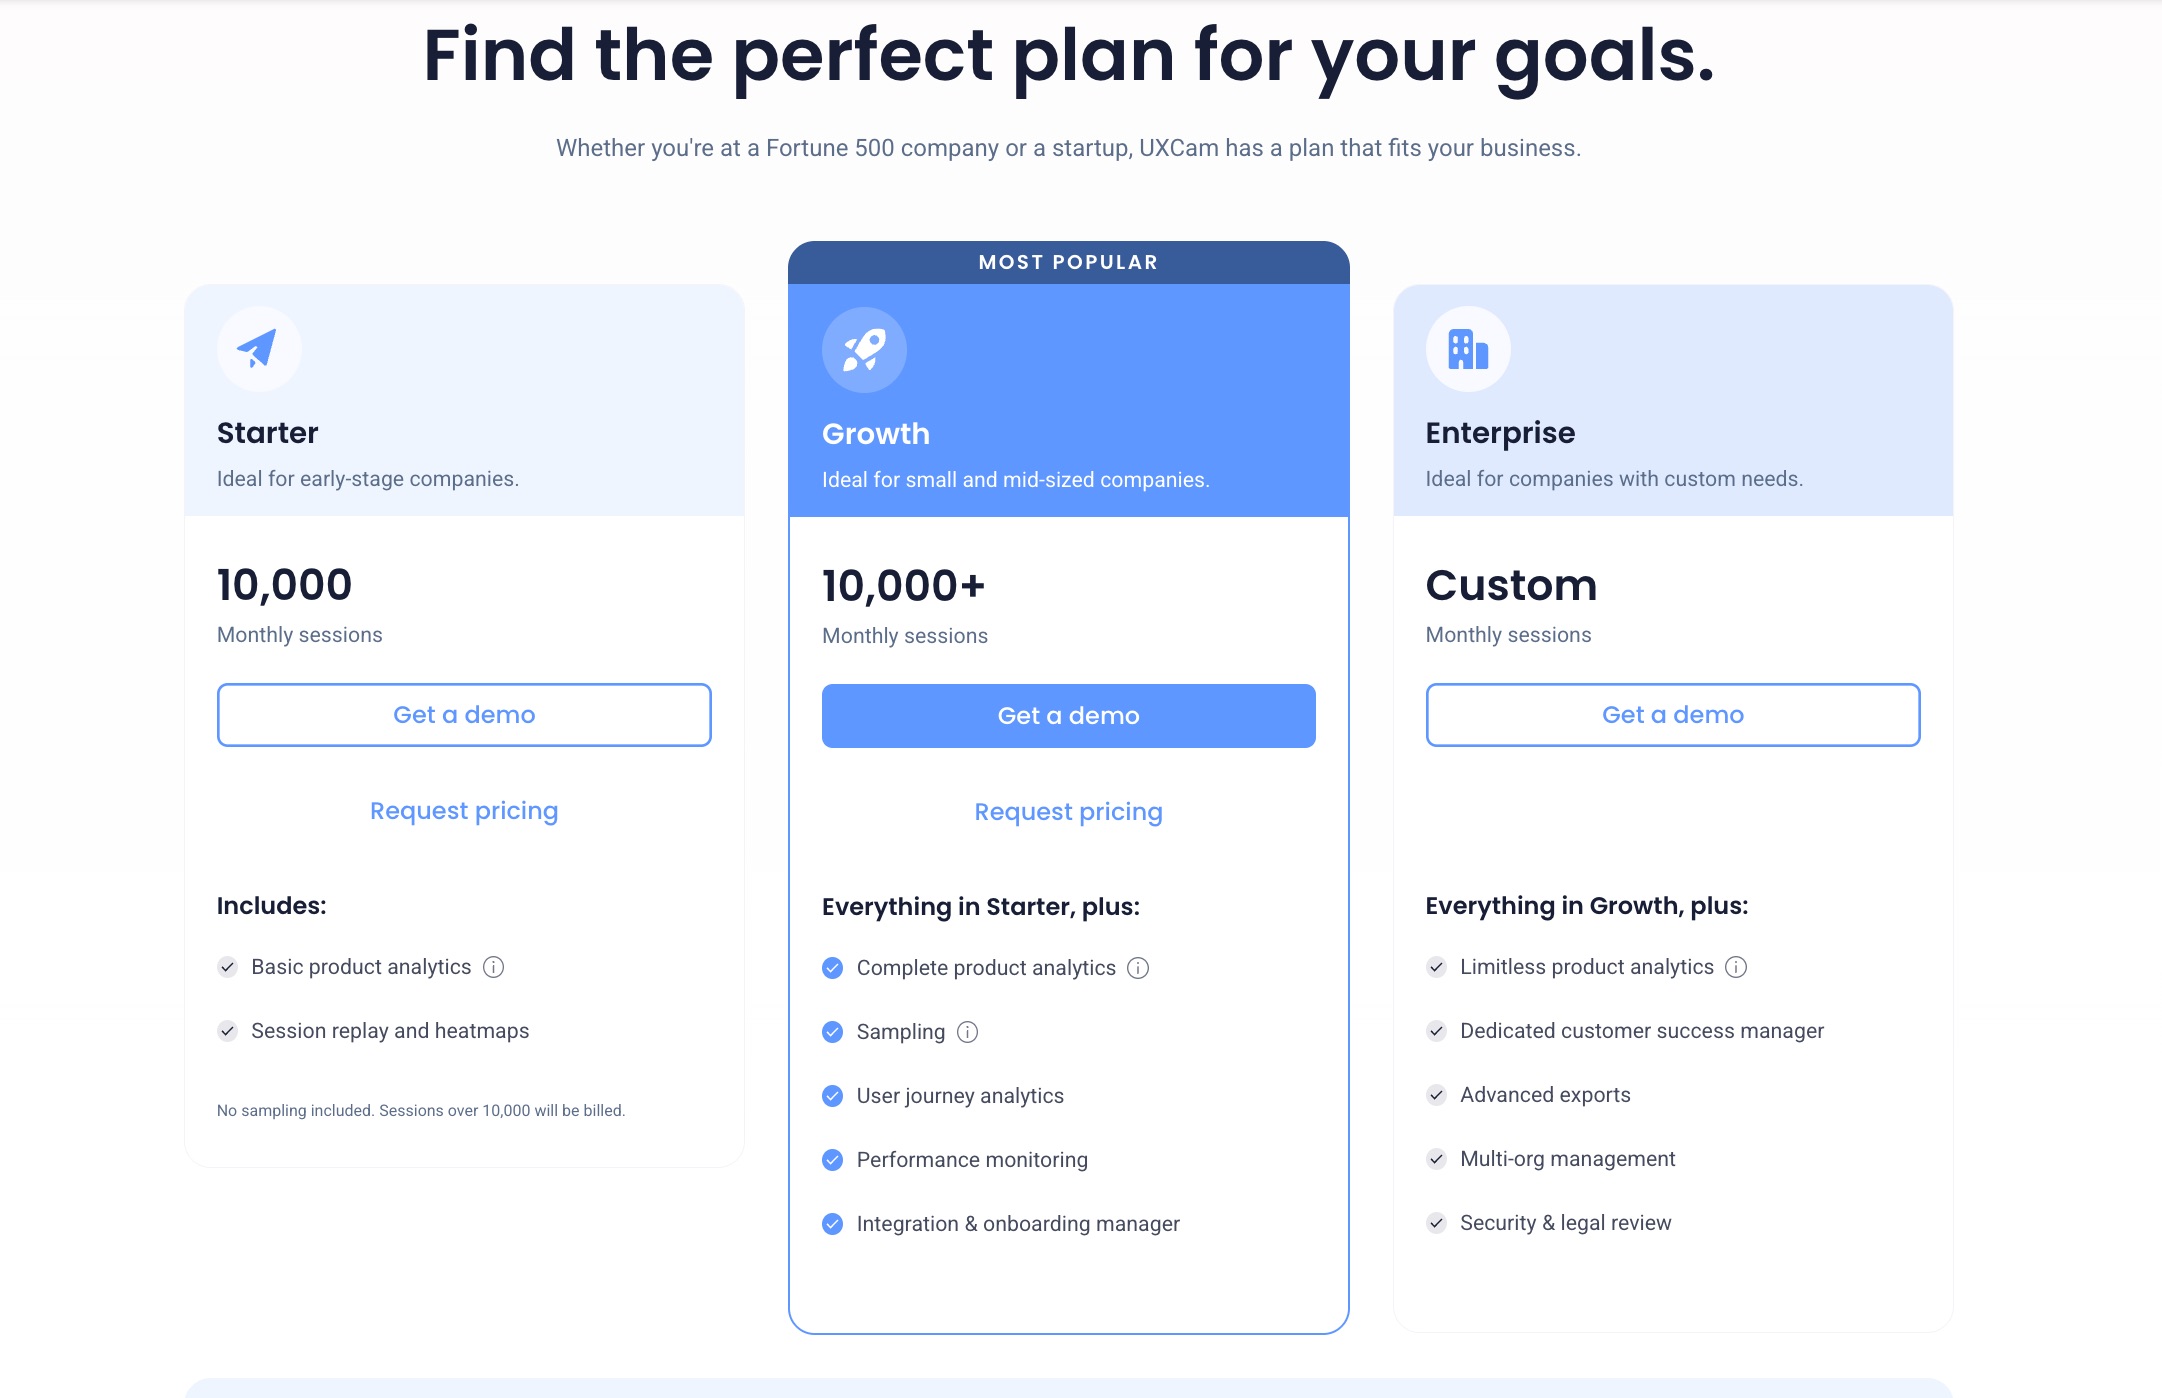
Here’s a quick breakdown of its pricing plans:
- Starter Plan: Up to 10000 sessions. Gives access to 5 user seats across 2 projects. On top of session replays and heatmaps, it includes basic analytics funnels and retention reports.
- Growth Plan: Covers 5 production projects and 10 user seats. Adds technical performance monitoring features (crashes and freezes), user journey analytics, and personalized implementation guidance.
- Enterprise Plan: The top-tier Enterprise plan is fully customized for large organizations and includes everything in Growth plus unlimited or very high session volume, dedicated support, advanced exports, SSO/multi-org management, and enhanced security/legal review options.
Pros and cons of UXCam
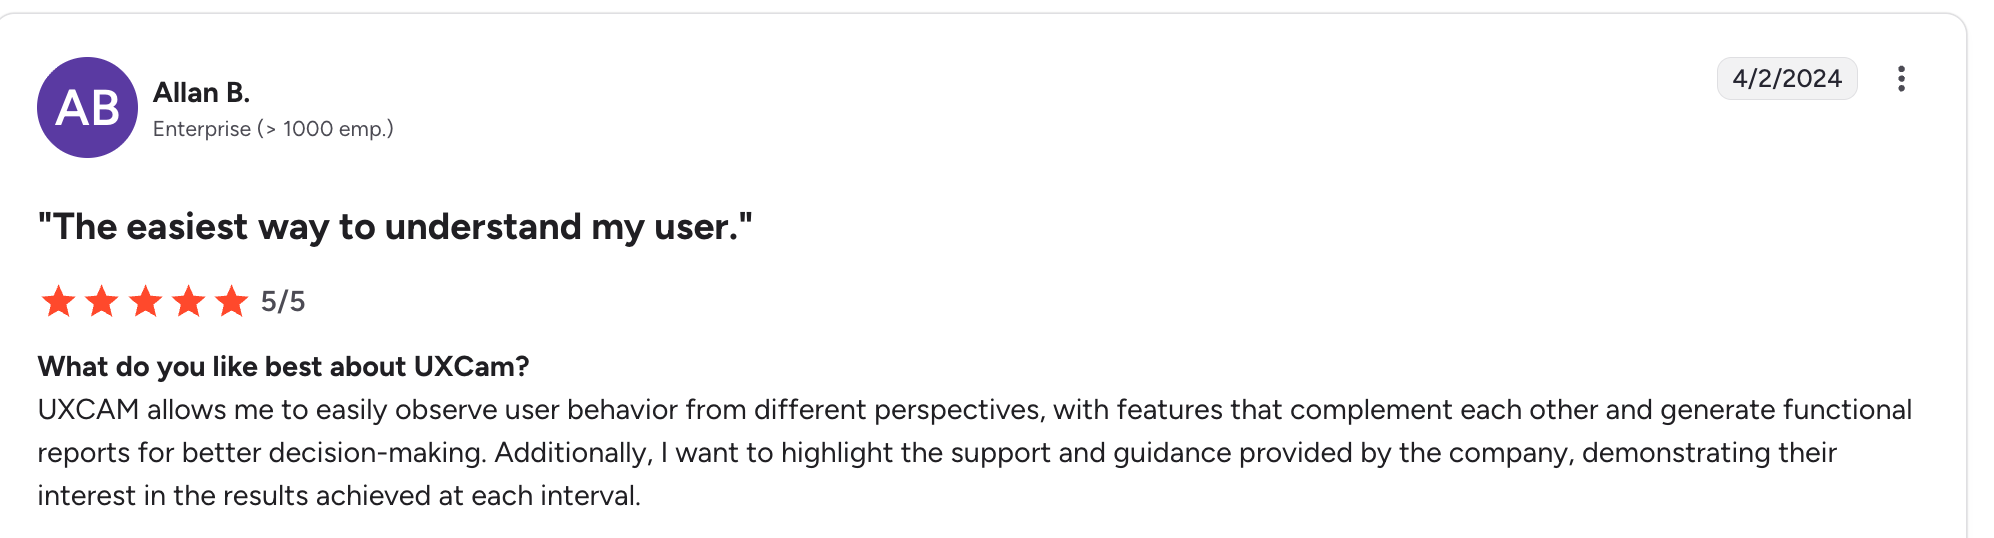
When I evaluate any tool, I don’t just look at features; I consider the whole user journey with the product, from setup to daily use and ongoing support. Here’s what the market says about UXCam, based on customer feedback and aggregated UXCam reviews.
Pros of UXCam
✅ Fast implementation and intuitive dashboard: UXCam is frequently praised for how quickly teams can get up and running, especially on mobile. The SDK installation is relatively lightweight, the documentation is clear, and most teams report being able to see meaningful data within days rather than weeks. Once implemented, the mobile analytics dashboard is straightforward and well-organized, making it easy for non-technical product managers to use it.
✅ Great for debugging UX issues and crashes: Reviewers mention that seeing the exact sequence of interactions leading up to a crash or bug helps engineers diagnose issues faster and reduces back-and-forth between product and engineering teams.
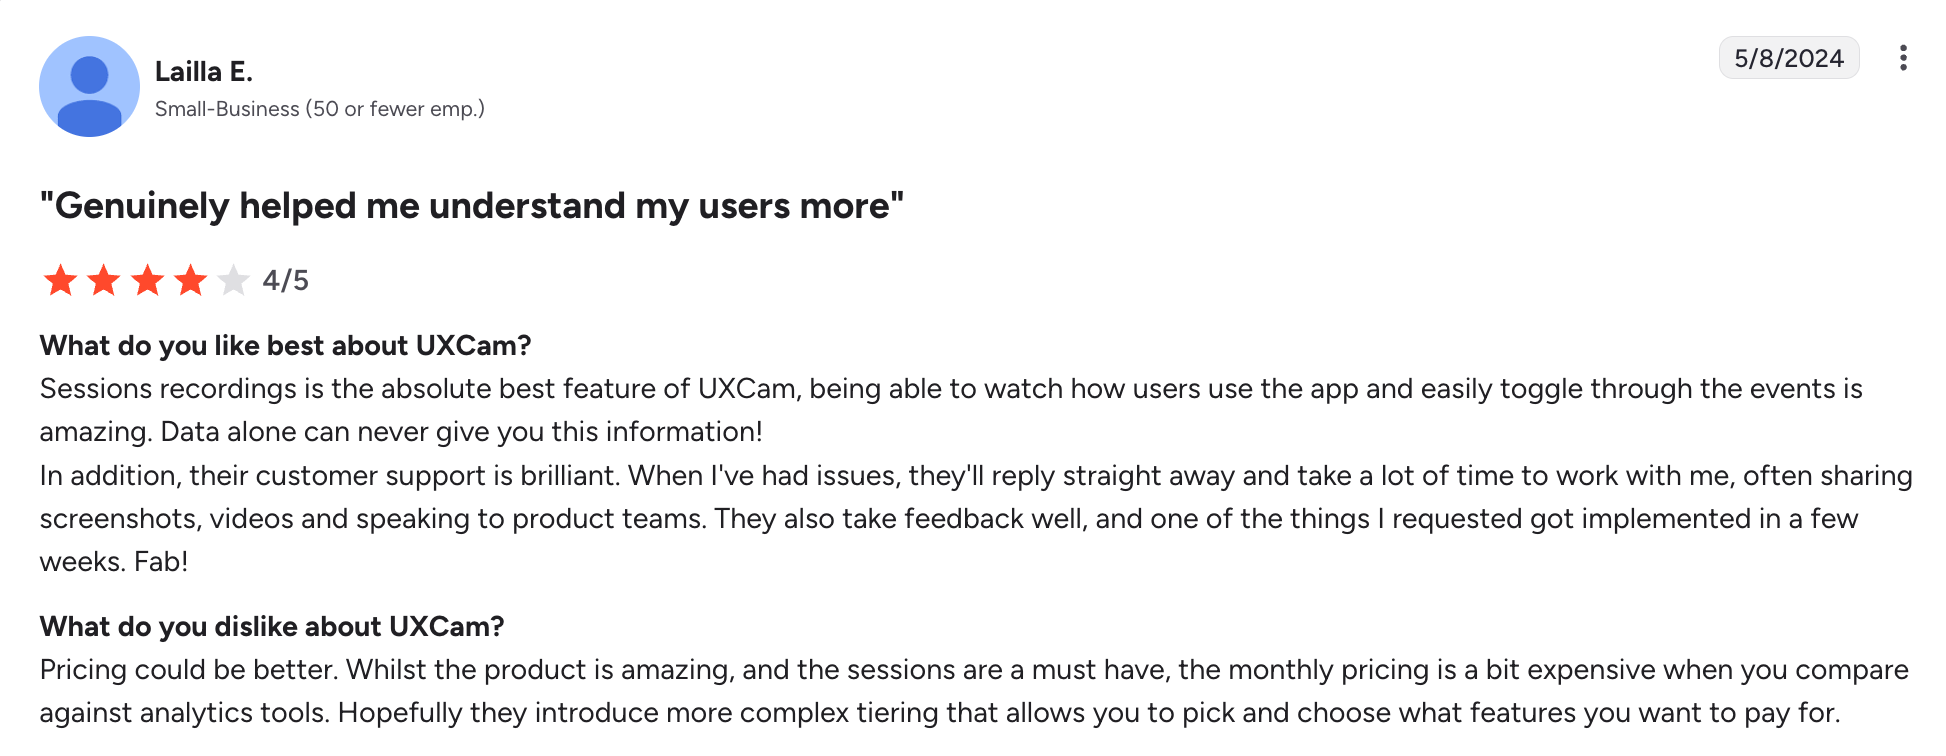
✅ Excellent customer support: Multiple G2 reviewers highlight UXCam’s customer support as responsive, knowledgeable, and genuinely invested in customer success, proactive in identifying potential issues early.
Cons of UXCam
❌ Unpredictable and opaque pricing structure: One of the most common complaints is that UXCam’s pricing is not transparent and can scale unexpectedly as session volume grows. Teams report difficulty forecasting costs and running out of the limit before the end of the month.
❌ Occasional performance issues with longer user sessions: Some G2 users report that session replays and heatmaps can be slow to load, especially for longer sessions or apps with heavy interaction density.
❌ Limited actionability beyond observation: While UXCam helps you see where users struggle, it doesn’t enable you to solve the issue. Even when a drop in the onboarding funnel is obvious, the solution usually requires engineering work, and that update can sit in a backlog for weeks.
Why Userpilot is a better alternative for product-led teams
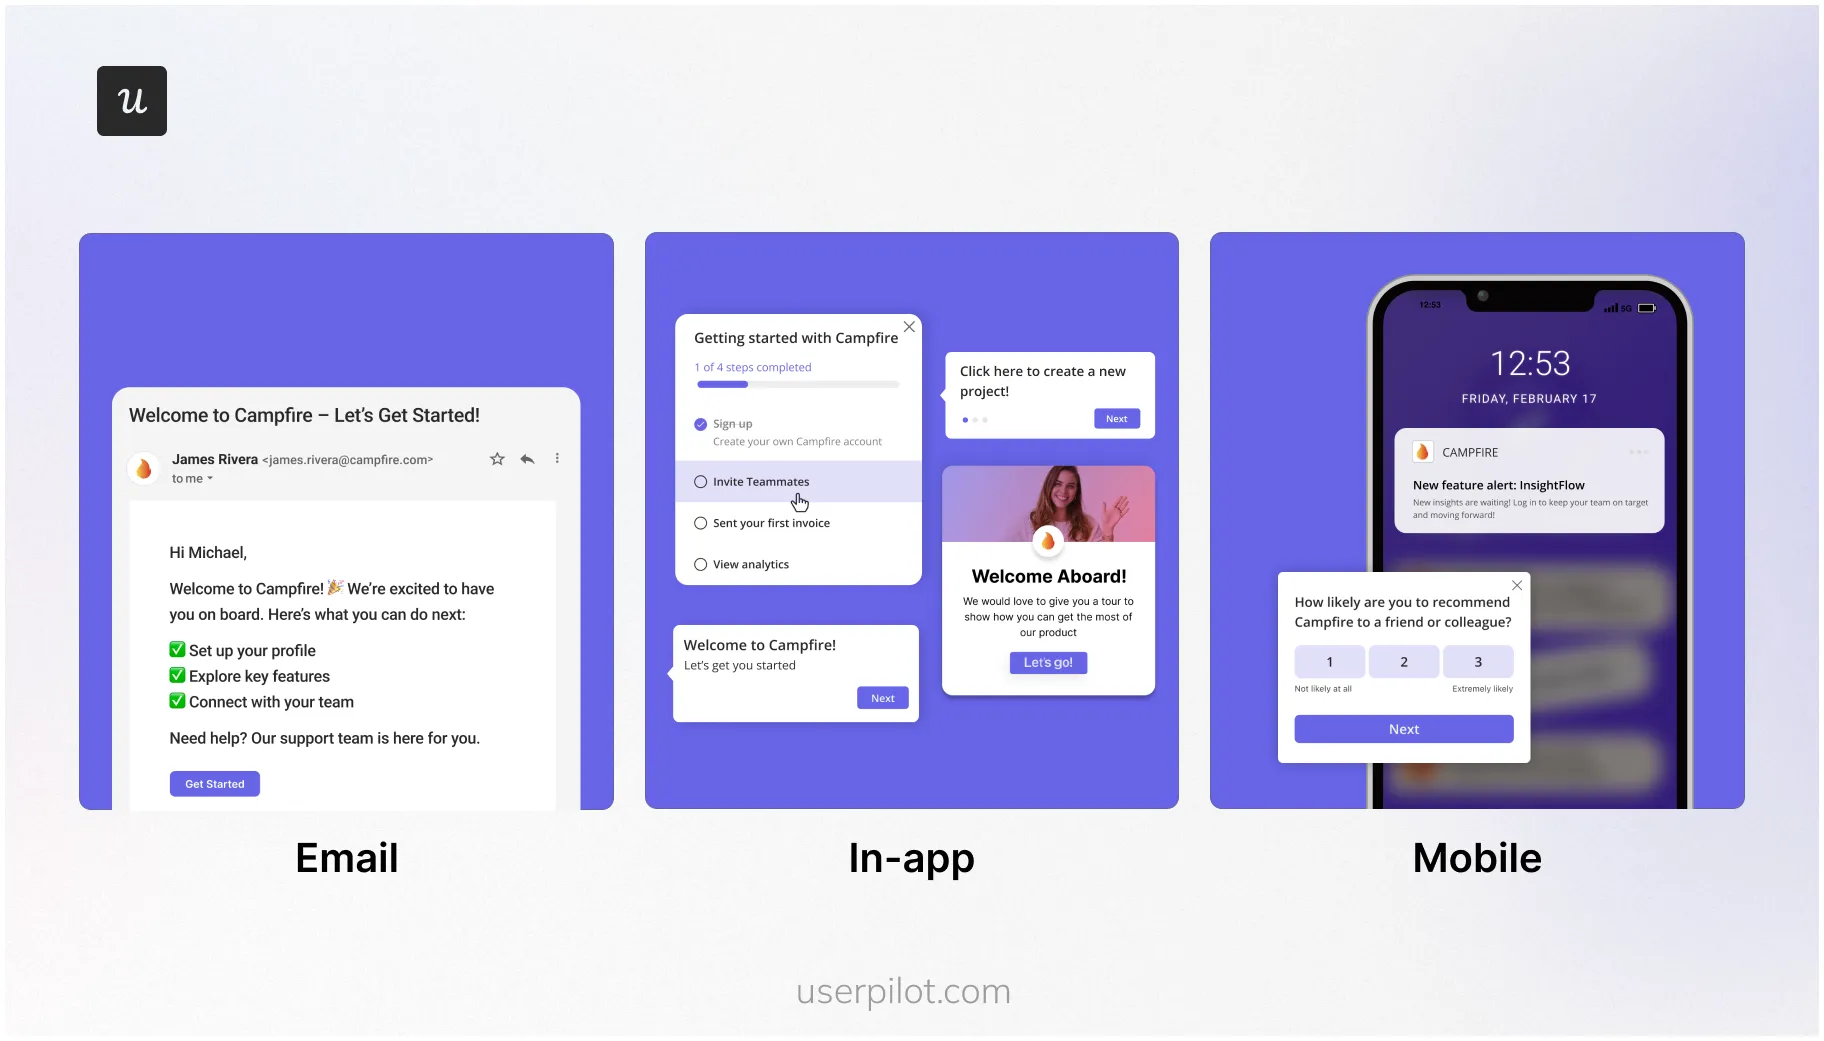
Userpilot combines product analytics with omnichannel engagement tools to directly influence user behavior, not just observe it.
For example, you identify a drop-off point with Userpilot funnel reports. You click through it, watch a session, and see that the user clicks around the feature but can’t figure out how to use it. You can use tooltips, checklists, or product tours to guide users inside the app, remove friction, and boost product usage.
To engage dormant users, you can deploy push notifications and lifecycle emails, all designed from Userpilot’s main dashboard. And the best part is you don’t have to write a single line of code, just use the visual editor.
Ready to see how Userpilot helps you turn insights into growth? Book a demo today.
Userpilot strives to provide accurate information to help businesses determine the best solution for their particular needs. Due to the dynamic nature of the industry, the features offered by Userpilot and others often change over time. The statements made in this article are accurate to the best of Userpilot’s knowledge as of its publication/most recent update on December 27, 2025.
About the author