Amplitude Tracking in 2026: More Powerful, More Expensive, and Harder To Justify for Most SaaS Teams


In February 2026, Amplitude tracking got a major upgrade: a Global Agent that answers complex product questions in plain language, specialized AI workflows, and MCP integrations with Anthropic, OpenAI, Figma, and Notion. For a digital analytics platform, it’s the most capable version of the tool yet.
Amplitude’s original value was event-based behavioral analytics that let product teams track user engagement across the entire customer journey, in ways GA4 never could, with funnels, retention curves, cohort analysis, and user paths all built in. That was enough for a long time. Now, the offer is much larger, and so is the commitment the platform asks you to make.
Most SaaS teams are moving in the opposite direction right now. ProductPlan’s 2025 State of Product Management report documents a strong industry push toward tool consolidation, fewer platforms, and lower licensing costs. Bringing in a platform with a developer-dependent setup and a contract structure capable of reaching six figures runs counter to that trend.
In this article, I cover what Amplitude actually tracks, how the implementation works, what changed with the platform’s recent AI expansion, and what it costs beyond the pricing page.
What Amplitude tracks
Everything in Amplitude is an event, i.e., a timestamped record of how users interact with your product, paired with properties that describe the context. A button click, a page view, a feature interaction, a form submission, an ad engagement. The platform’s entire analytical layer is built on top of this event stream.
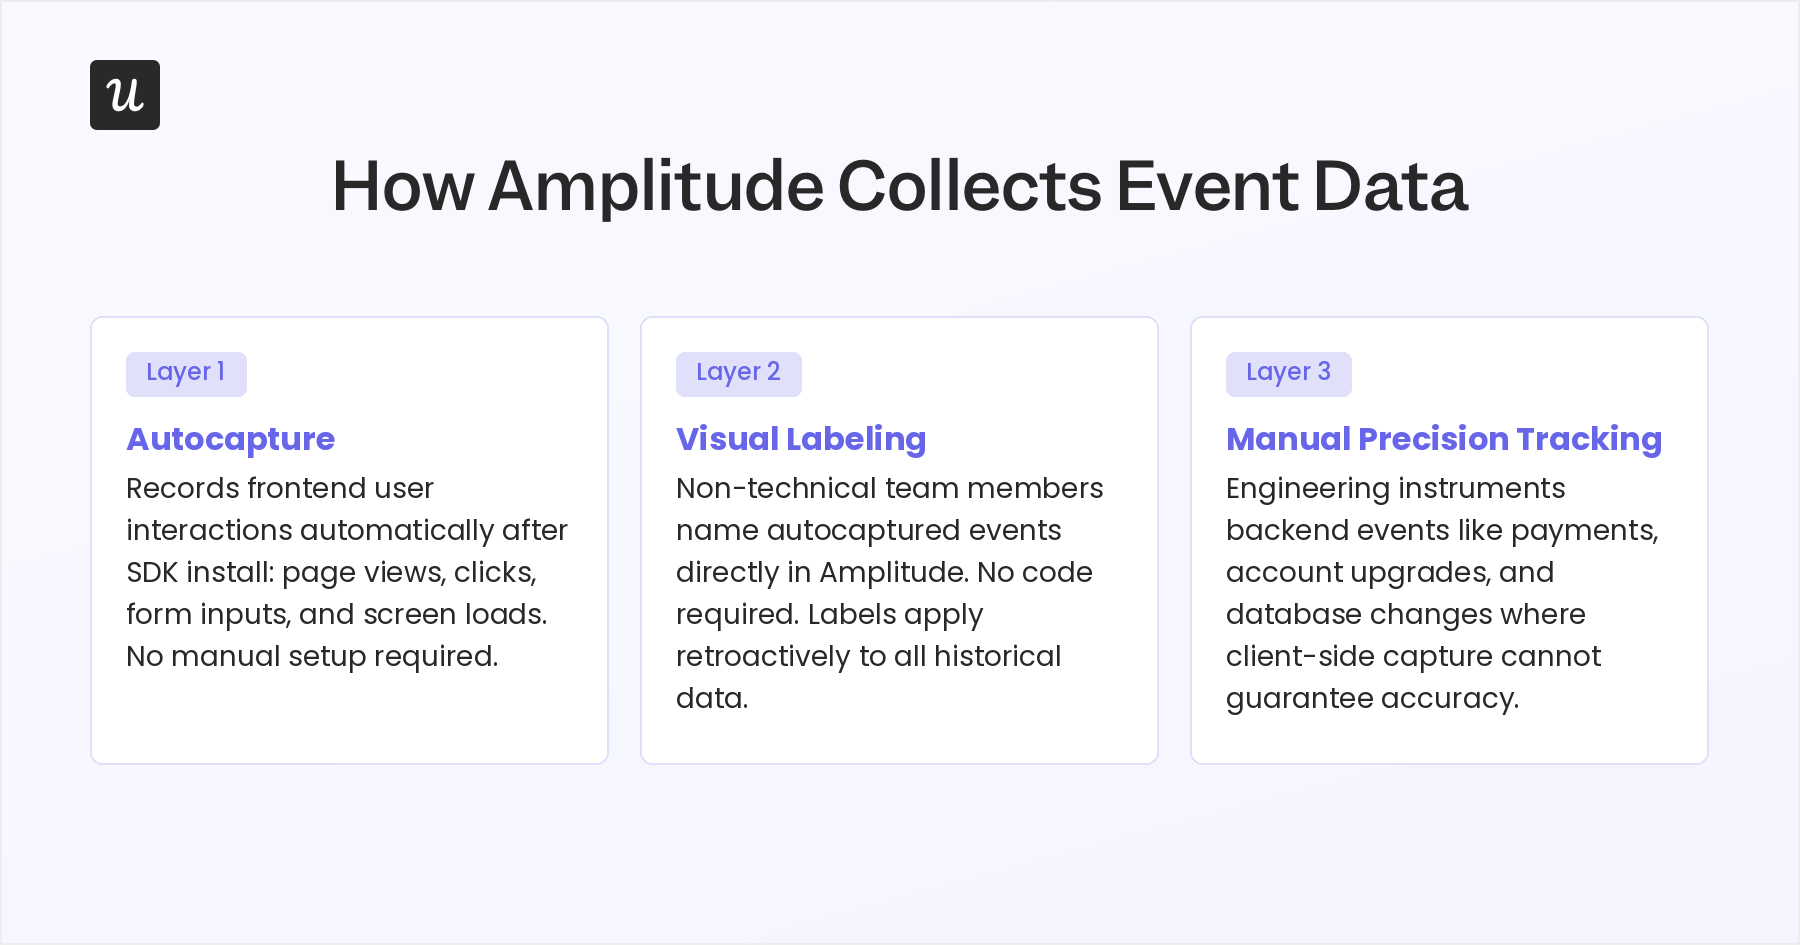
Autocapture collects the bulk of that data automatically. Install the SDK, and the platform starts recording user interactions on the frontend web and mobile: page views, clicks, form interactions, and screen loads. Autocapture does not reach server-side events, payment processing, database changes, or any backend business logic, and that gap catches teams off guard once they are mid-instrumentation.
Custom events add a layer of flexibility for teams that need to track user events in aggregate rather than individually. You combine specific events through OR logic, so Amplitude treats either one as a valid conversion step, like “play_song OR search_song” grouped as a single funnel step. Any user who triggers either event counts as converted.
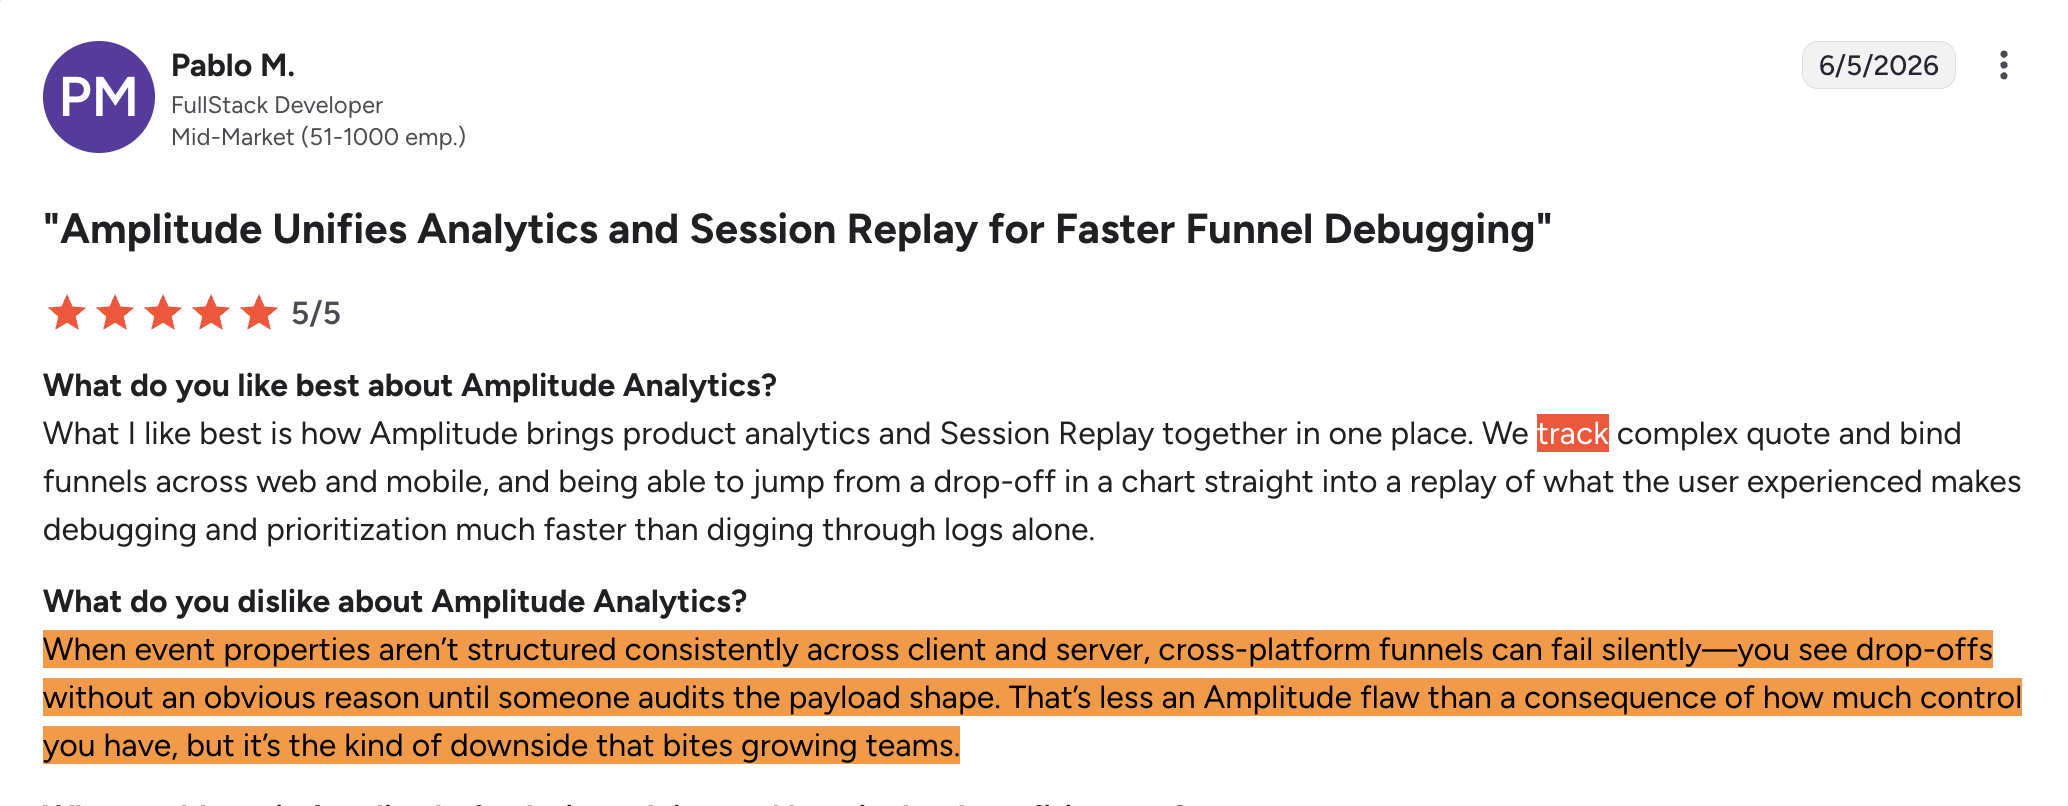
It’s best to understand the frontend/backend event split before you start anything. User clicks and page views fire from the frontend SDK, fast to set up but vulnerable to ad blockers, browser restrictions, and client-side failures. Critical business milestones such as payment completions, account upgrades, and subscription changes must be triggered server-side. For example, a client-side event can be dropped, while a server-side event cannot.
How Amplitude event tracking works
![]()
Step 1: Build your tracking plan before you touch the SDK
The most expensive mistake teams make with Amplitude is skipping the tracking plan. This approach typically results in planning failures like inconsistent event names, broken user ID stitching across web and mobile, duplicate profiles, and misfired properties that make funnels unreadable.
Best-practice taxonomy uses past-tense verbs for event names (completed_onboarding, started_checkout) and descriptive nouns for properties (plan_type, device, user_role). Some teams treat this as a data governance problem, routing all events through a CDP like Segment or RudderStack, which serves as a schema validator that automatically rejects events that deviate from the approved plan. It adds tooling overhead, but it stops data drift before it starts.
Step 2: Choose how you collect data
Amplitude offers three data collection paths:
- SDKs for JavaScript, Android, iOS, React Native, Python, and TypeScript: developer-installed, after which autocapture runs automatically. Visual labeling then lets non-technical team members assign meaningful names to auto-captured interactions directly in the Amplitude interface, with no code required and retroactive application to historical data.
- Precision tracking for events autocapture misses: manually defined with specific properties, instrumented by engineering for anything server-side or custom to the application.
- Third-party integrations with platforms like Google Ads, Google Tag Manager, and Hotjar, most of which connect without any coding.
Step 3: Analyze what you collect
Once data is flowing cleanly, Amplitude’s analysis layer is genuinely strong. The core chart types cover most of what product teams need:
- Event segmentation: Tracks how users engage with key metrics over time, with filters and breakdowns by user property or cohort, to help teams identify trends.
- Funnel analysis: Measures conversion across a defined sequence of steps, with attribution by user segment.
- Retention analysis: Shows how cohorts behave over weeks and months after a defined starting event.
- User paths: Map how users navigate the product before or after a target action.
- Session replay: Adds qualitative context so you can spot friction points and understand what users were doing when a metric dropped.
- Custom dashboards: Build charts that combine multiple metrics into a single view for the whole team.
The quality of insight at this stage scales directly with how clean the Step 1 taxonomy was.
Where it breaks down
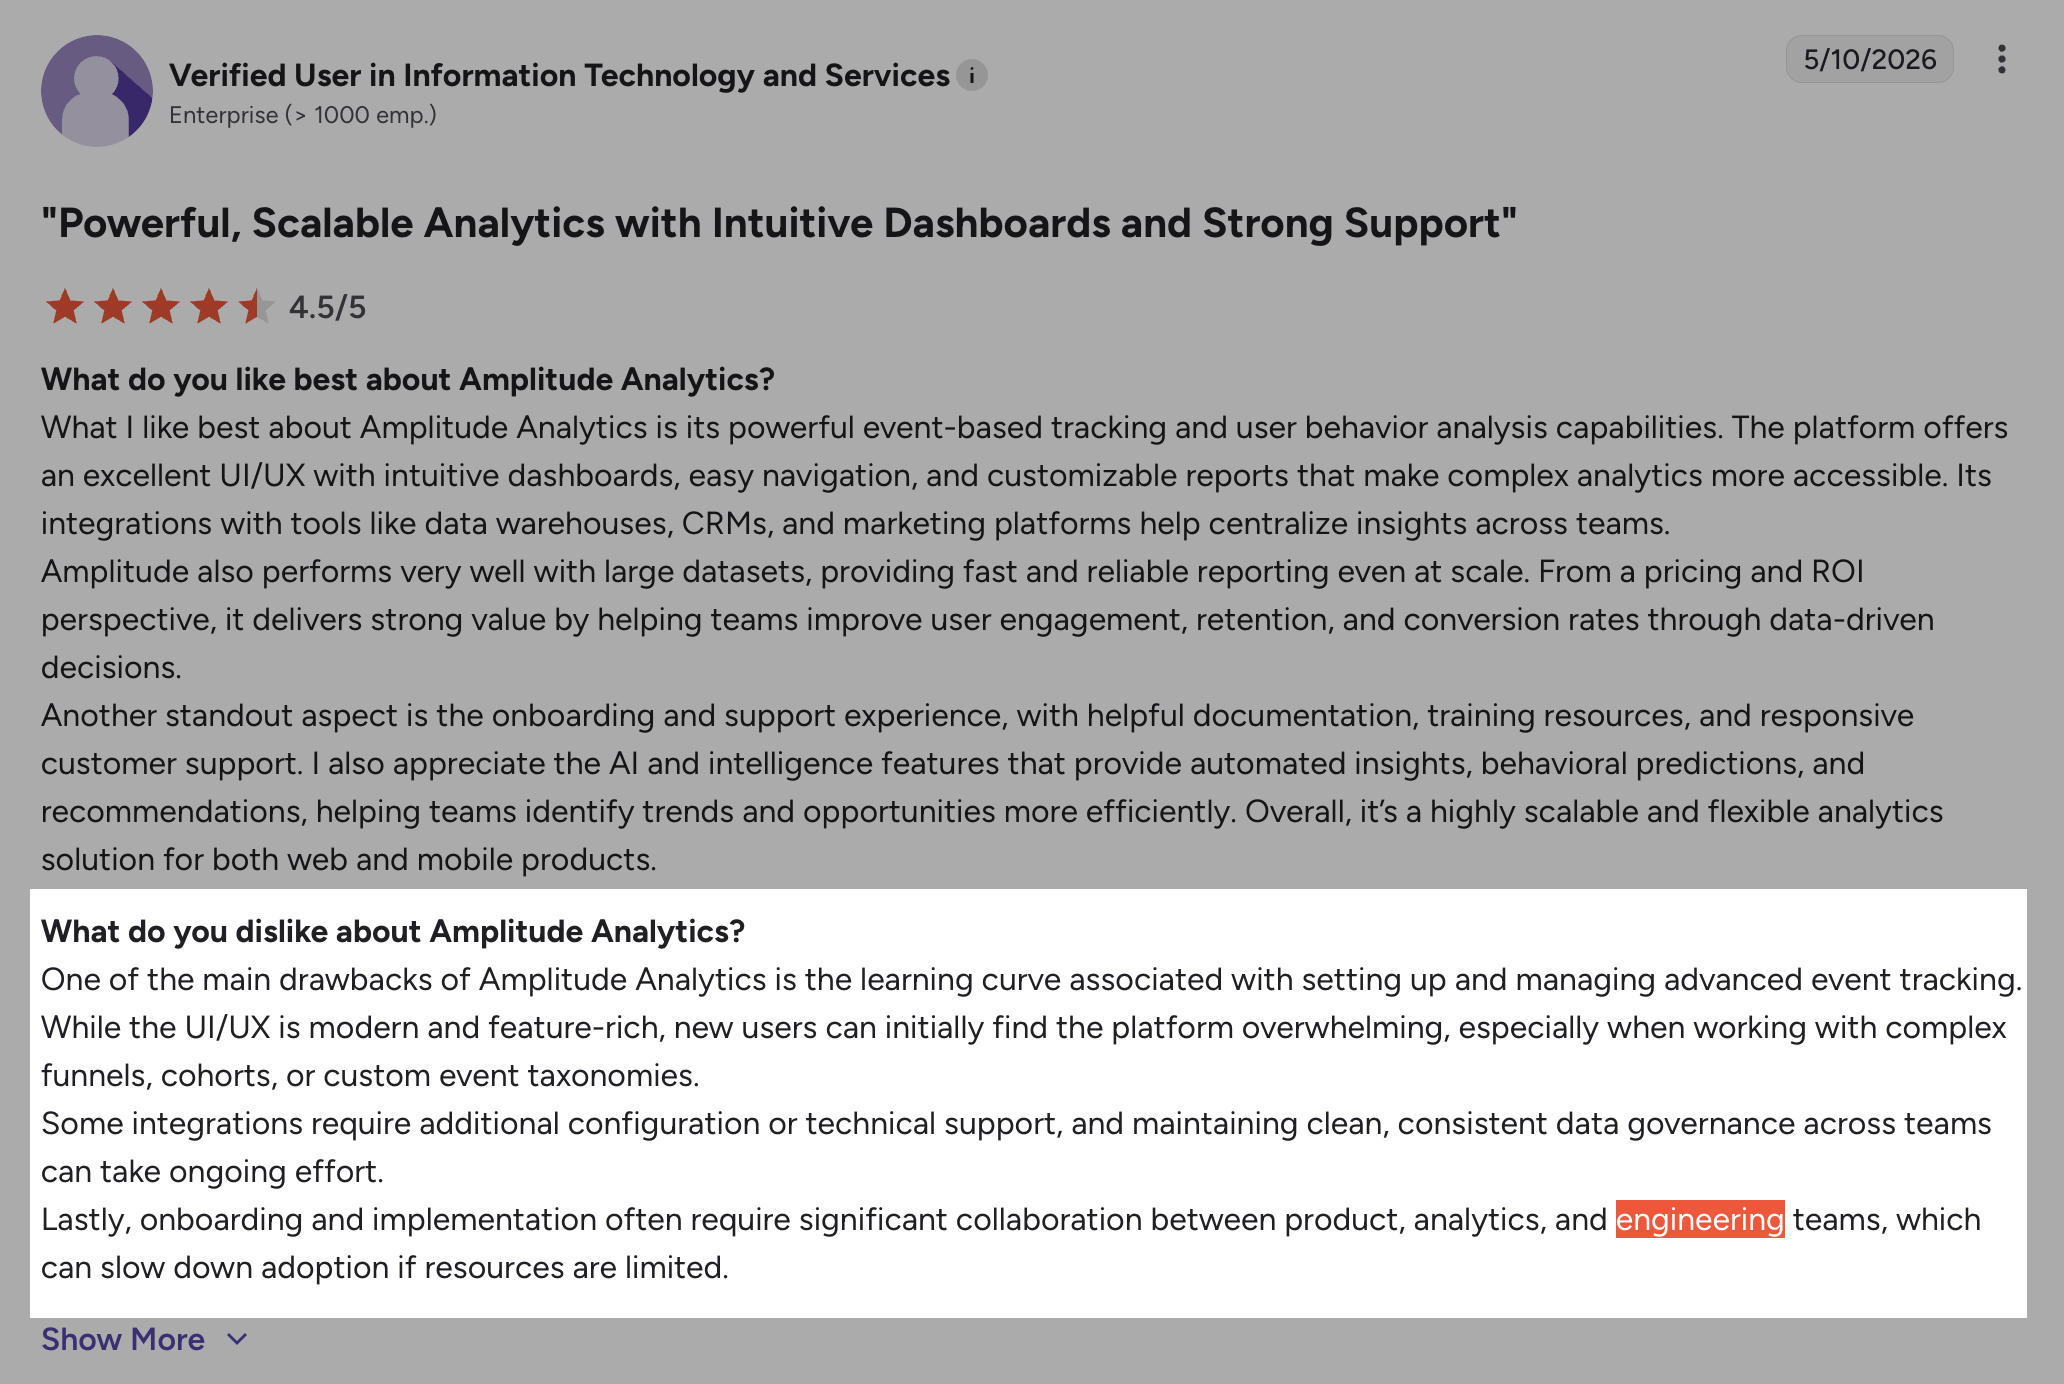
The developer dependency at Step 2 is Amplitude’s most consistent pain point in user reviews. Non-technical users, including the PMMs, marketers, and growth managers who spend the most time inside the data, cannot get started without an engineering ticket, since implementing tracking in Amplitude requires technical expertise that most non-engineering teams do not have on demand. Visual labeling reduces the ongoing burden after the initial setup, but the instrumentation cost at the start does not disappear.
From my experience across multiple analytics platforms, the setup phase is where most teams underestimate what they are committing to with Amplitude. Getting there takes more time and engineering resources than most teams plan for.
If your team is stuck waiting on engineering before you can even start measuring user behavior, Userpilot offers product analytics that can be deployed through GTM or Segment, with significantly less engineering overhead than Amplitude requires to get started.
What changed in Amplitude in 2026
By late 2025 and into 2026, Amplitude expanded its AI capabilities substantially, moving beyond dashboard analytics toward what it calls behavioral intelligence for agentic software products.
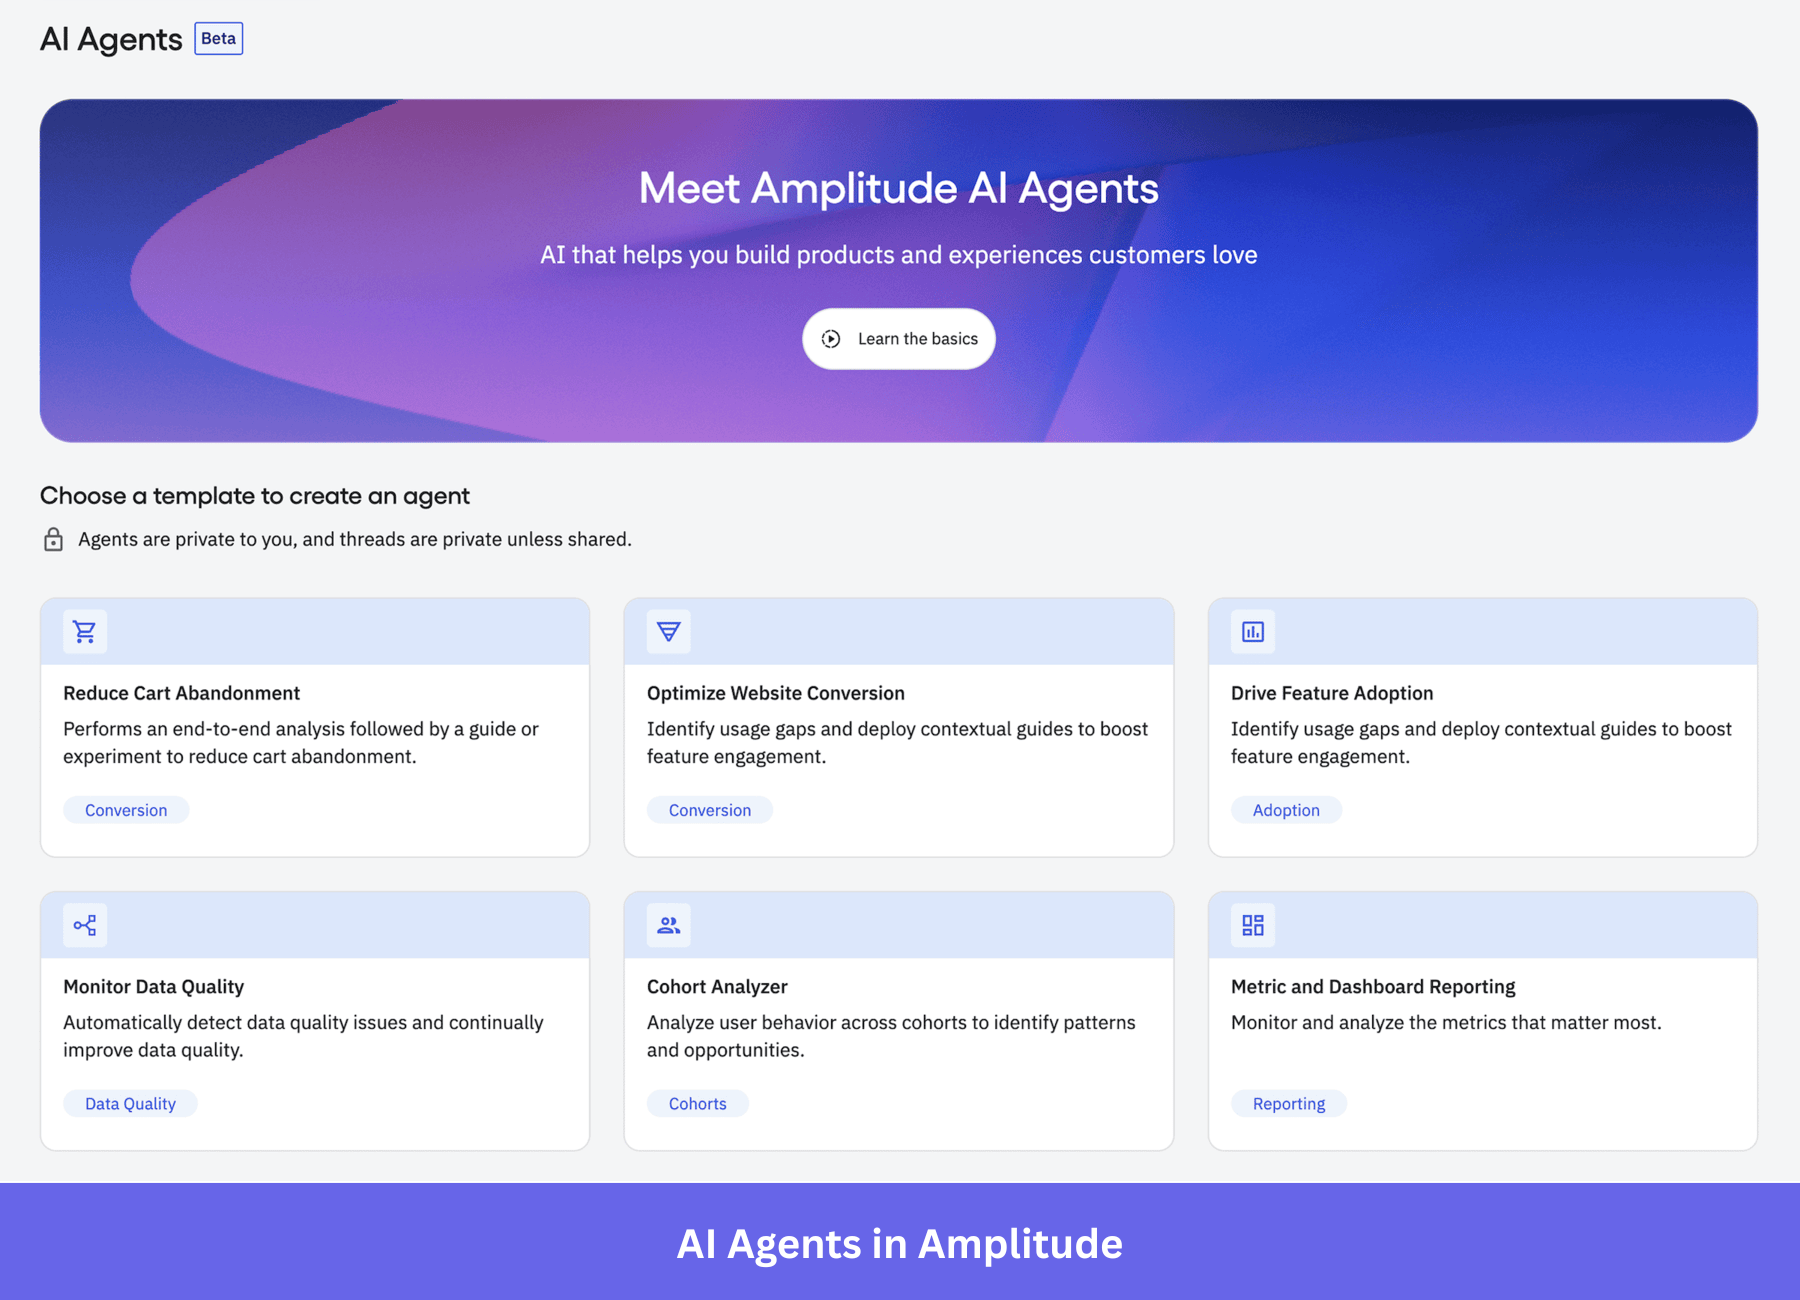
The agentic AI layer
Amplitude expanded its AI product surface with a Global Agent and specialized AI workflows covering five areas:
- Dashboard analysis and monitoring: Surfaces metric changes through real-time analytics and investigates root causes without manual review.
- Session replay review: Identifies friction points across replays and quantifies their impact on conversion and retention.
- Customer feedback synthesis: Processes unstructured inputs from support tickets, reviews, and surveys into user insights that teams can act on.
- Experimentation support: Assists with test design, result analysis, and rollout recommendations.
- Opportunity discovery: Proactively surfaces growth opportunities from behavioral patterns in the data.
Amplitude’s experimentation capabilities also cover A/B testing and feature flagging, enabling teams to test new features and measure their impact on user engagement before committing to a full rollout.
The Global Agent ties these workflows together, enabling teams to ask product questions in plain language and receive answers, drawing simultaneously on funnels, experiments, segments, and user journeys. Amplitude also launched an MCP server that surfaces behavioral data inside tools teams already use, such as Anthropic, OpenAI, Cursor, Figma, Lovable, Notion, and GitHub.
What this means for mid-market teams
Amplitude is building toward being the behavioral intelligence layer for agentic software products. That is, infrastructure for AI-powered decision-making at scale that goes beyond a dashboard for product managers. Enterprise teams with dedicated data engineering resources will find the platform stronger than ever.
Most mid-market SaaS teams, though, will find the gap between what Amplitude offers and what they can realistically implement keeps widening. The 20-person product team trying to understand why activation dropped last week is a progressively less central use case for this platform’s direction.
What does Amplitude tracking cost?
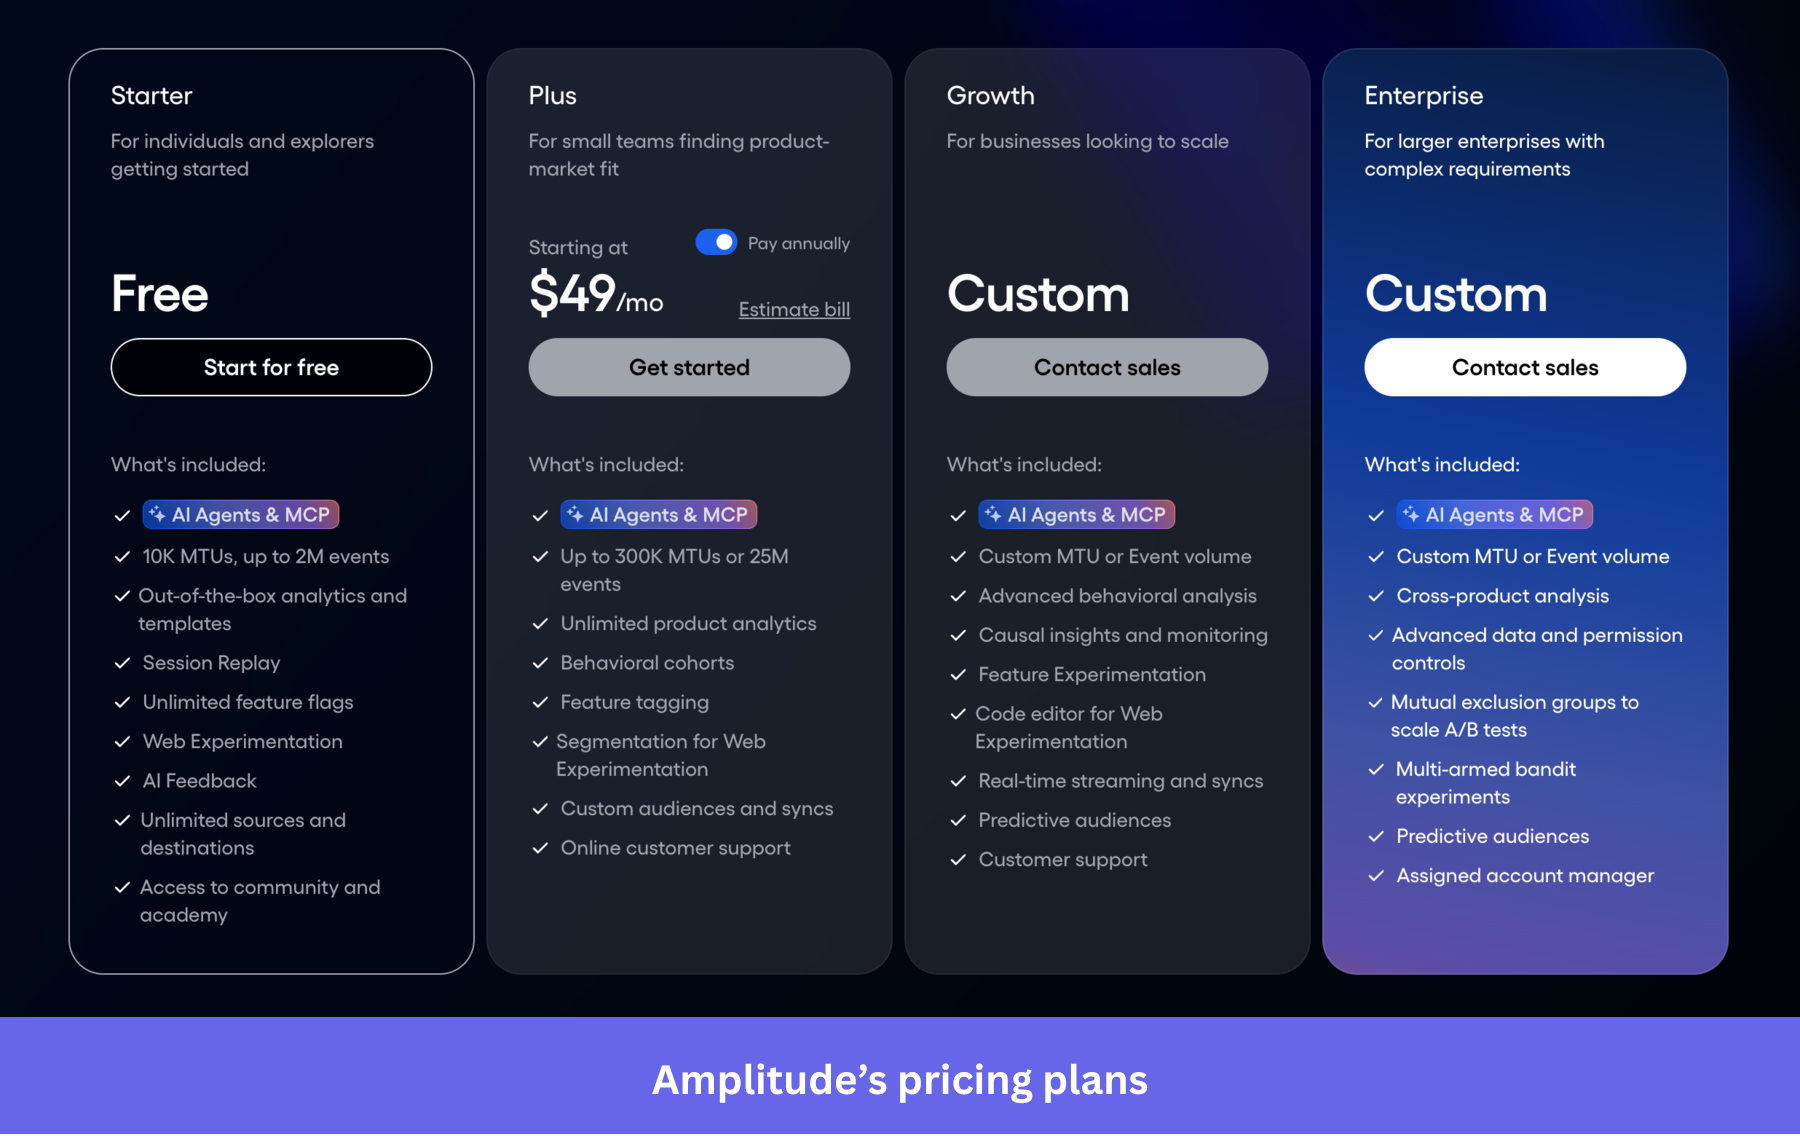
Amplitude’s pricing plans include the following tiers:
- Starter: The free Starter plan covers up to 10,000 MTUs and 2 million events per month. Session Replay is capped at 1,000 sessions per month. One active experiment is included.
- Plus: $49 per month (annual billing). Up to 300,000 MTUs or 25 million events per month. Session Replay at 10,000 sessions per month. Behavioral cohorts and custom audiences included.
- Growth and Enterprise: Custom pricing, sales-led. Advanced features, including web experimentation beyond base limits, mutual exclusion groups, and multi-armed bandits, are listed as add-ons in the detailed pricing grid rather than being included by default. Replay capacity beyond each plan’s included sessions is also an add-on.
Across 372 documented buyer deals, the median Amplitude contract was $64,724 per year, ranging from $24,000 to $379,000. The gap between published pricing and real contracts grows quickly at scale. Growth and Enterprise plans are fully negotiated with no self-serve path once you move past the Plus tier, which means there is no way to know what you will pay until you are in a sales conversation.
How MTU pricing works, and when it turns against you
Amplitude’s pricing is based on Monthly Tracked Users (MTUs). For example, a user who triggers 500 events in a month costs the same as a user who triggers one. Teams with deeply engaged users get the favorable version of this model.
However, products experiencing viral traffic spikes or seasonal campaigns, where large cohorts briefly appear and leave, end up paying more than expected. As MTU counts climb, overages accumulate, and resolving them requires a direct sales negotiation rather than a self-serve adjustment. Standard Amplitude contracts also include an automatic 8% price increase on renewal that does not appear on the public pricing page.
For a sense of the total cost of ownership, at 300,000 MTUs and 75 million events, your first year’s total cost looks significantly different once you include implementation engineering and data pipeline costs.
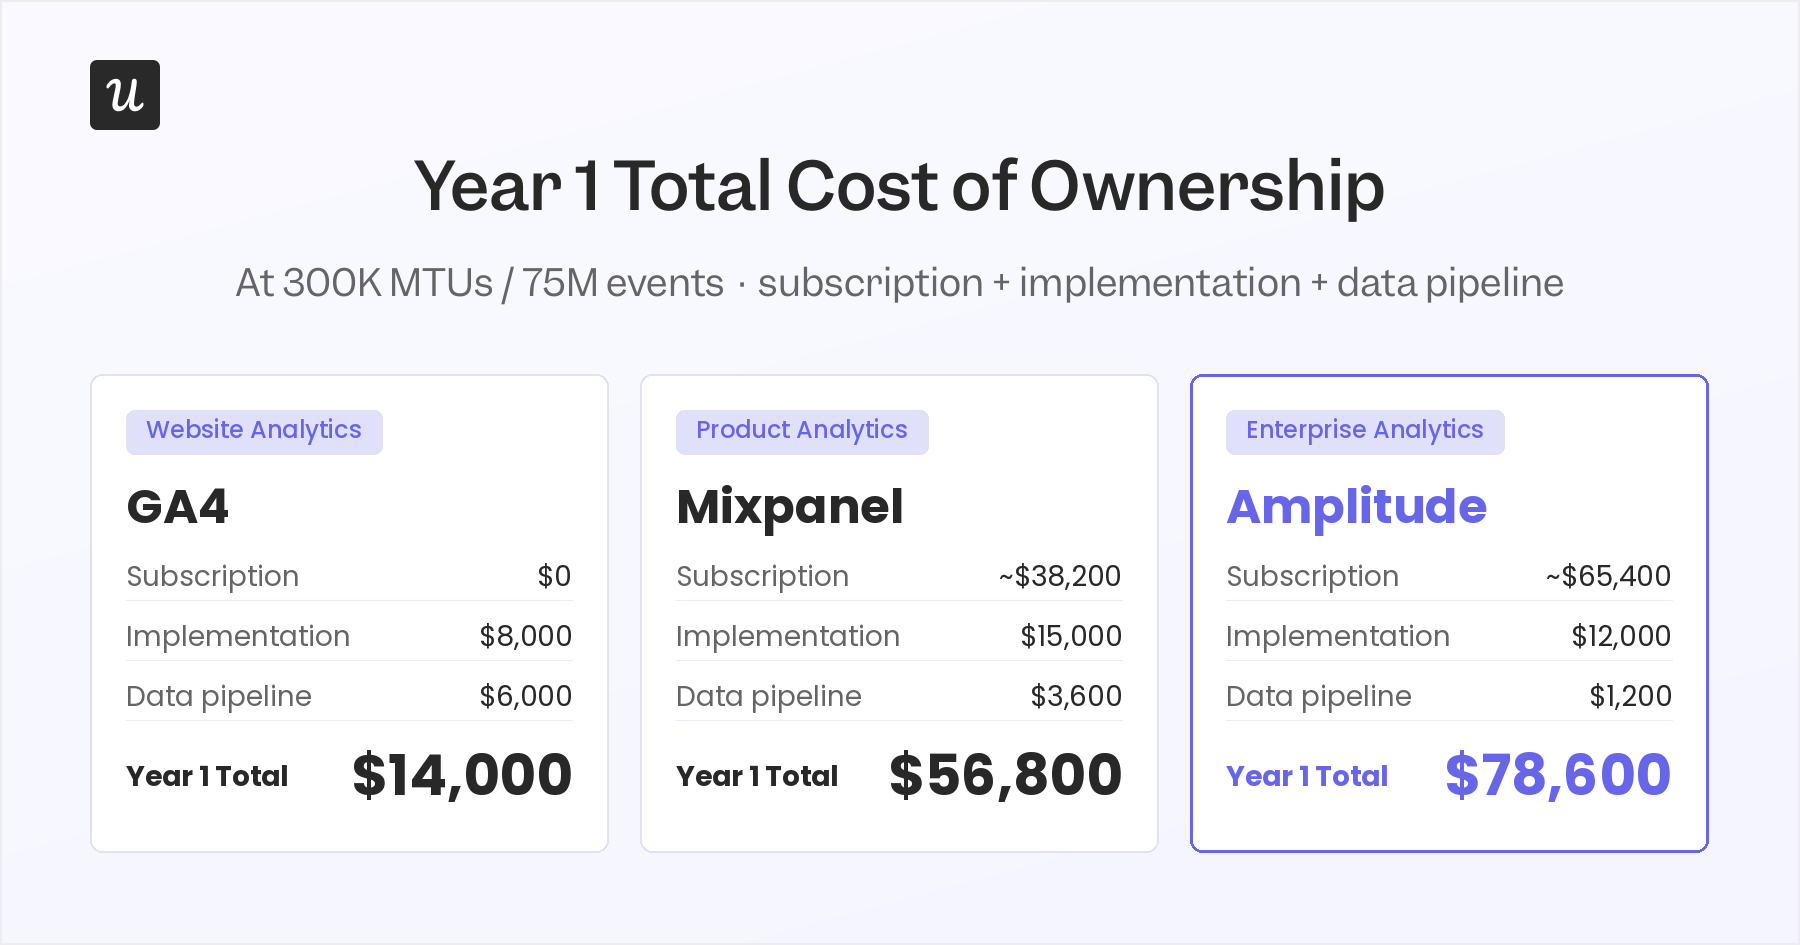
Google Analytics remains the simpler choice for teams focused on website tracking and marketing campaigns, with easier setup through Google Tag Manager, though it lacks the product analytics depth Amplitude provides. If spending that much in your first year looks like too much, Userpilot offers a single analytics tier that includes auto-capture, session replay, and in-app engagement.
Pros and cons of Amplitude tracking
Pros
- Cross-platform analytics across web, mobile, and server in one place, once the data flows cleanly.
- Extensive integrations: over 100 third-party connections, many requiring no coding to configure.
- A strong analysis suite that enables teams to extract deeper insights from user behavior as their event taxonomy matures.
- An intuitive interface for navigating reports and building dashboards once the initial setup is complete.
- Feature adoption analytics: visibility into which features users are actually engaging with after launch, broken down by cohort and time period.
- The agentic AI layer adds plain-language querying and automated monitoring for teams running the full platform.
- Hybrid autocapture combined with visual labeling reduces ongoing developer dependency after the initial setup is complete.
Cons
- Initial setup requires developer bandwidth, with no path around it for custom and backend tracking. (Userpilot, which is more user-friendly for non-technical teams, can be deployed via GTM or Segment with significantly less engineering overhead.)
- MTU-based pricing is unpredictable under traffic spikes, and overages require direct sales negotiation to resolve.
- OR-logic custom events have structural limits when the analysis requires tracking complex behavioral chains or sequences.
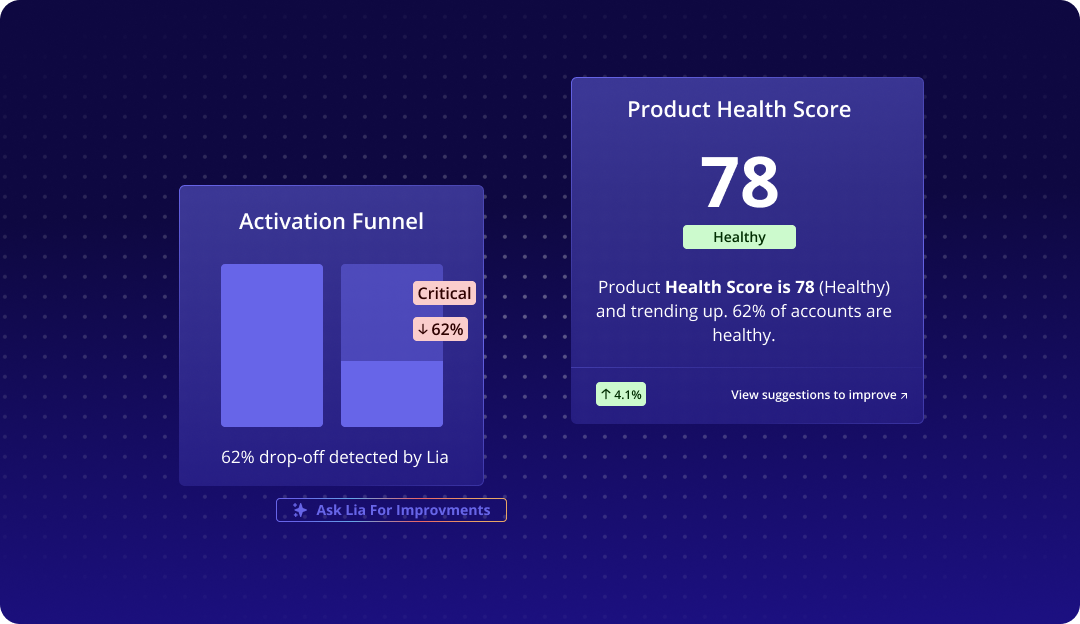
- Steep learning curve before the platform becomes intuitive for non-technical users, something I hear consistently from PMMs who work with it. (Userpilot’s AI agent Lia lets non-technical users query their product data in plain language, without needing to know which report runs which analysis.)
- Standard contracts include an 8% automatic renewal increase, not shown on the public pricing page.
Track user behavior without the complexity of Amplitude!
Amplitude is a capable analytics platform, but capability and accessibility are not the same thing, and for most PMMs and product teams, that gap is the deal breaker. The complexity is overwhelming: developer tickets to instrument tracking, a learning curve that takes weeks before the data makes sense, and a contract that scales faster than most product and growth teams can reasonably absorb without a dedicated data engineer.
Unlike Amplitude, Userpilot is built for product and growth teams who need the right tool to drive growth from behavioral data without a complex setup. It can be deployed through GTM or Segment, and once it is running, Lia, Userpilot’s AI agent, lets you ask questions about your product data in plain language and get direct answers without navigating a complex report builder.
If you want to see what that looks like in practice, book a demo here.
Userpilot strives to provide accurate information to help businesses determine the best solution
for their particular needs. Due to the dynamic nature of the industry, the features offered by
Userpilot and others often change over time. The statements made in this article are accurate
to the best of Userpilot’s knowledge as of its publication/most recent update on June 10,
2026.
About the author