What Is Appcues Used For: Top Features and Use Cases


Curious about how you can use a tool like Appcues to grow your product? What are its best features and are there any drawbacks you should be aware of before investing in it?
We answer these questions in this article and dive deep into the use cases of Appcues, its pros and cons, along its pricing. We’ll also explore an alternative tool for product growth that offers more value for money.
What is Appcues?
Appcues is a no-code user onboarding software for web and mobile apps that enables non-technical teams to create personalized in-app experiences without requiring engineering support.
The platform also helps you track the performance of your flows and collect customer feedback.
What is Appcues used for?
SaaS companies use Appcues to:
- Onboard new users.
- Announce product updates.
- Enhance feature adoption.
- Offer self-service support.
- Understand user sentiment.
- Upsell and cross-sell to existing users.
Top Appcues features and use cases
Appcues has 3 main layers: engagement, engagement analytics, and feedback. In this section, we’ll explore how these features work separately and together to enhance the product experience.
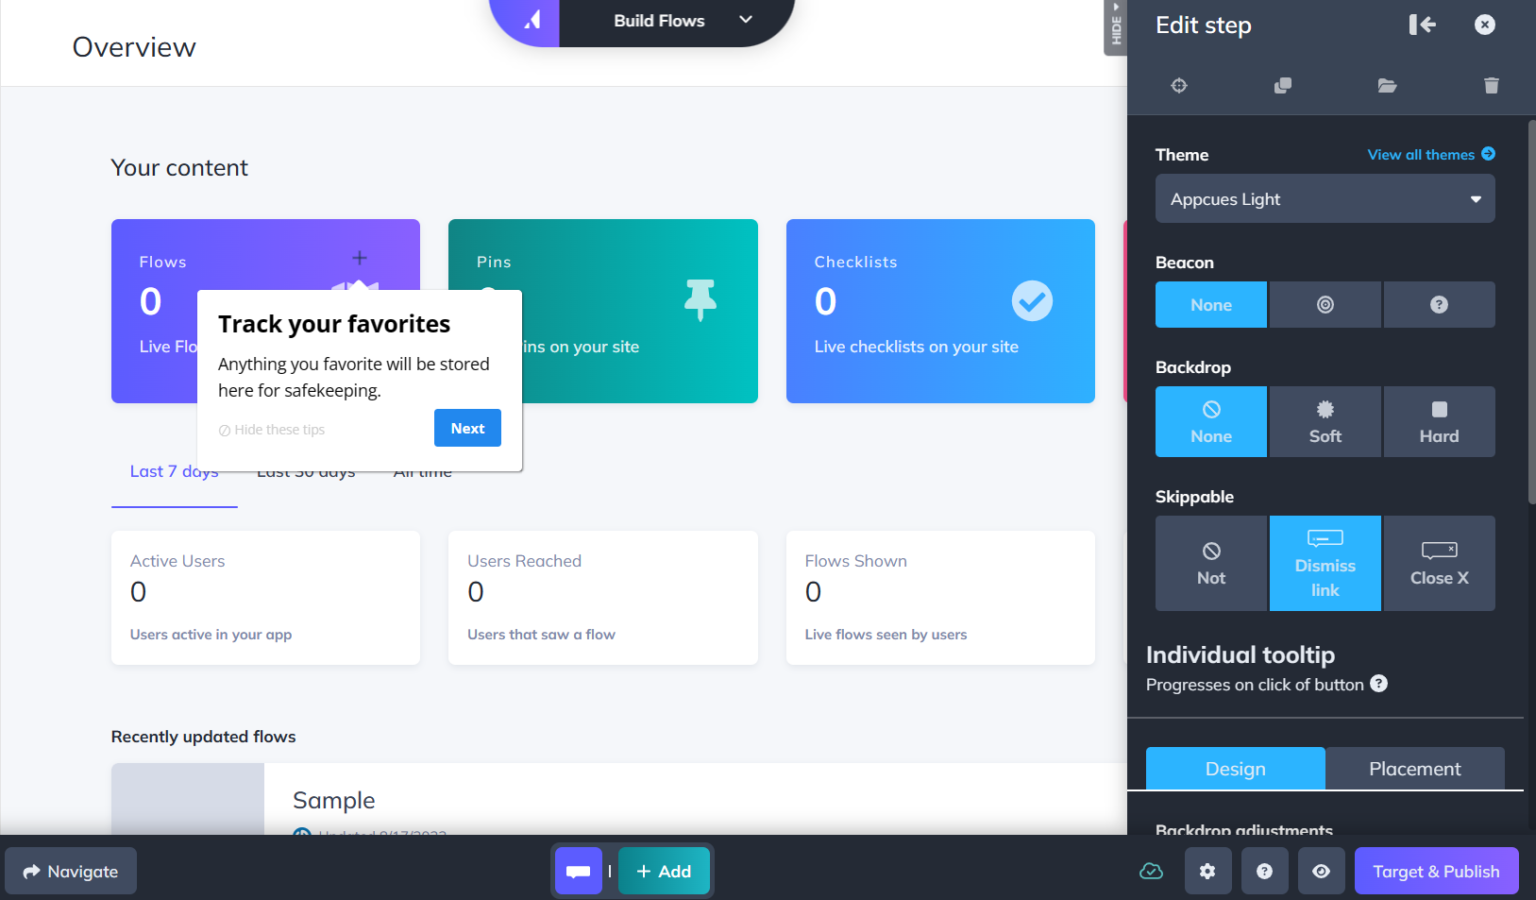
In-app flows for enhancing user engagement
Engagement features are Appcues’s main value proposition. These tools allow you to create in-app flows to guide users through your app and engage them with various features.
Key features for this use case include:
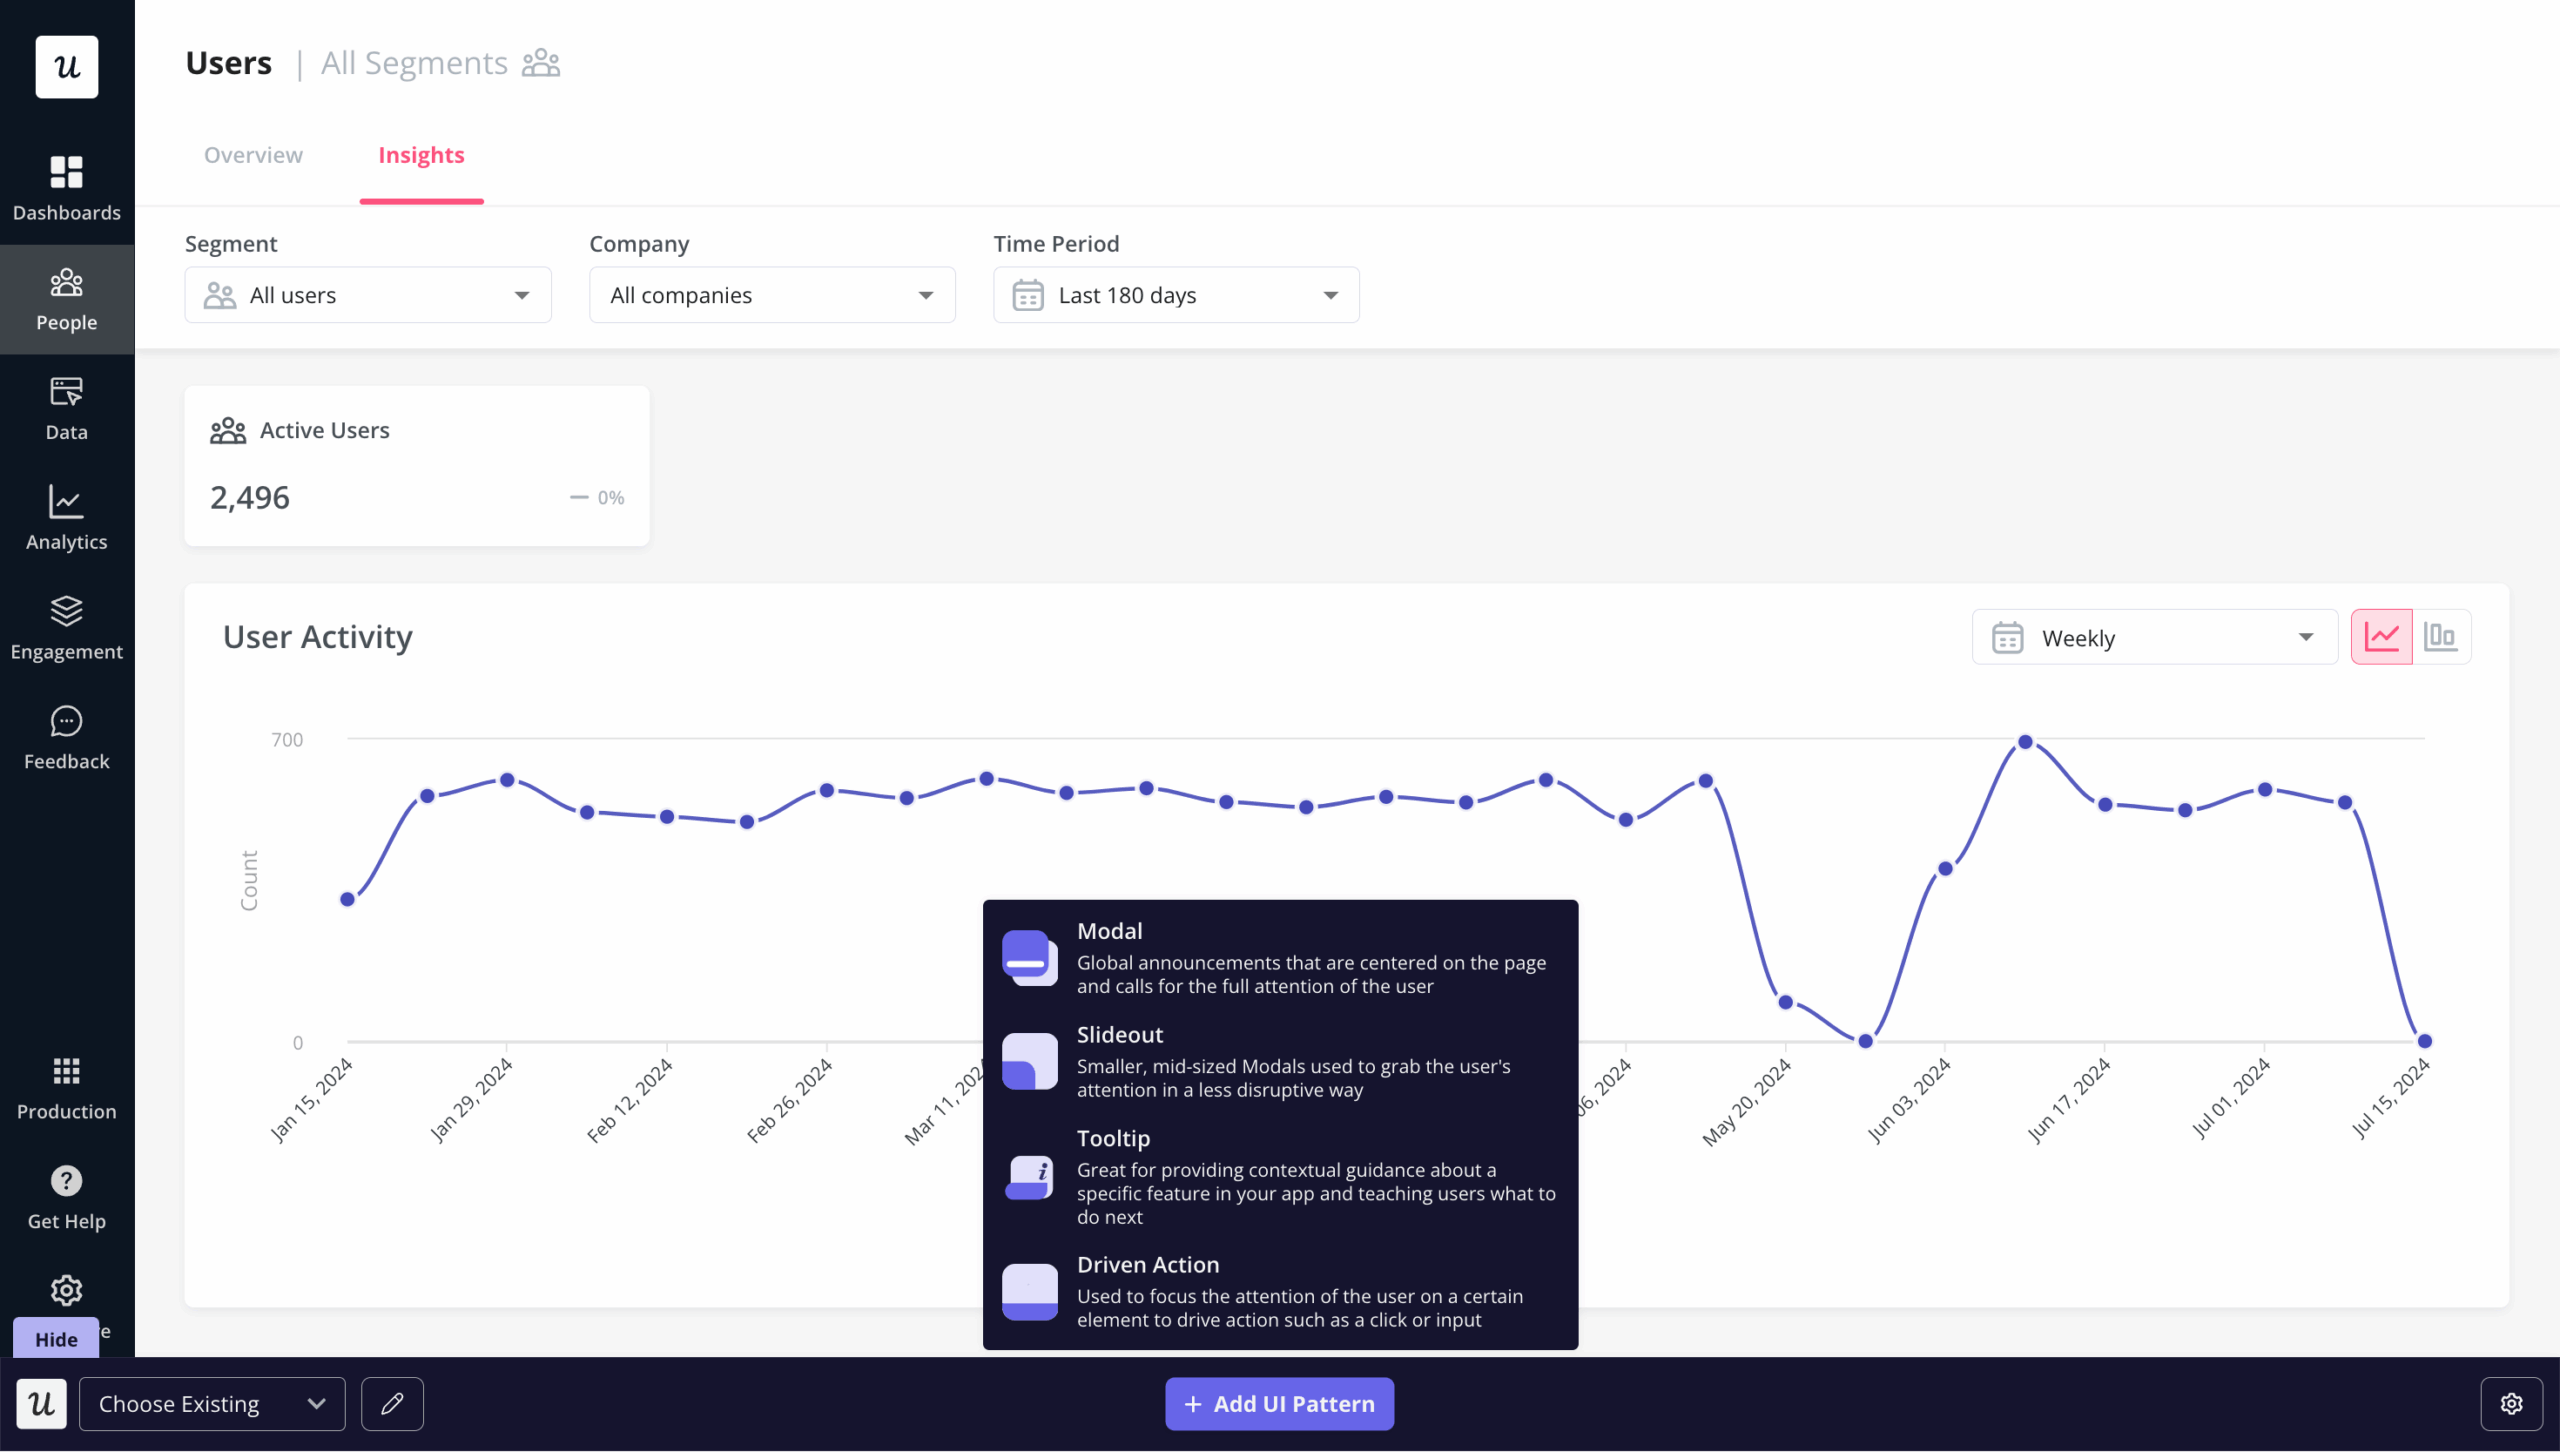
- UI patterns: You can choose from various UI patterns, such as hotspots, tooltips, modals, slideouts, and banners to communicate with users. These can be used either as standalone messages or combined into a multi-step interactive tour.
- No-code builder: Appcues comes with an intuitive Chrome extension that allows even non-technical people to easily create in-app messages and customize the placement, font, colors, and other elements.
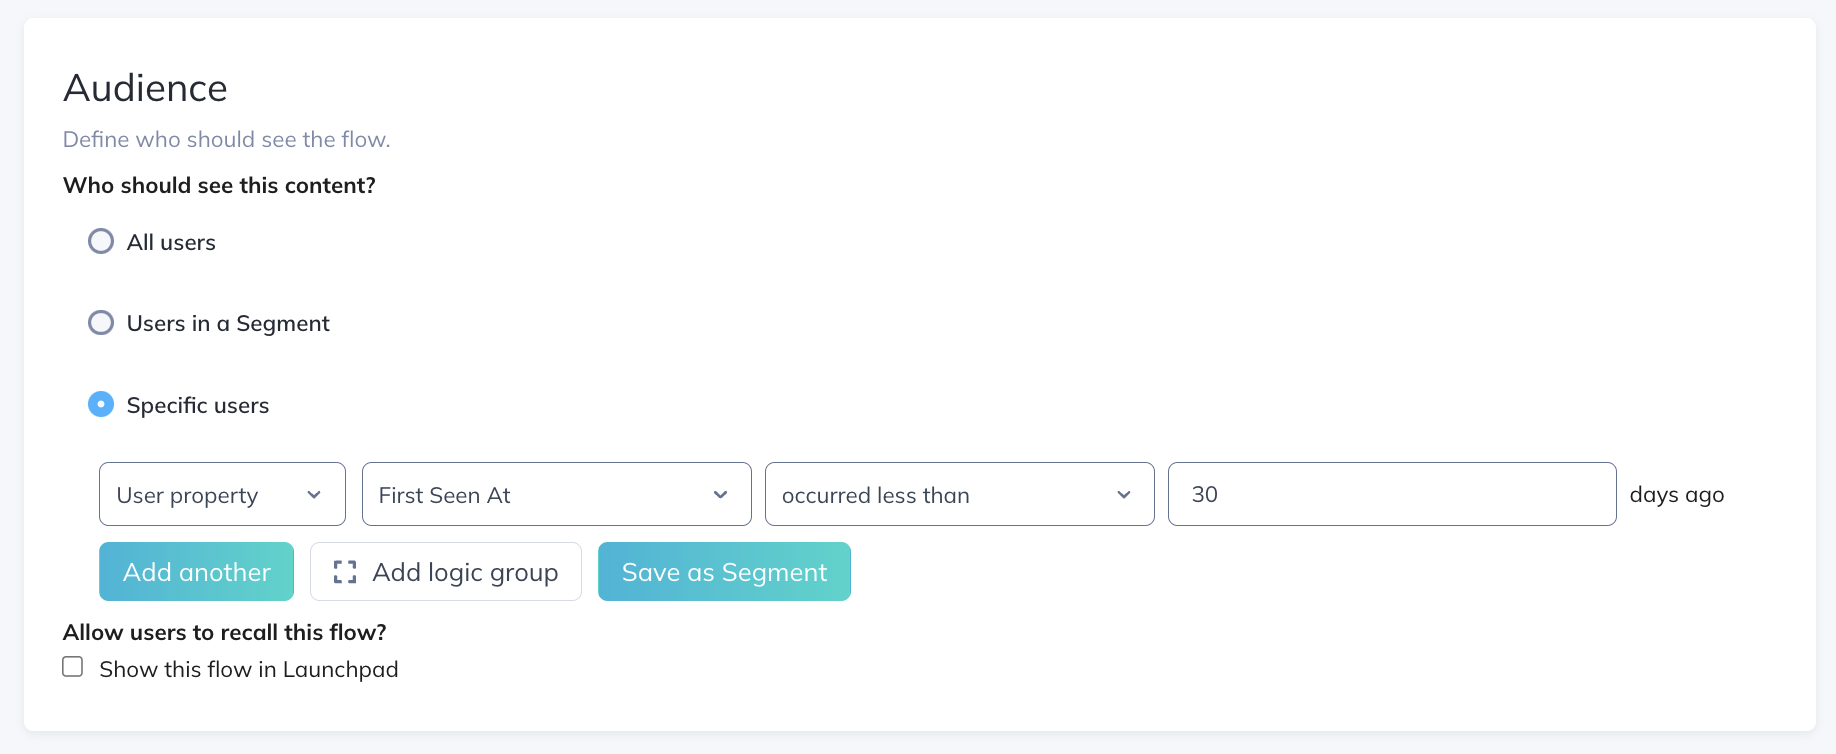
- Segmentation: There are four predefined segments: Explorers, Beginners, Regulars, and Champions. You can also build custom segments based on users’ plan tier, lifecycle stage, and behavior to deliver personalized experiences.
- Flow targeting: Appcues allows you to trigger flows to users based on their key attributes or actions (event-based triggering). This helps you ensure that the right message reaches the right users at the right time, thereby improving the chances of engagement.
- Push notifications: You can send targeted mobile notifications to disengaged users‘ phones to bring them back to your app. Appcues allow you to even link them to specific in-app messages so users can jump directly into action. For instance, you can remind new users to finish the onboarding process and take them back to where they left it once they click on it.
- Checklists: You can also create checklists with Appcues (NOT available on the Essentials plan) and prompt users to take action. However, these have limited functionality (you can’t trigger JS functions or add gamification elements) compared to alternatives, such as Userpilot.
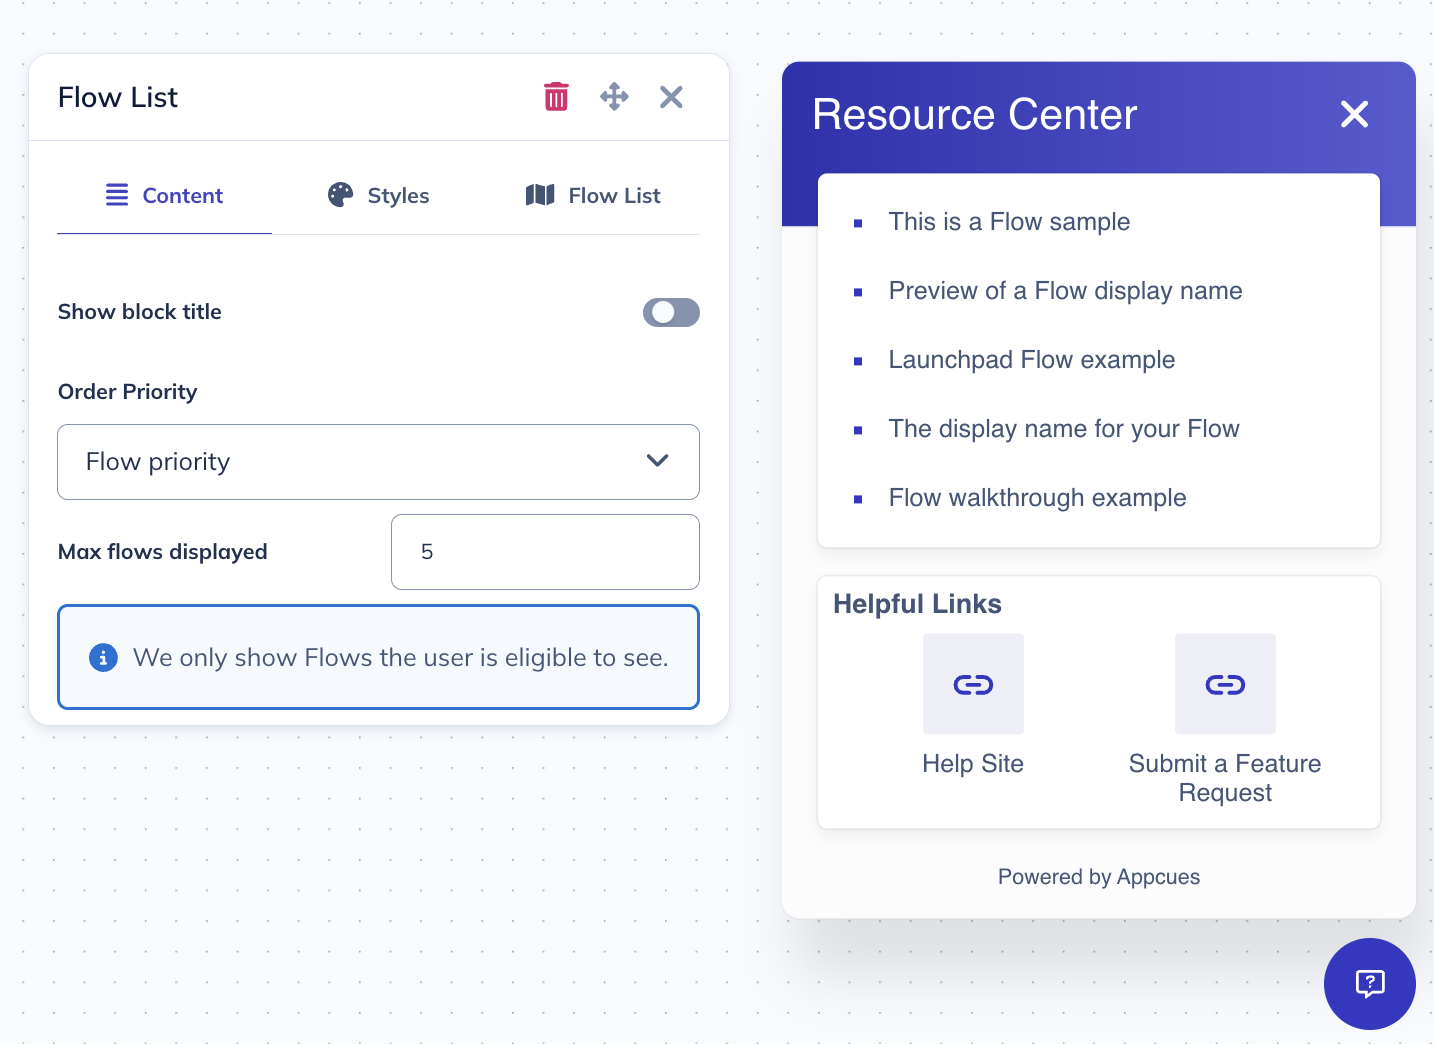
- Launchpads: These are interactive menus embedded in your app that provide quick access to content such as flows and links to external resources (e.g. blogs, documentation). Users can reference these whenever they get stuck and quickly find the answers they need.
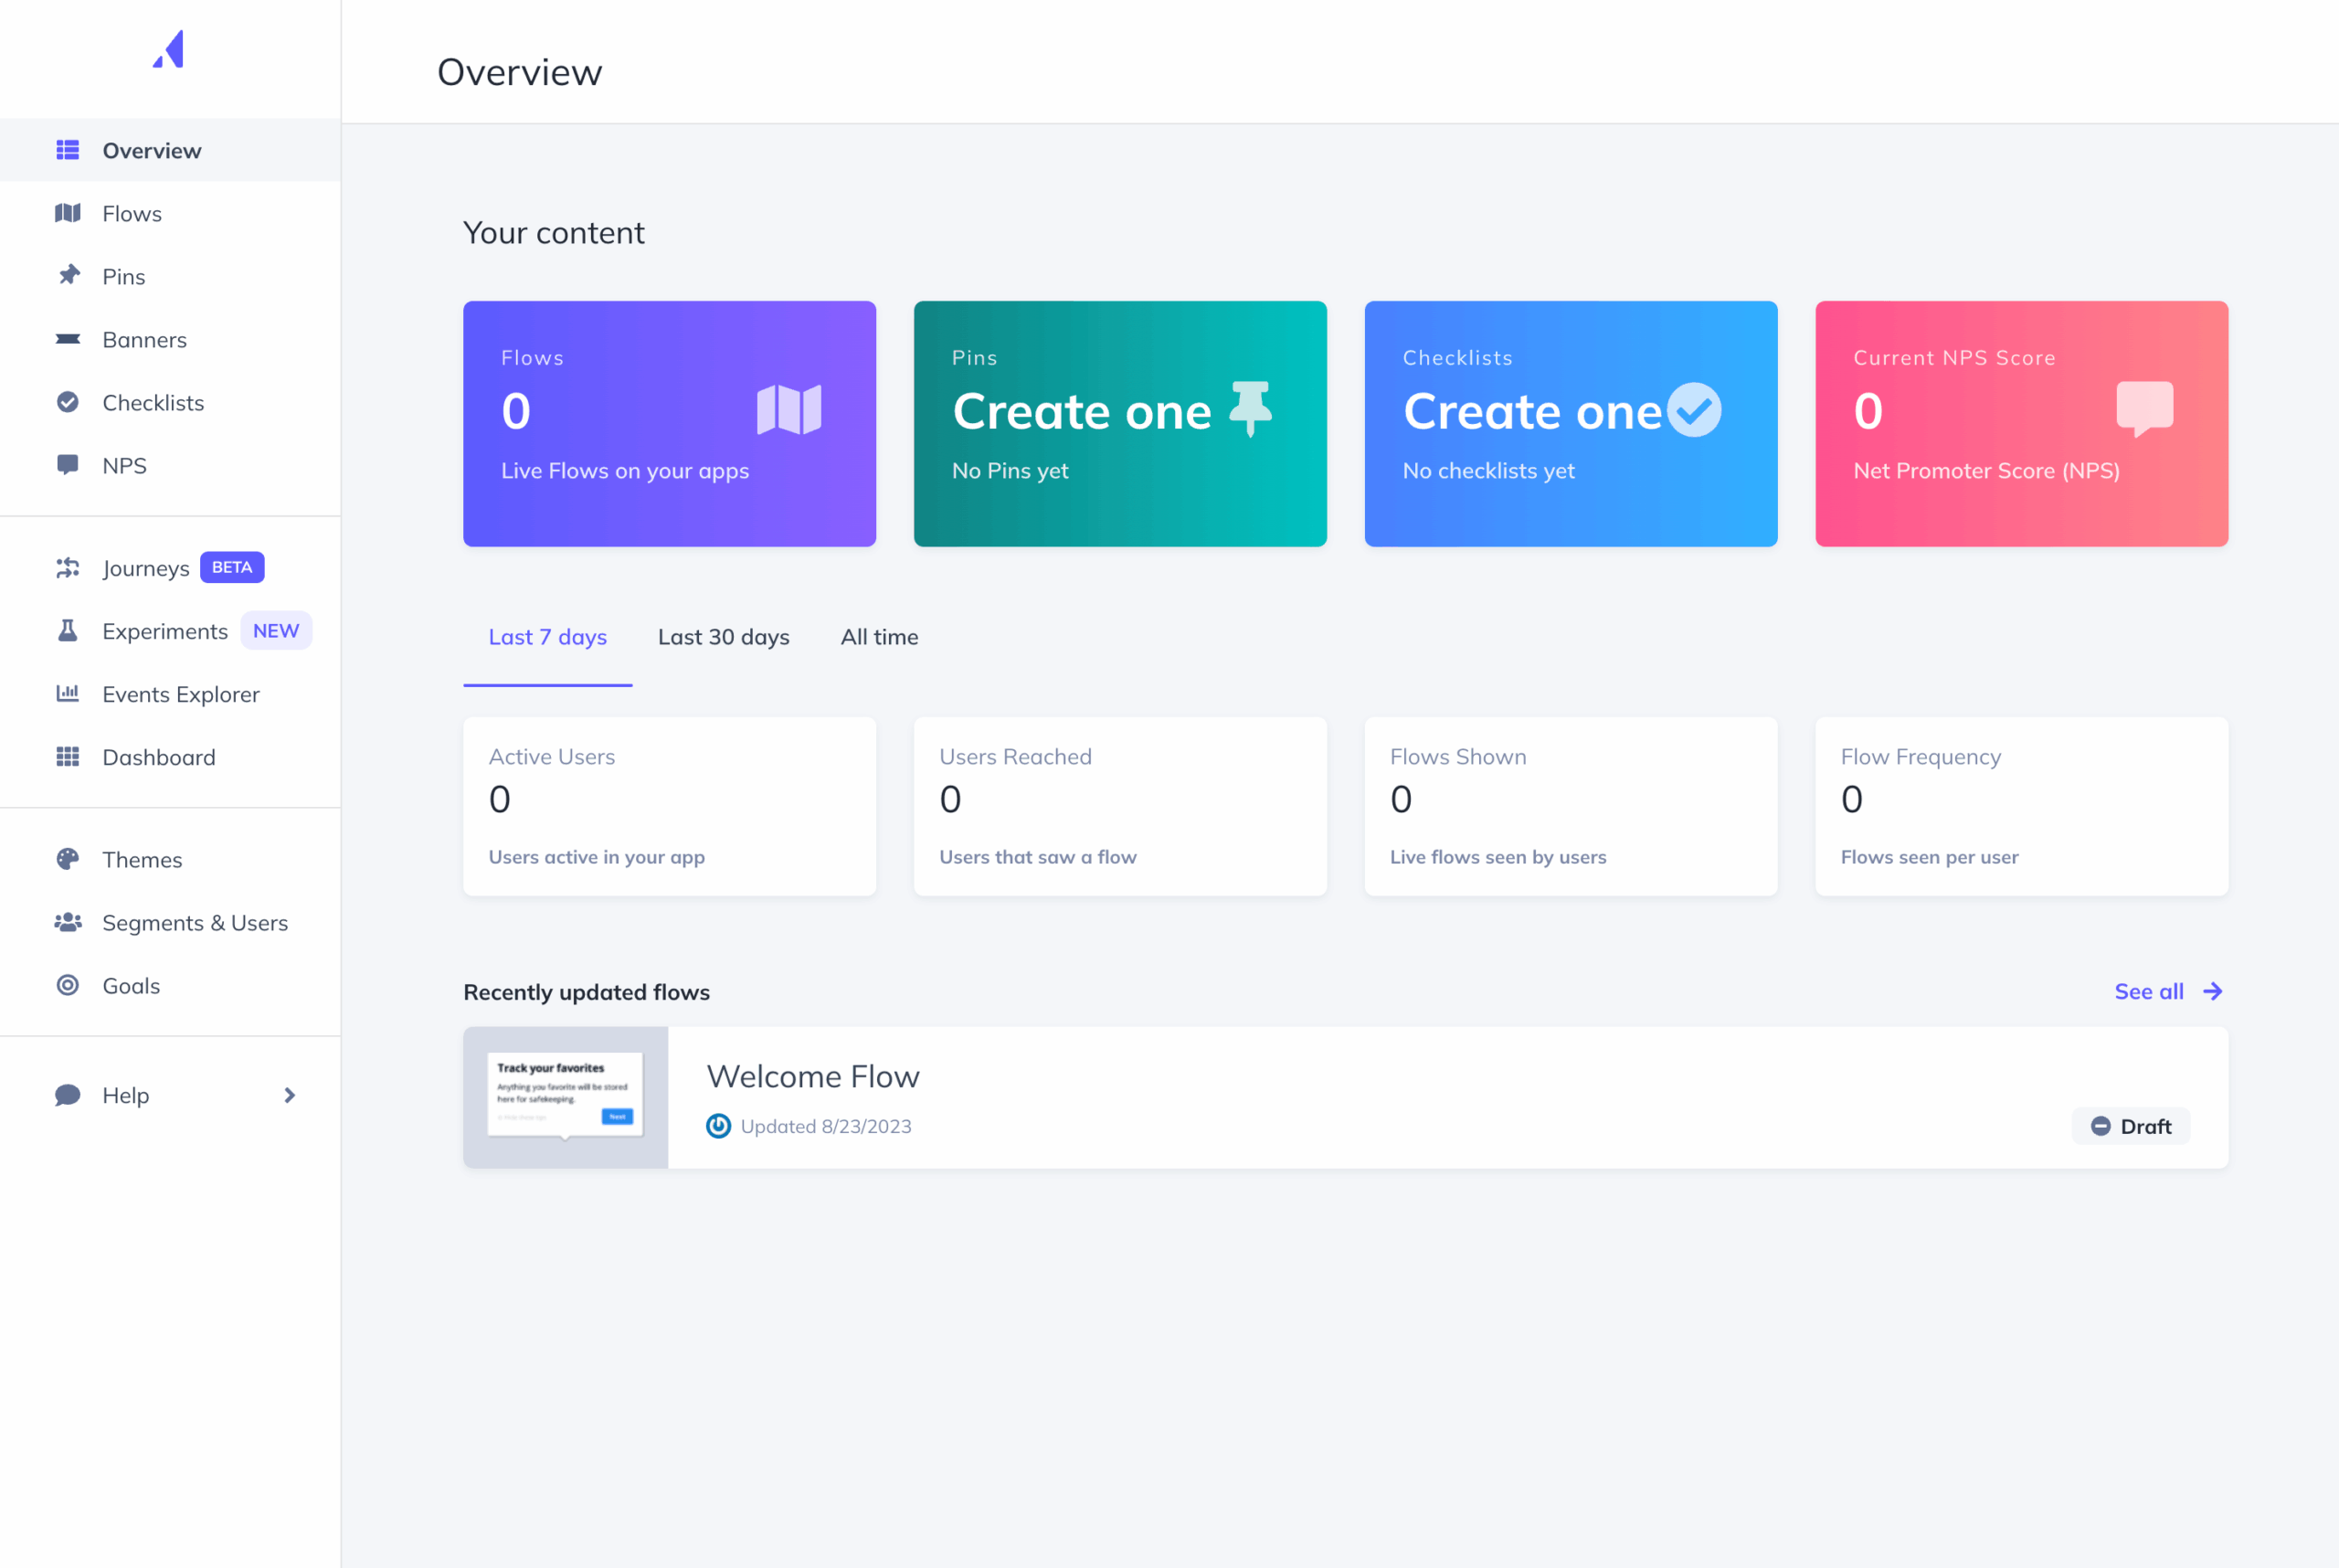
Engagement analytics for measuring the success of Appcues content
Although Appcues doesn’t offer product analytics features like funnels and paths for tracking product usage (which is a huge drawback, but later on this), it has some basic dashboards that allow you to see how your Appcues-authored content performs.
These include:
- Goal tracking: This allows you to measure the effectiveness of your flows in driving desired user actions. By defining specific events as goals, you can monitor the number of users who complete these actions after interacting with a flow. For instance, track how many users create a dashboard independently within 5 days of completing an interactive tour on the dashboard feature.
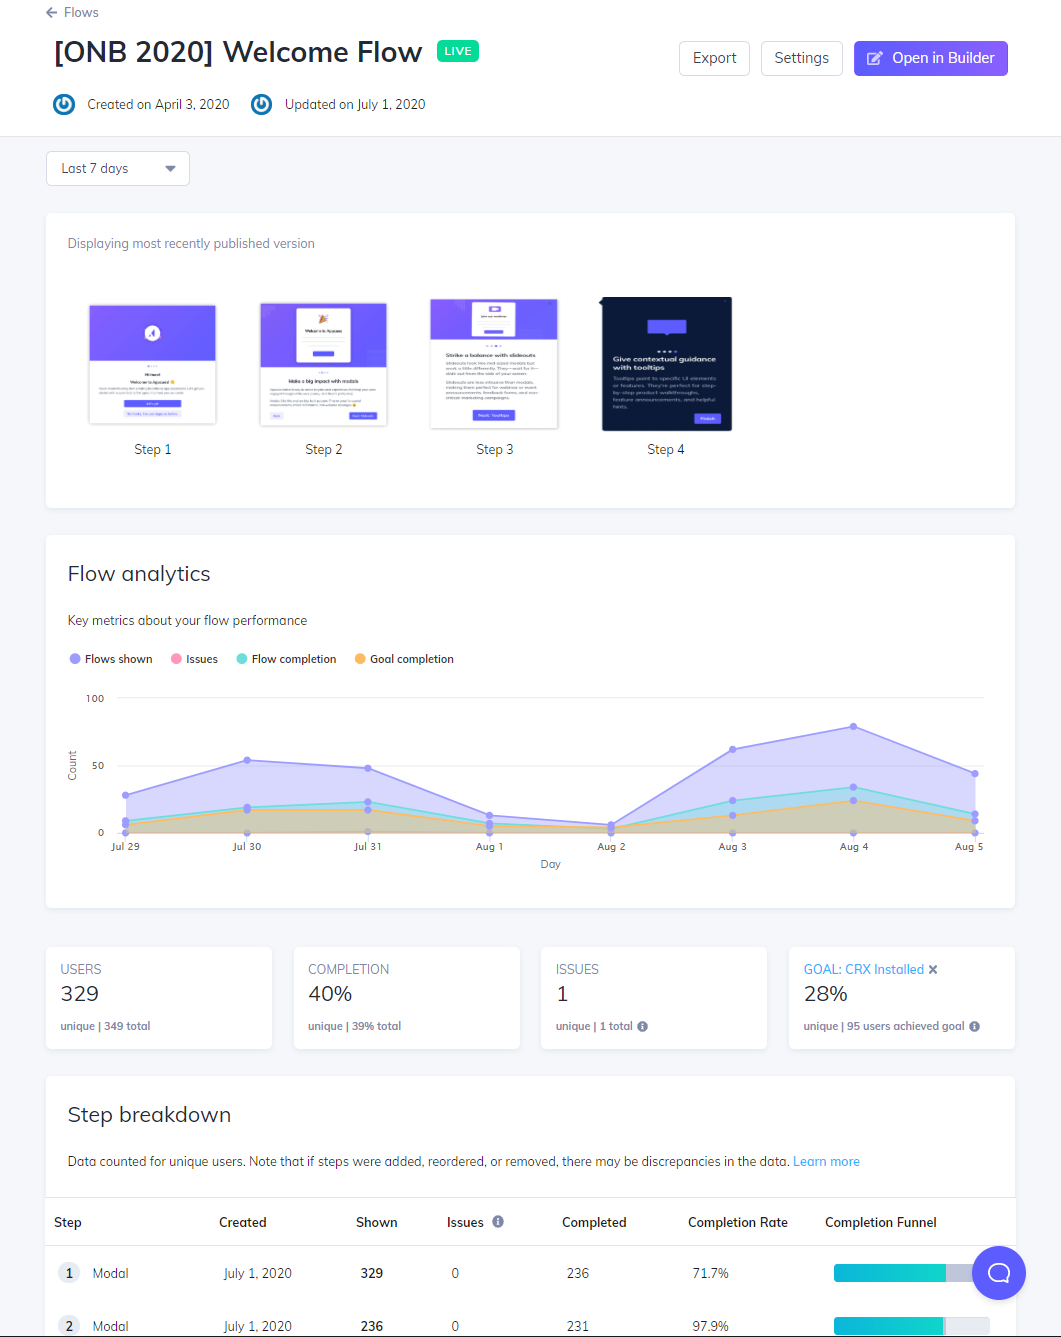
- Flow analytics: This visual chart displays key flow events over time, a scoreboard summarizing metrics like users’ seen and flow completion rates, and a step-by-step breakdown to identify user drop-off points.
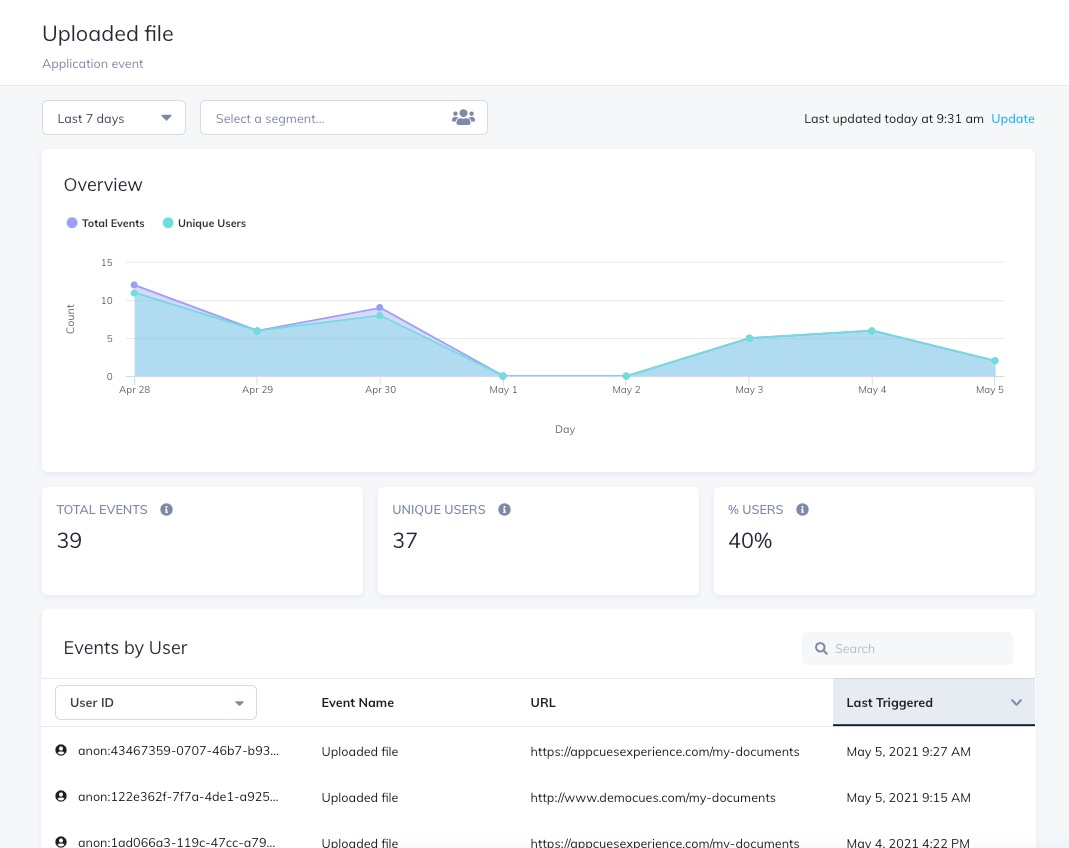
- Event explorer: With this dashboard, you get an overview chart of relevant metrics, such as total events, unique users who received an event, and the percentage of users who took action compared to your daily active users.
- A/B testing: Run experiments with small groups of users to compare the performance of different in-app sequences among them. Once you identify the best-performing ones, you can launch these to the rest of your user base.
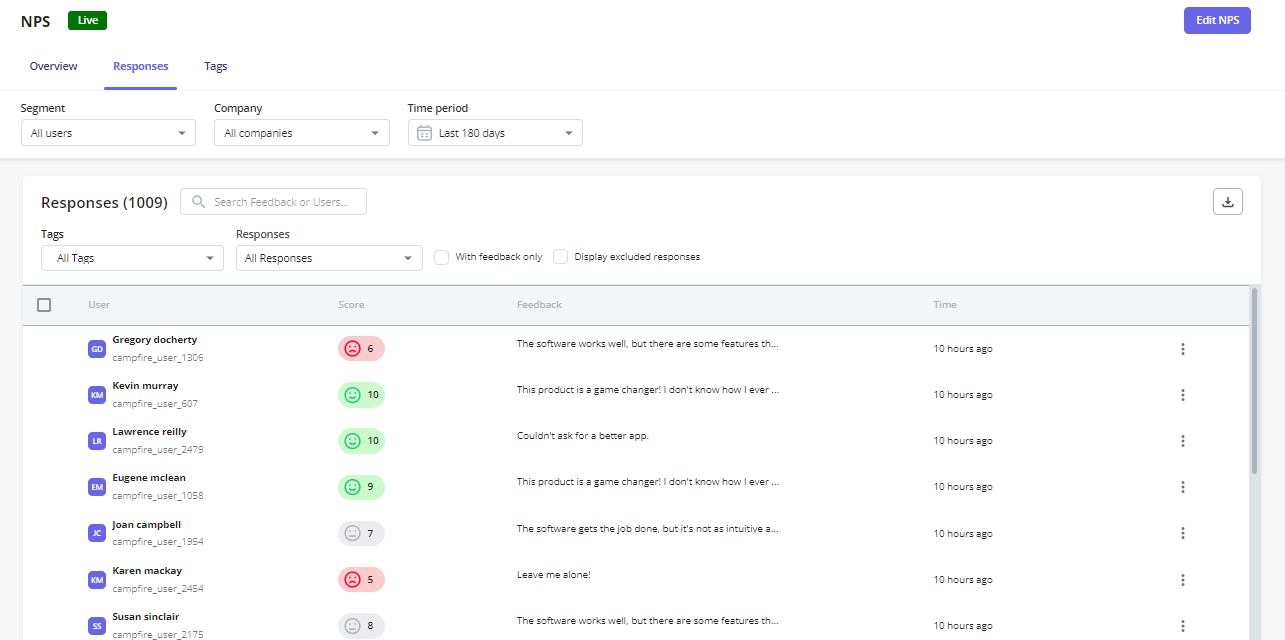
NPS surveys for user feedback collection
Appcues offers very limited features when it comes to user sentiment analysis. For example, you can’t create native CSAT, CES, or PMF surveys. Although you can work around this and add some questions on top of modals, this will complicate the process of analyzing responses and require lots of manual work.
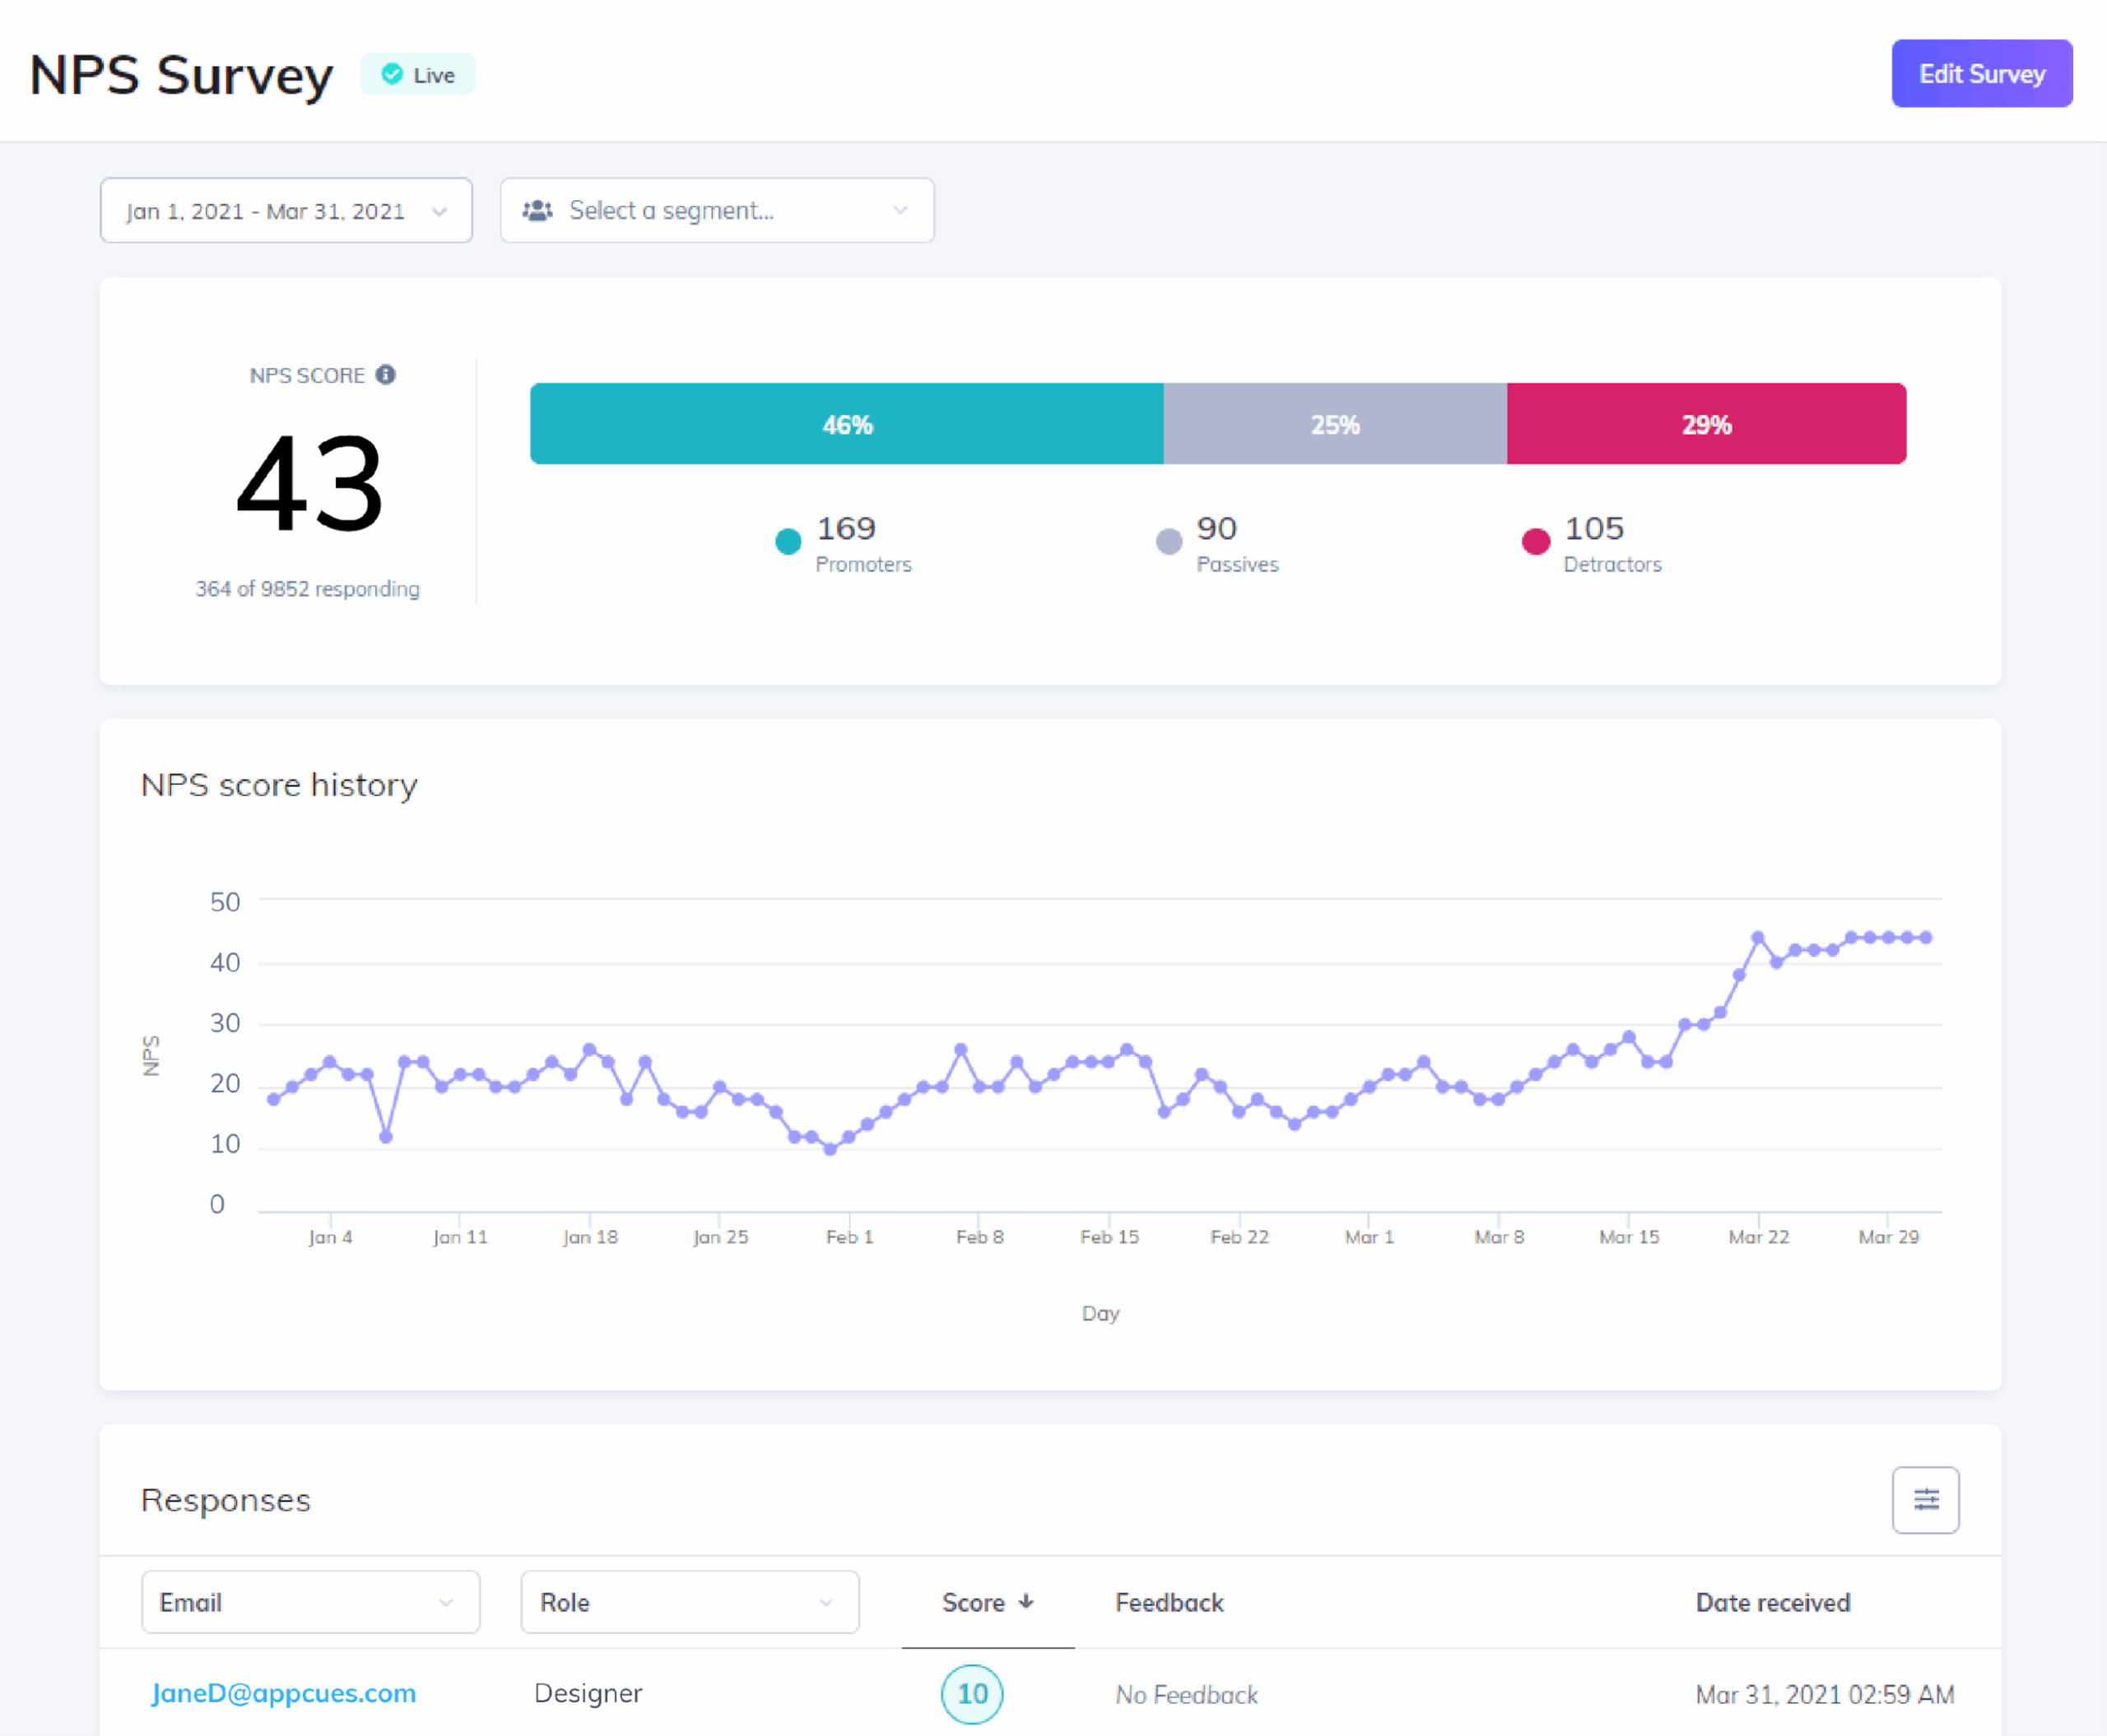
The only surveys native to Appcues are NPS surveys. Appcues NPS features include:
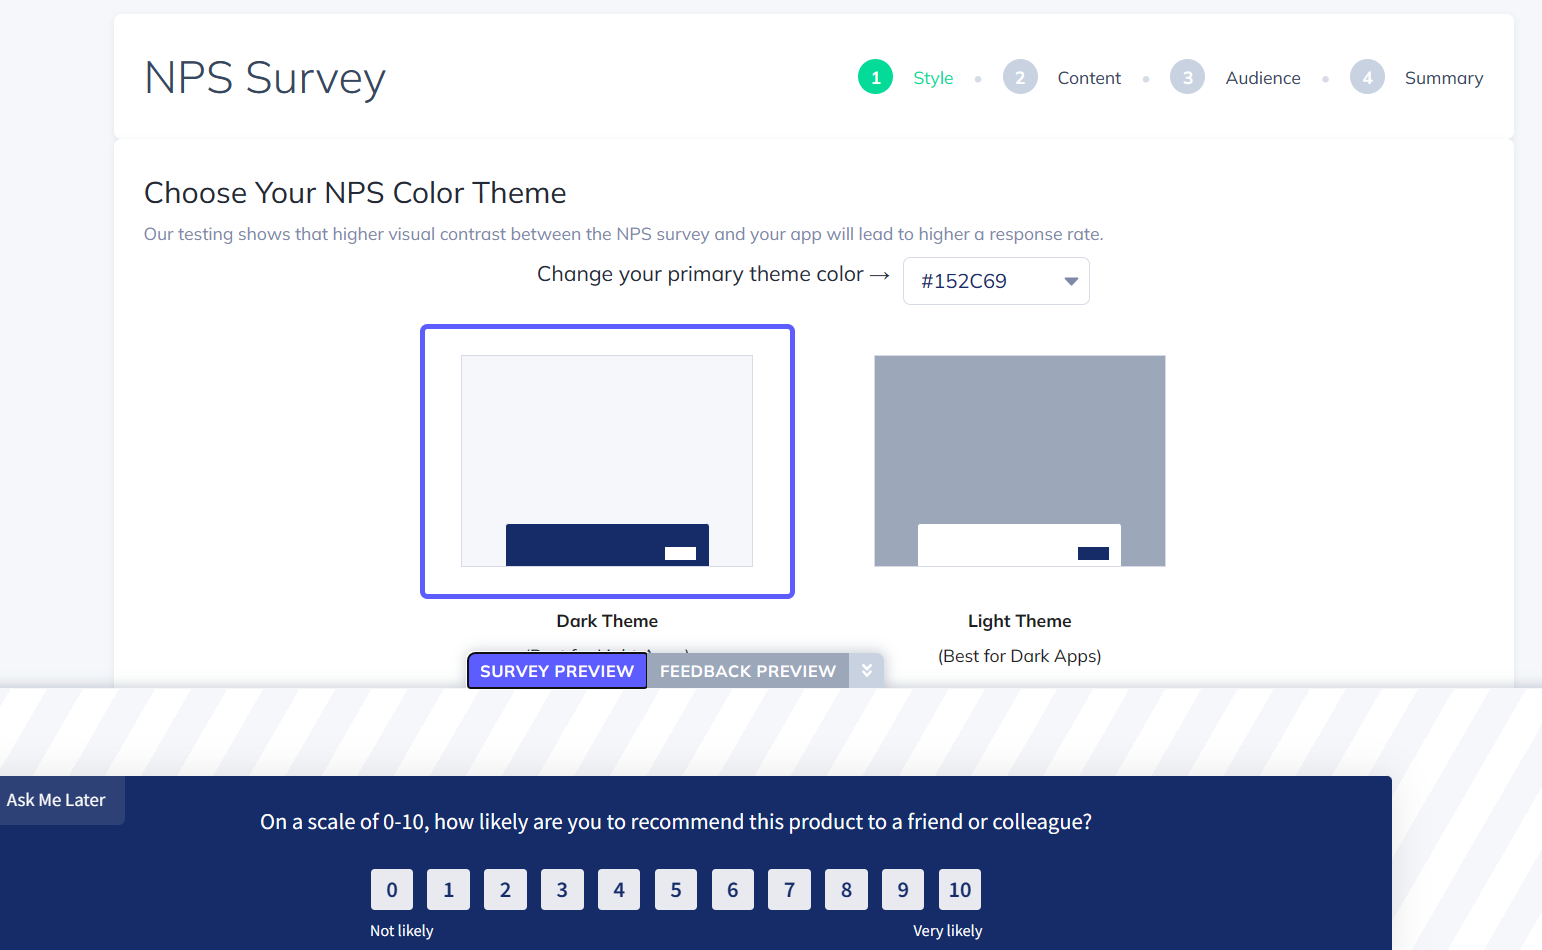
- NPS templates: You can access pre-built NPS templates and customize them to match your brand using Appcues’ drag-and-drop builder. However, you can’t have more than one NPS survey active at the same time.
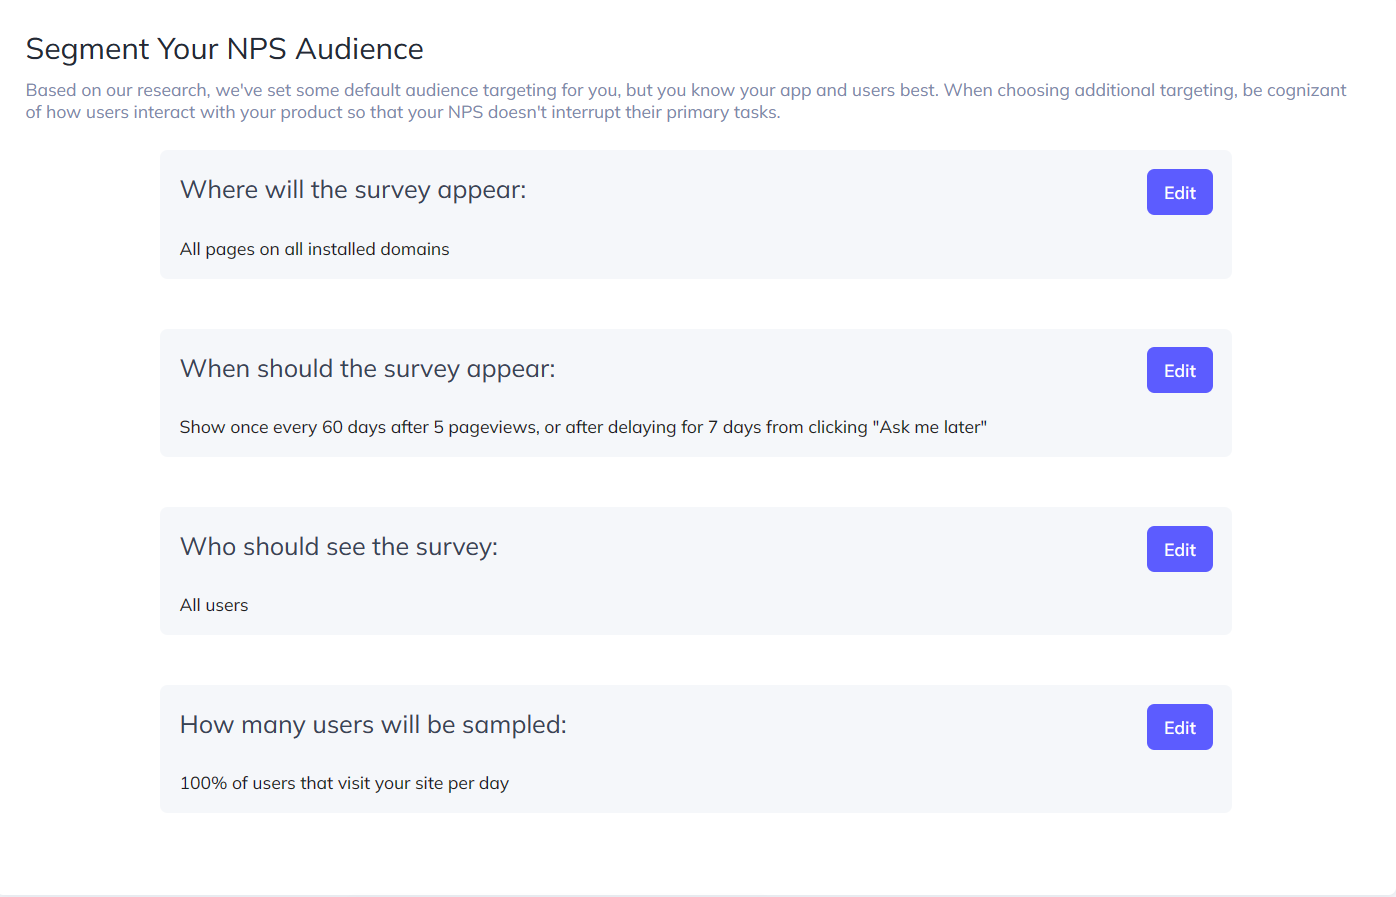
- Survey targeting: By defining criteria such as user activation status, page visits, and survey frequency, you can control when and to whom the NPS survey appears. For example, you might target users who have been active for more than 45 days and have visited at least five pages, while excluding certain URLs to avoid interrupting critical workflows.
- NPS dashboard: Track, analyze, and visualize NPS survey results in a dashboard. You can view them as an easy-to-understand graph and filter results based on date ranges. It’s also possible to export the results into a PDF file.
How much does Appcues cost?
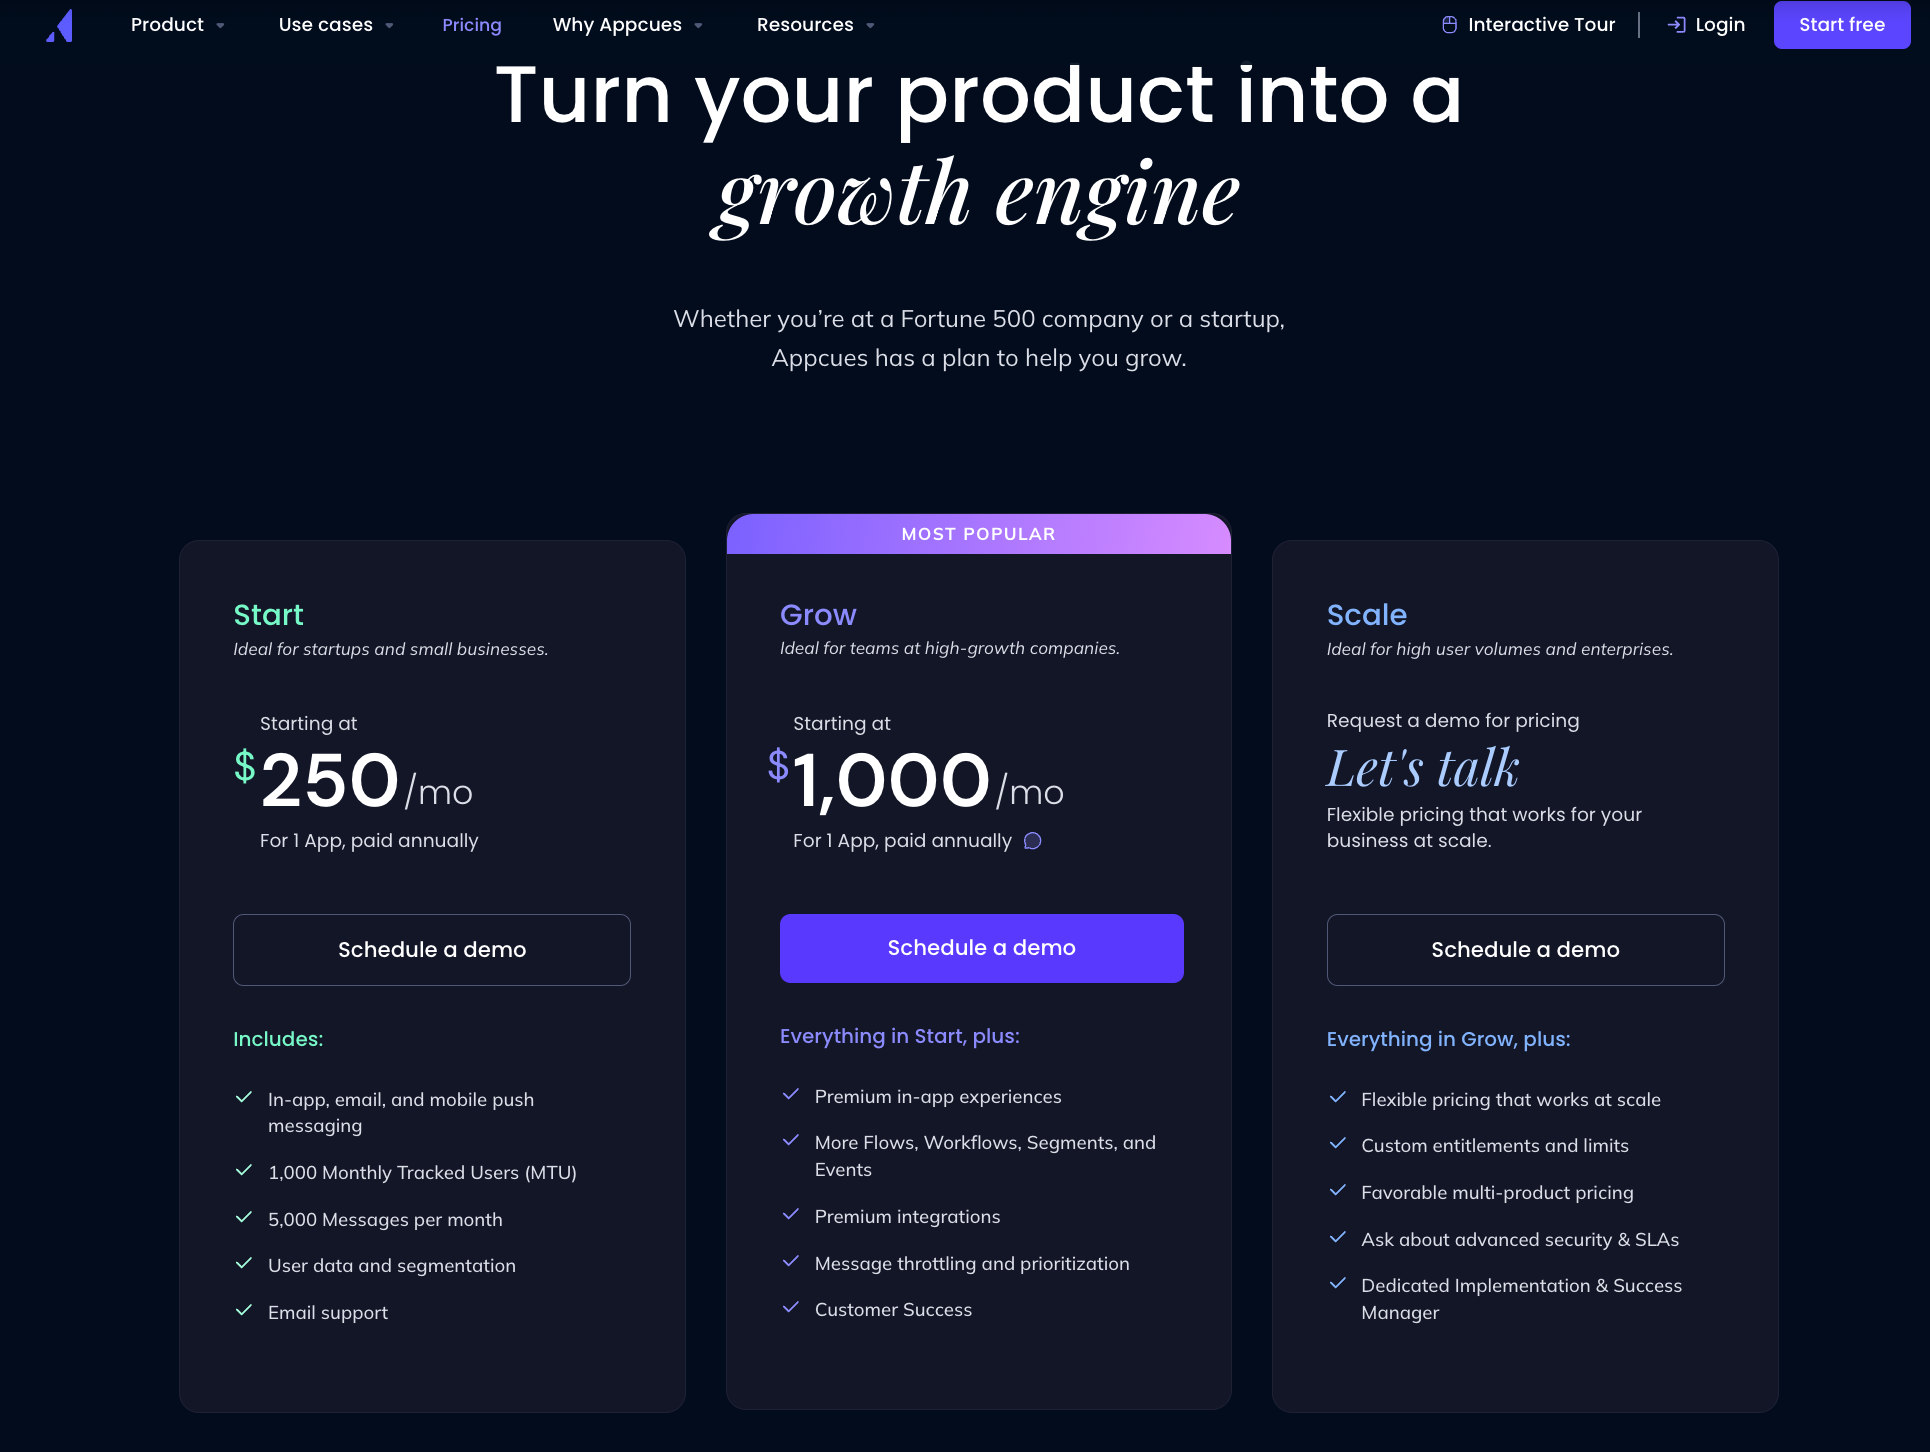
Appcues offers a tiered pricing model, with plans based on Monthly Tracked Users (MTUs) and feature access. The primary plans include:
- Start Plan: Ideal for startups and small businesses, this plan starts at $250 per month for one application, and accommodates up to 1000 MTUs and 5000 messages.
- Grow Plan: Designed for high-growth companies, this plan starts at $1,000 per month for one application. It comes with increased limits on flows, segments, and events, premium integrations, and flow targeting.
- Scale Plan: Tailored for large enterprises with extensive requirements, this plan offers custom pricing. It includes all advanced security options and SLAs, a dedicated implementation manager, and works across multiple products.
While the Start plan costs are similar to other tools in the market. The starting price of the Grow plan is much higher than other platforms with equal or even more powerful features.
Pros of using Appcues as a product adoption platform
✅ Simple setup—get started with Appcues in minutes by adding the SDK to your app’s source code and installing the Chrome extension.
✅ Intuitive user interface.
✅ Extensive customer education resources.
✅ Supports various mobile environments (Native Android, Native iOS, React Native, Flutter, and Iconic).
Cons of using Appcues for product adoption
❌ Lacks advanced analytics for tracking product usage.
❌ No real-time content triggering with server-side events.
❌ Limited feedback collection options.
❌ Only manual localization.
❌ Expensive pricing plans yet limited features.
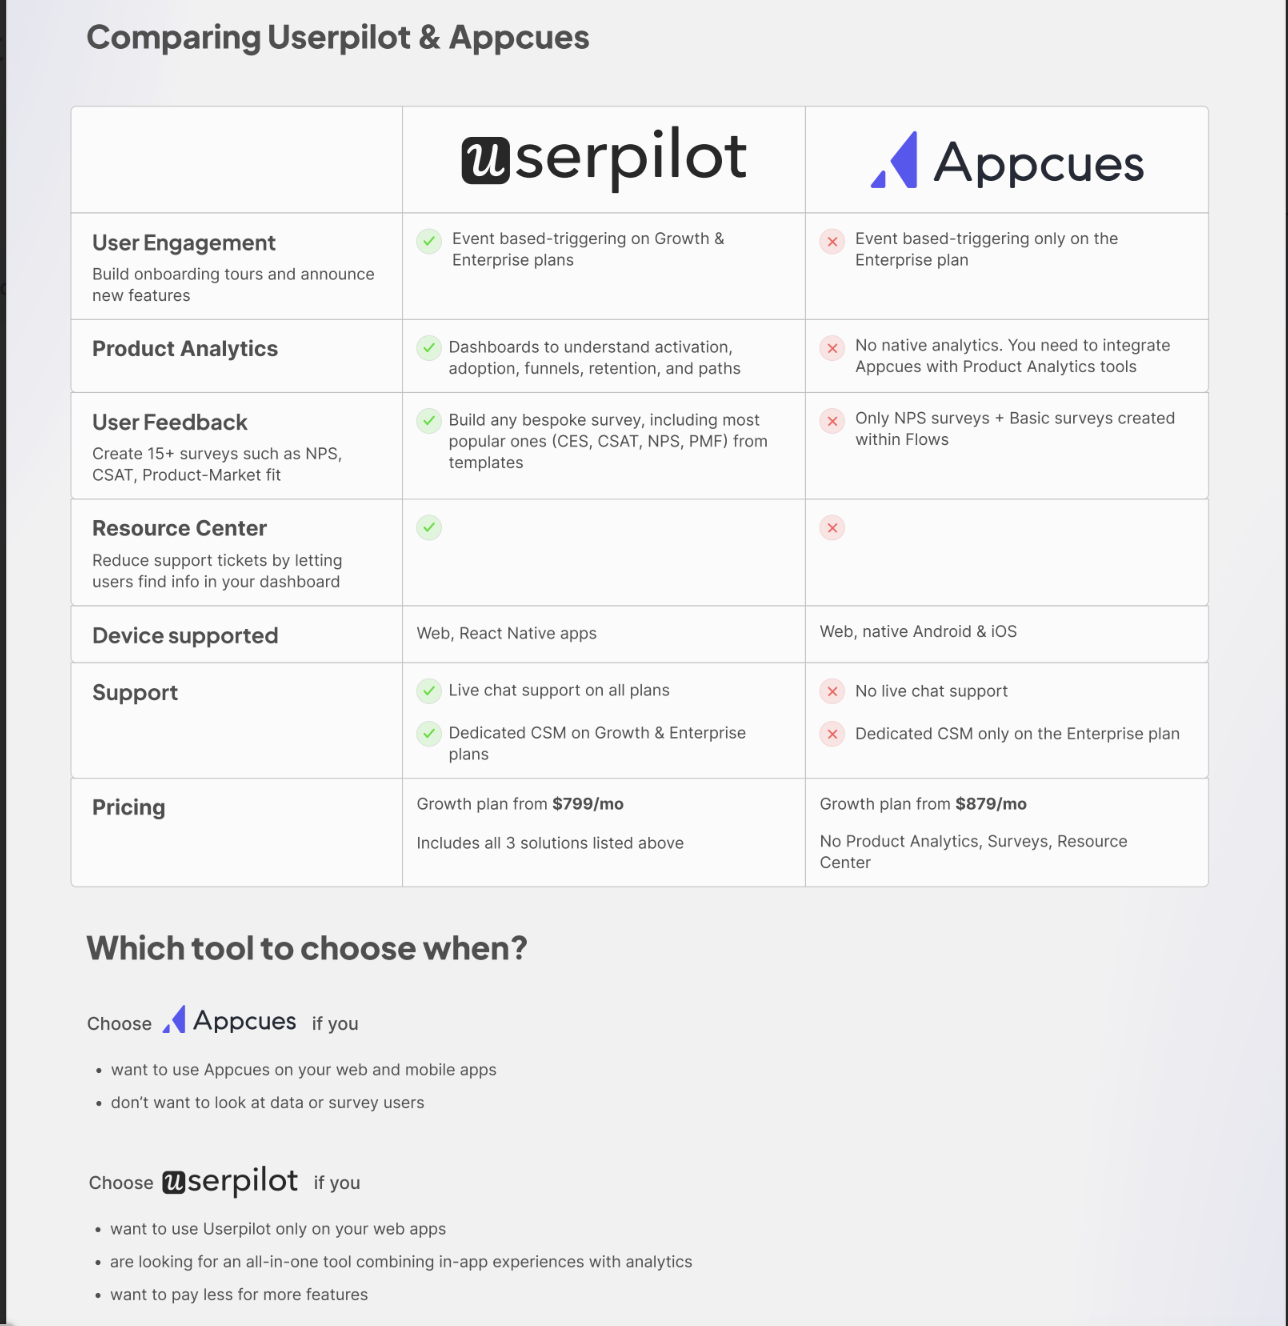
Userpilot: A better alternative to Appcues
Userpilot is an all-in-one product growth platform that helps businesses improve their activation, conversion, and retention rates.
The main difference between Appcues and Userpilit is that while the former is a one-point solution for user engagement, the latter is a robust platform with multiple use cases.
Like Appcues, Userpilot also offers an easy-to-use Chrome extension and multiple UI patterns for building engaging in-app flows.
On top of that, Userpilot offers many exclusive, valuable features, such as:
- Autocapture: Record important user interactions, such as Clicks, Text input changes, and Form submissions, without manually setting each event up for tracking.
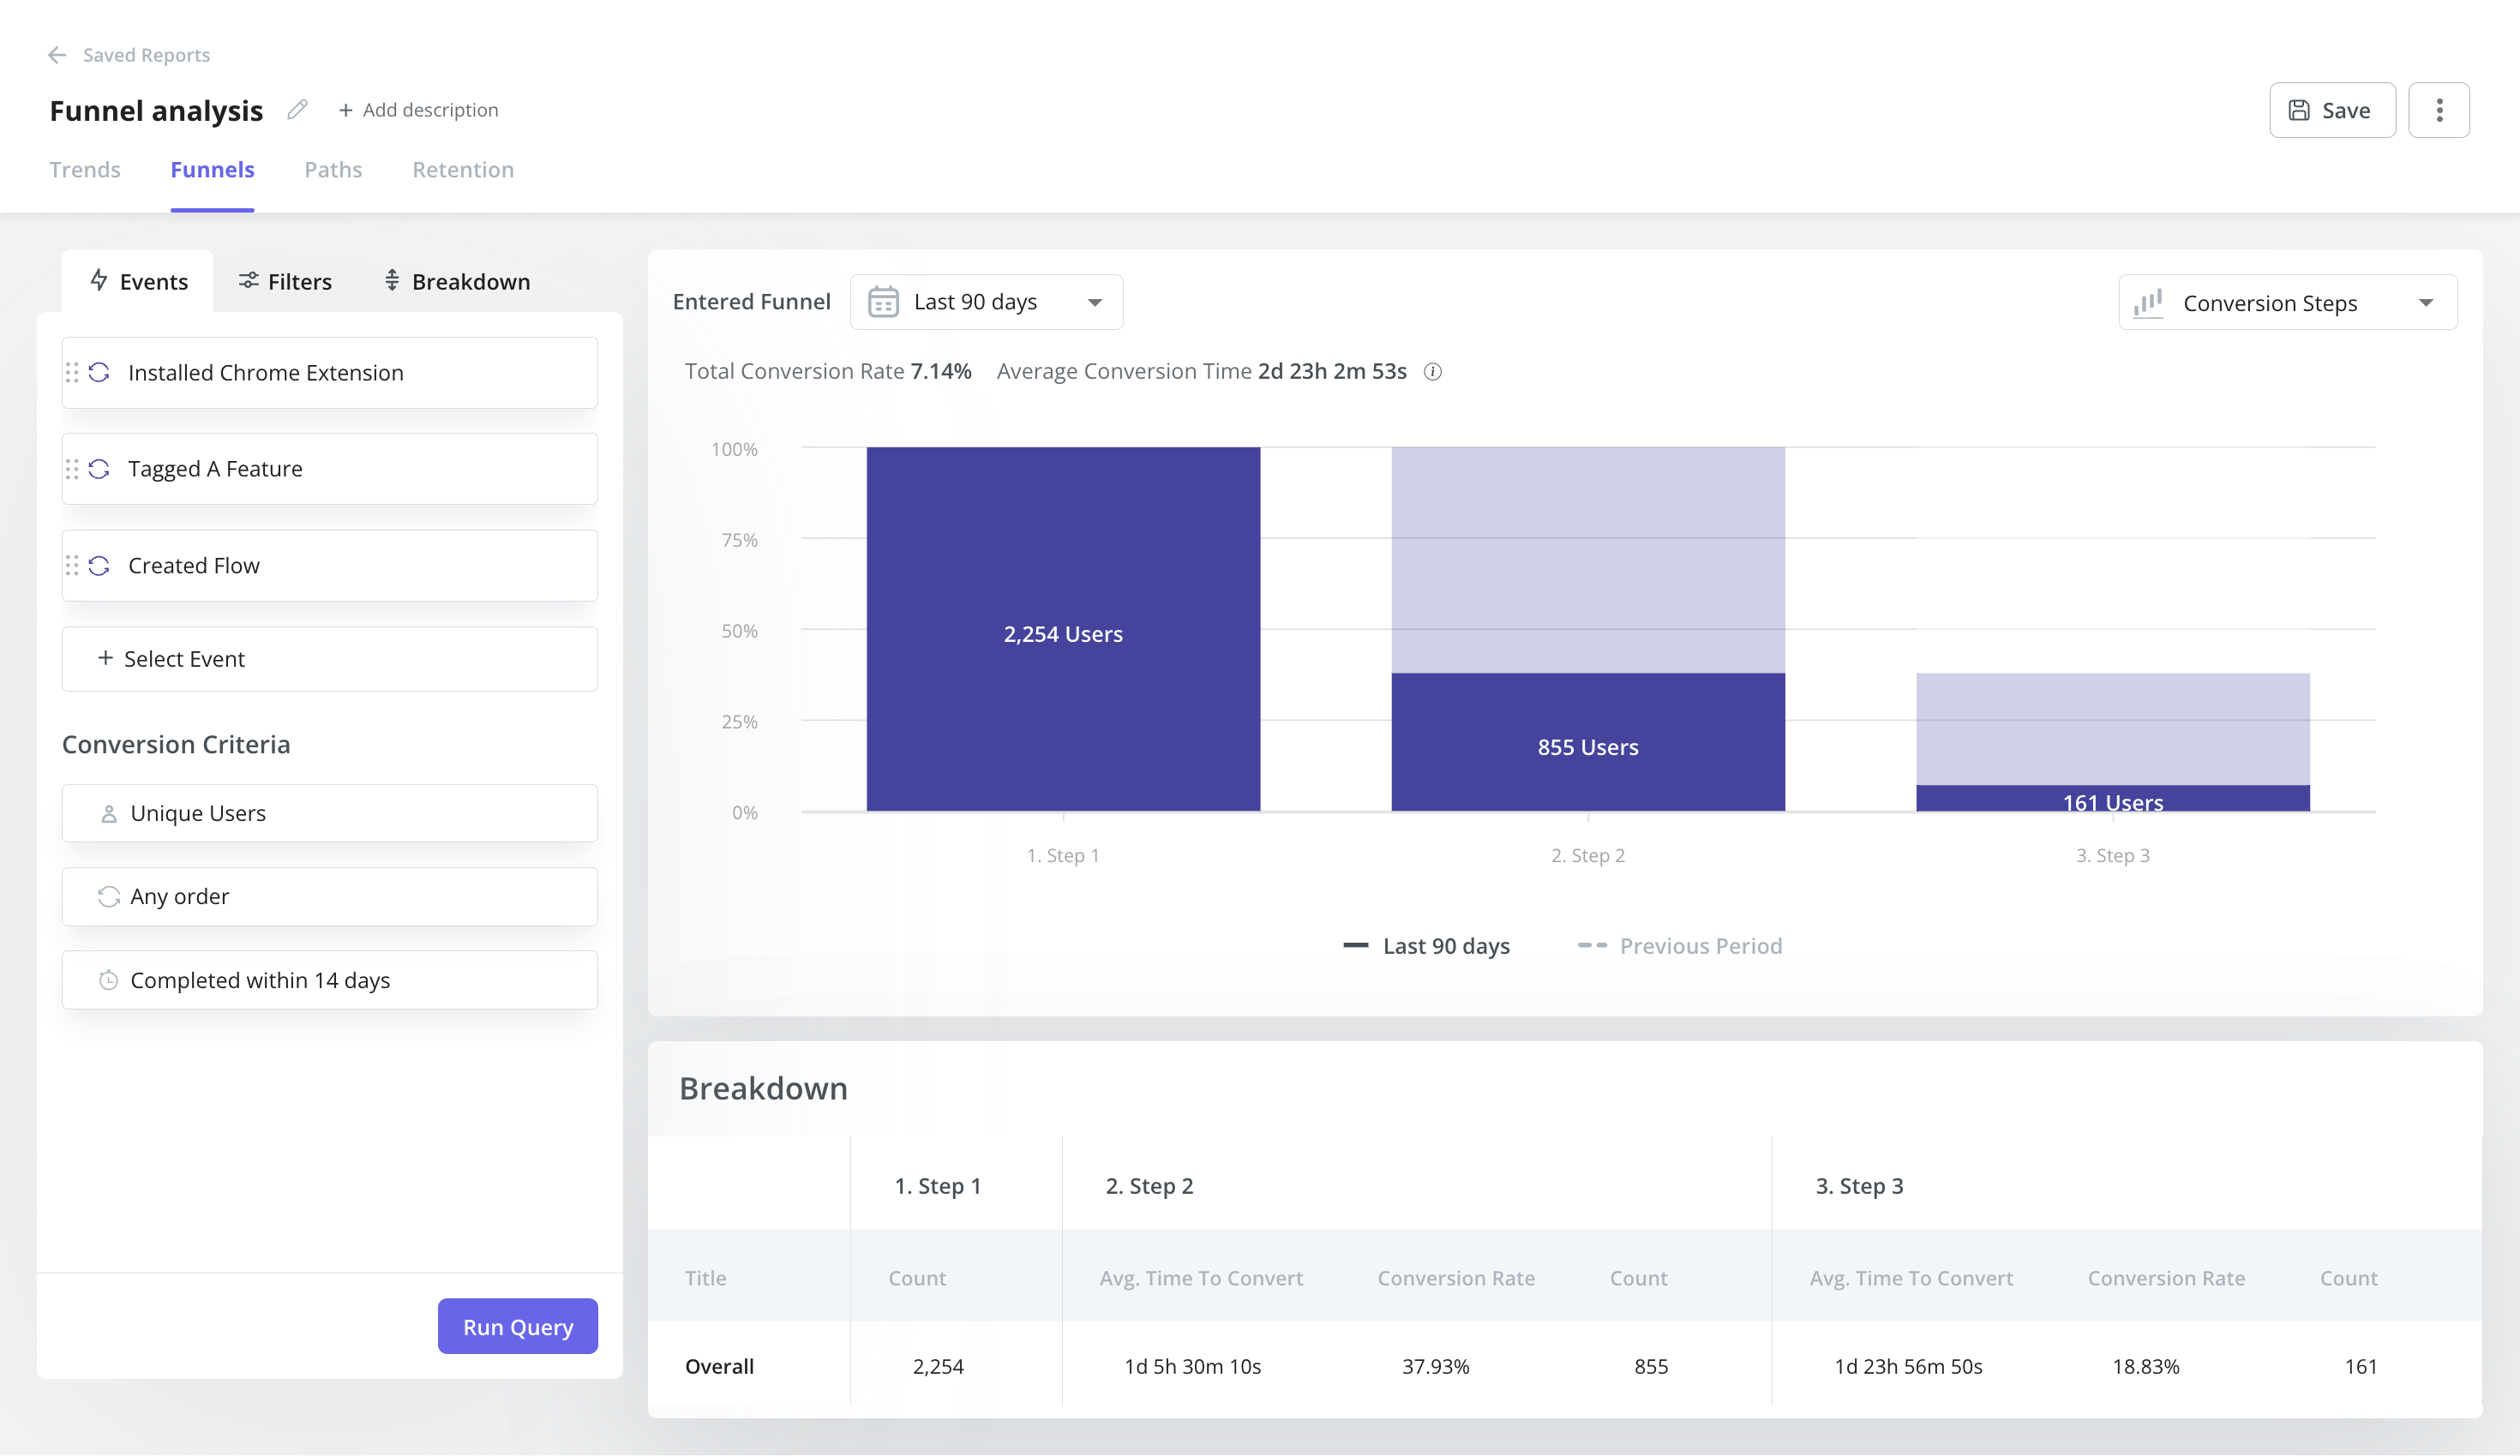
- Analytics reports: Get access to different user behavior analysis visualizations such as path analysis, funnel reports, or cohort tables for and identify friction points.
- Session replays: Userpilot’s session replays allow you to see how users navigate your product. Our platform recreates those steps, including clicks, mouse movements, scrolls, etc., to help you understand why your users make certain choices.
- Multivariate testing: On top of the controlled or head-to-head A/B testing that Appcues offers, you can also run multivariate tests on Userpilot to analyze the performance of various onboarding flows. This lets you compare the performance of each flow variation against having no flows.
- 15+ customizable surveys: With Userpilot, you can access different templates, including NPS, CSAT, CES, and PMF, easily customize the questions and design, and utilize branched logic to collect highly contextual feedback. Once collected, you can visualize survey data in a dedicated survey analytics dashboard.
- NPS response tagging: Userpilot allows you to tag qualitative responses, which in turn allows you to easily identify common themes among detractors and promoters. For instance, you may notice that most detractors have the tag “customer support” attached to them, which means it’s a pressing issue and you need to prioritize improving it.
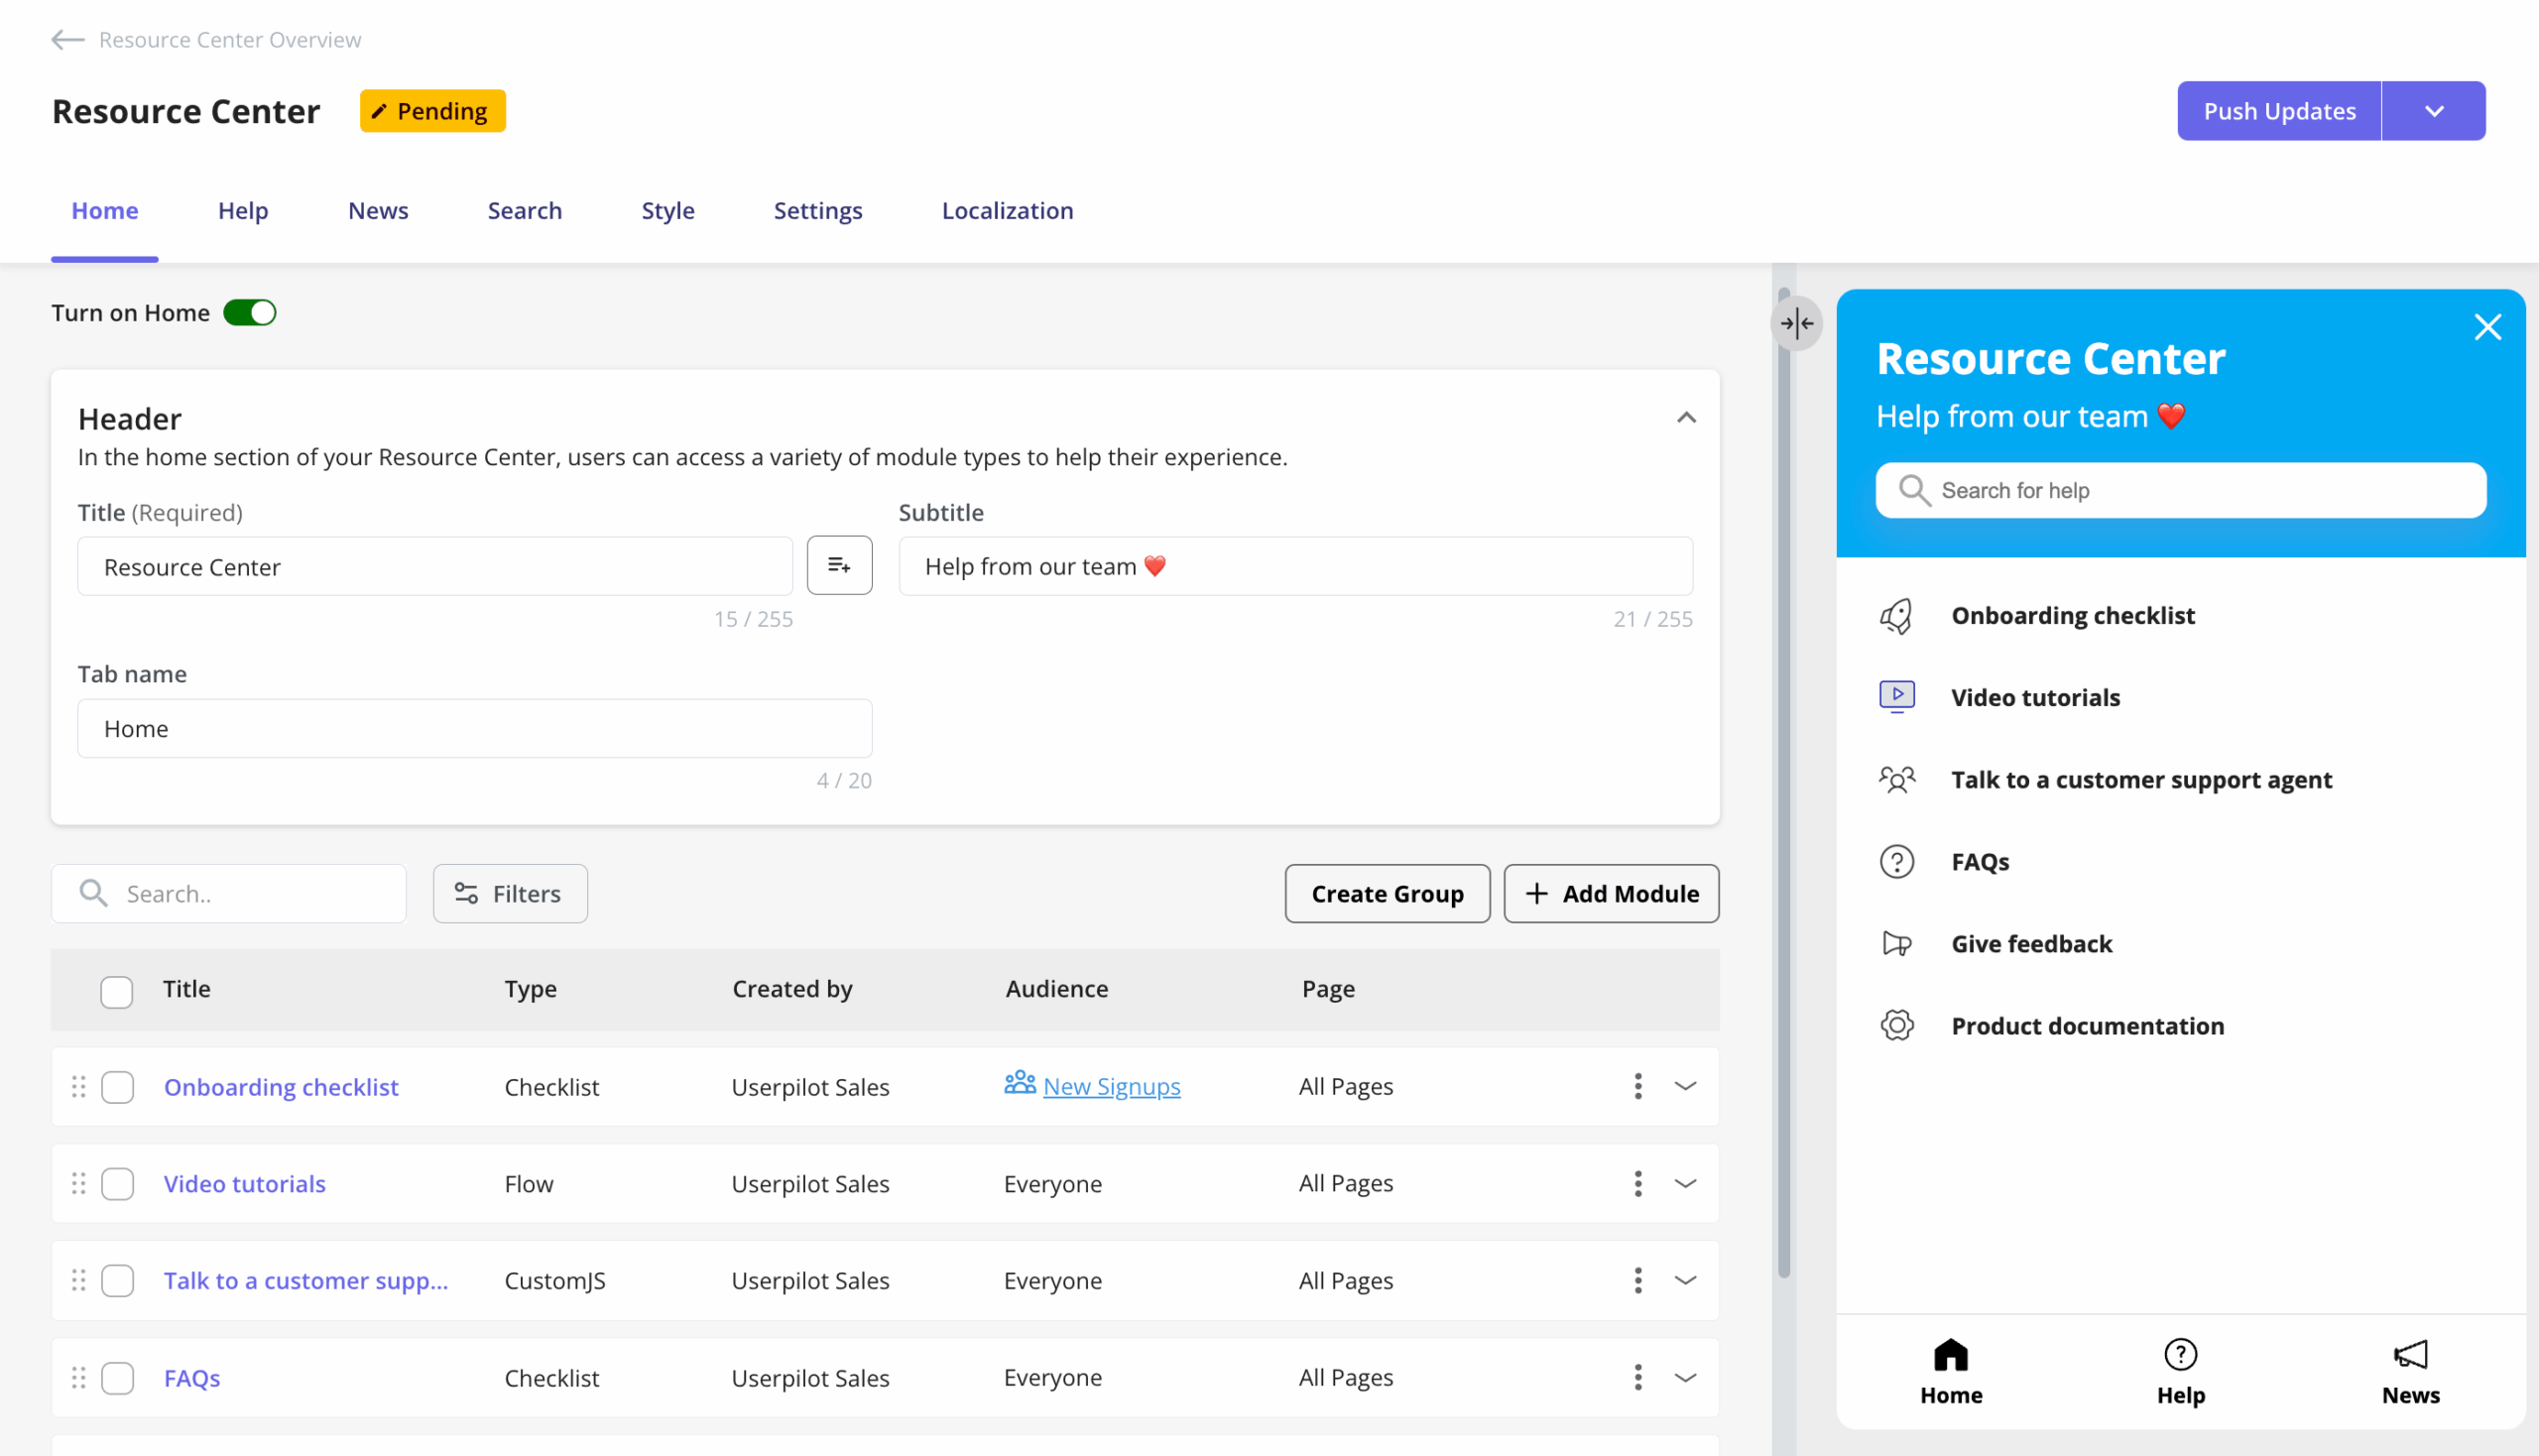
- Robust resource center: Userpilot allows you to add multiple formats of resources to the help center, including flows, checklists, articles, and videos (which you can even play right within the app without being redirected to another platform). Moreover, you can even personalize self-service support by targeting each module to specific user segments or pages.
To sum this up, Appcues is a sound platform for user onboarding and in-app engagement, but some areas fall short.
Userpilot, on the other hand, is a true all-in-one robust product growth platform that serves multiple use cases, including those that Appcues lacks. This includes in-depth product analytics and in-app surveys—all for a better price.
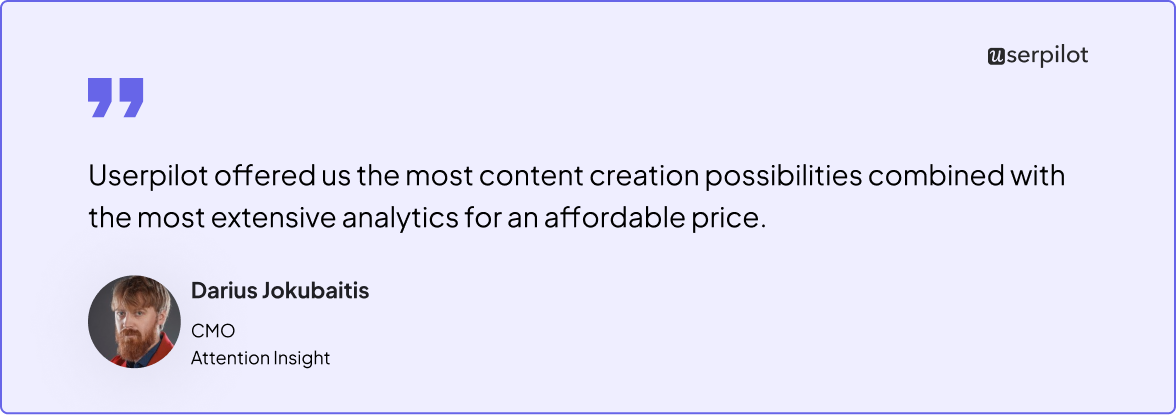
We’re not bluntly making this up. Users choose us because we offer the best combination of features at an affordable price. Here’s a testimonial from our client, Attention Insight, confirming this:
How much does Userpilot cost?
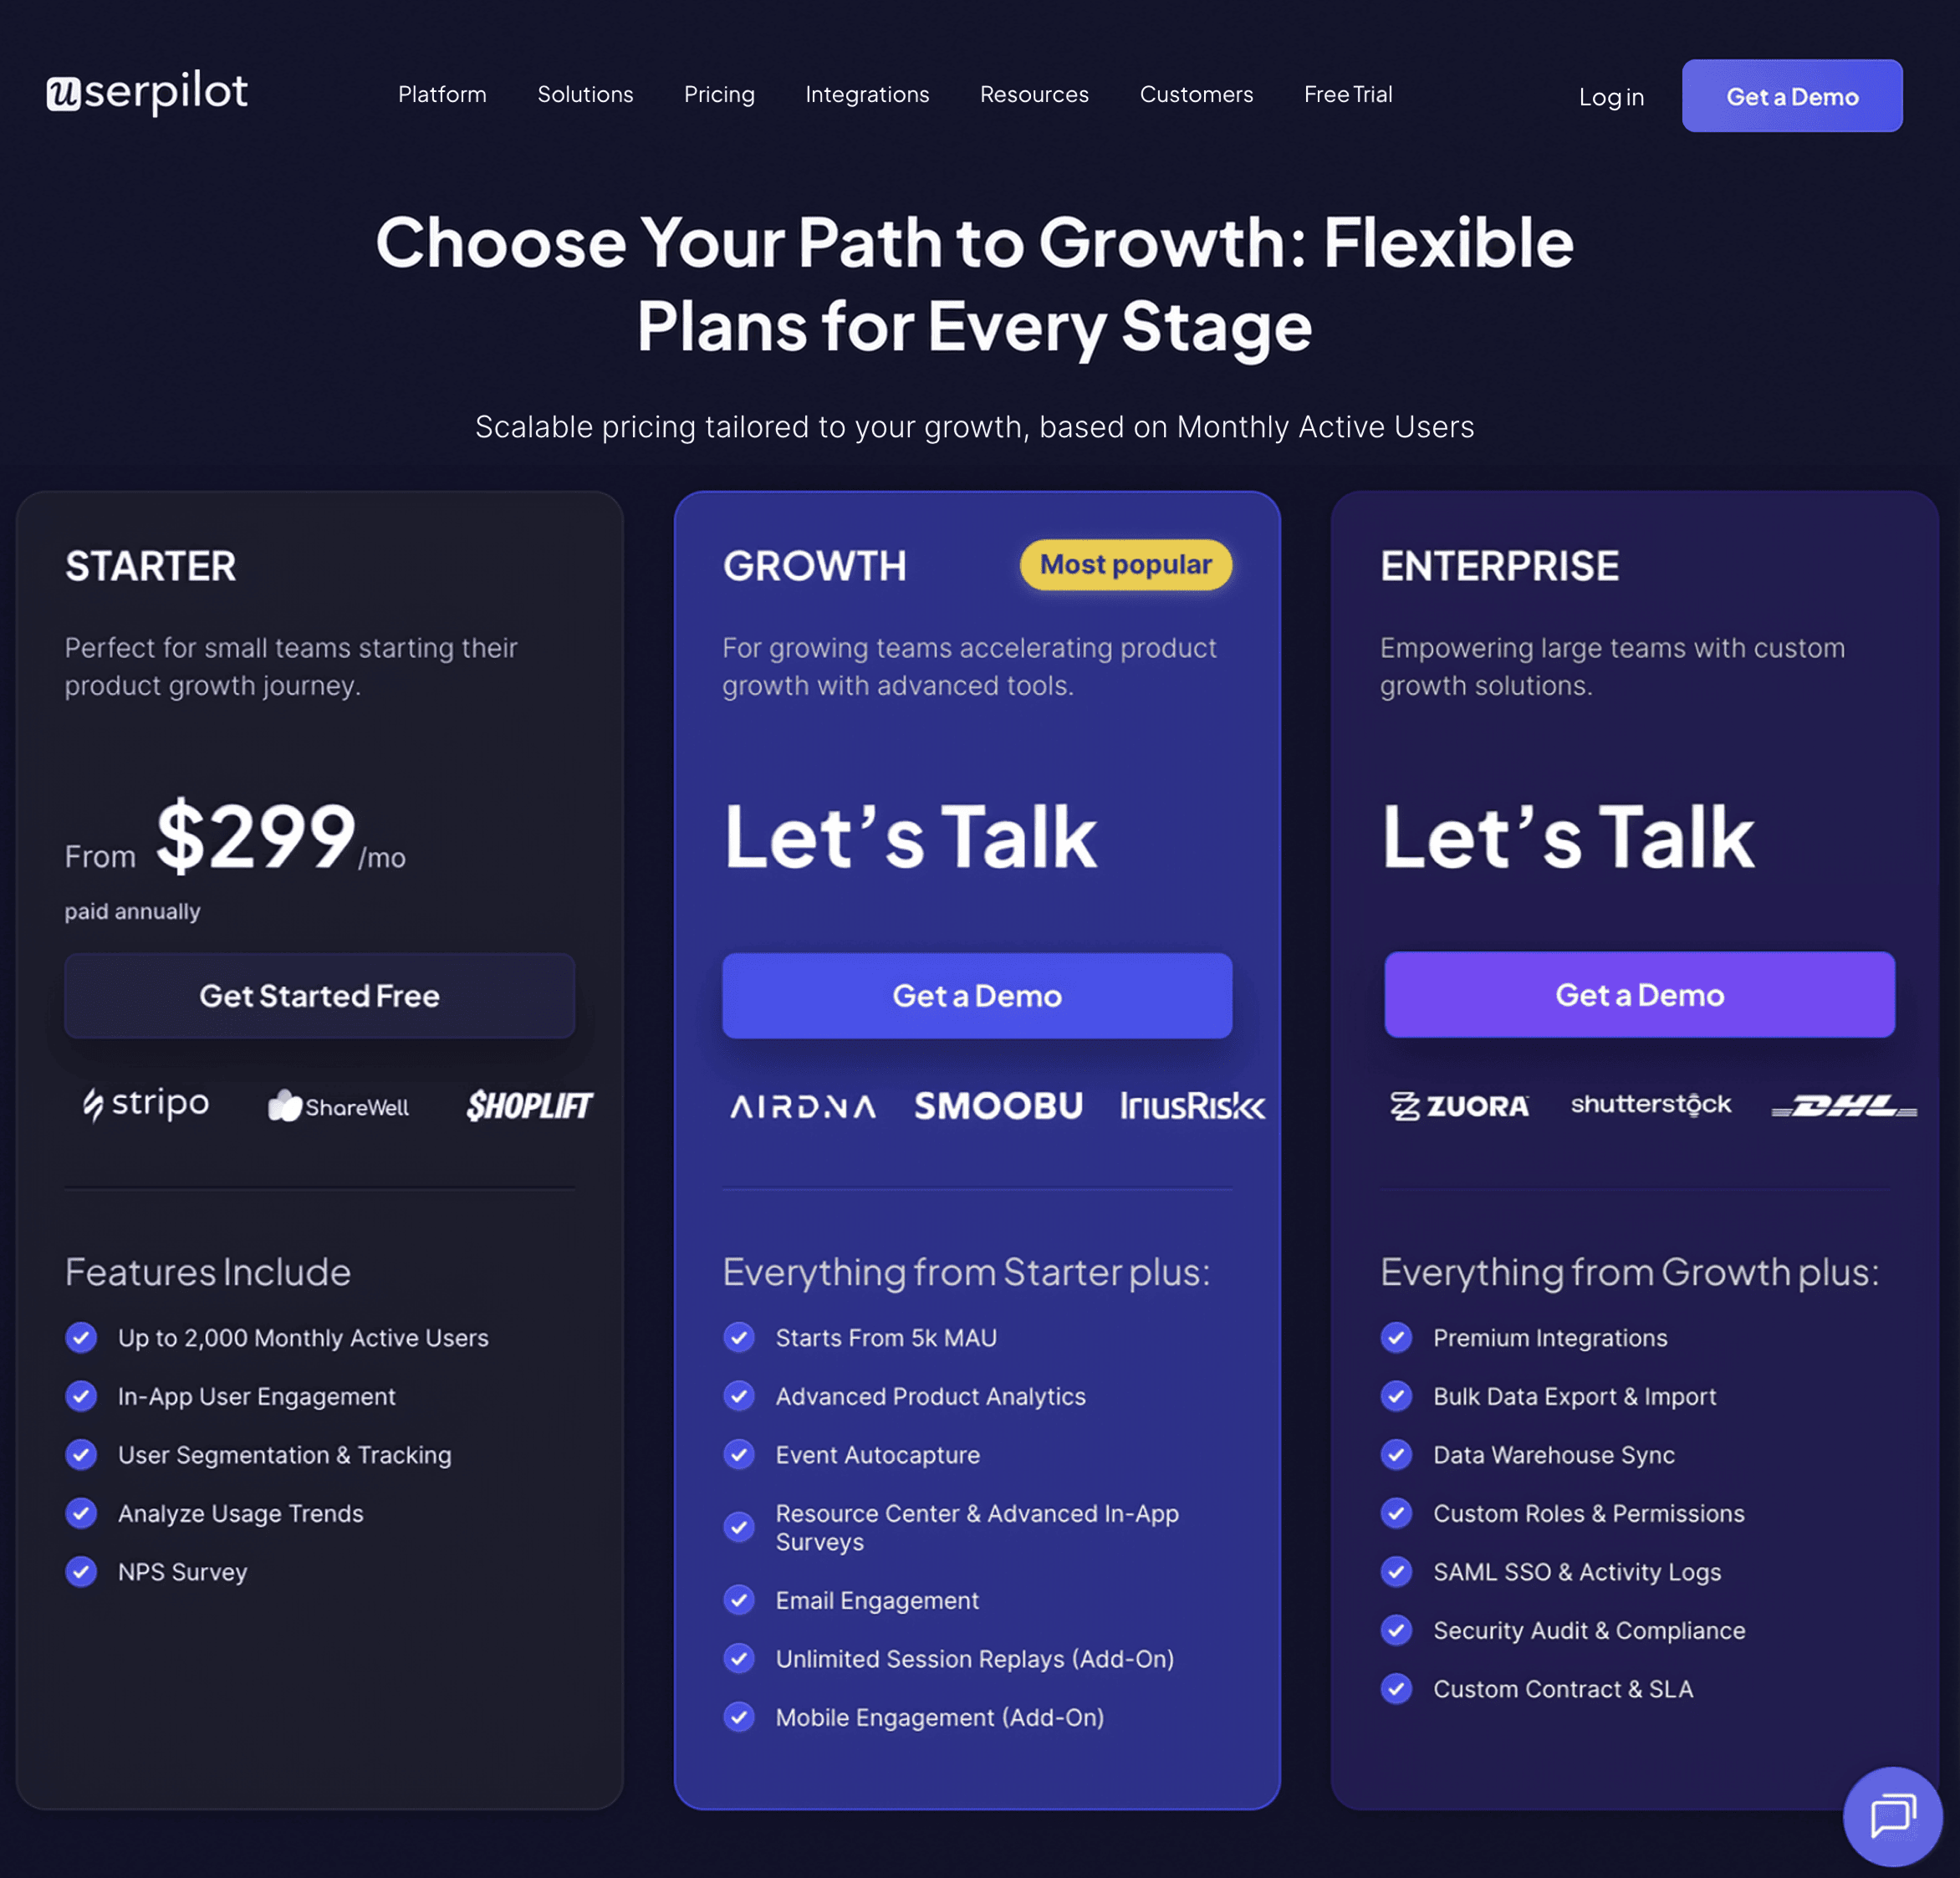
Similar to Appcues, Userpilot has a tiered pricing structure with three 3 plans:
- The Starter Plan is billed annually and costs $299 per month, and is ideal for small teams. It supports up to 2,000 monthly active users and includes access to core features like interactive walkthroughs, user segmentation, trends dashboard, and NPS surveys.
- The Growth Plan offers custom pricing and is designed for scaling teams. It includes all features from the Starter Plan, plus advanced capabilities such as detailed product analytics (including session replays), event-based content triggering, a resource center, and custom CSS.
- The Enterprise Plan offers custom pricing and is aimed at large organizations with specific needs. It encompasses all features from the Growth Plan, along with additional functionalities like custom roles and permissions, premium integrations, SAML 2.0 Single Sign-On (SSO), security audit, and compliance.
Conclusion
Appcues is a pioneer user onboarding platform that many people enjoy and advocate for. Yet, it has some major drawbacks such as limited analytics and surveys, which means you’ll need to invest in additional tools to fuel your product adoption efforts.
If you’re looking for a truly all-in-one product growth platform, Userpilot is your best choice. It offers a more diverse and complete feature set at a more affordable price. Want to learn what Userpilot can do for you? Book a demo.
About the author