GainsightPX for User Engagement Analysis: Features, Pricing, and Review22 min read
Get The Insights!
The fastest way to learn about Product Growth, Management & Trends.
An overview of GainsightPX
- GainsightPX is a good choice for user engagement analysis and it comes with features such as feature tags, in-app events, behavioral analytics, and survey analytics.
- GainsightPX is one of the most prominent product experience platforms in the market. However, it does have its fair share of flaws.
- Here are three main scenarios in which you would be better off choosing a GainsightPX alternative:
- You’re on a budget: GainsightPX isn’t the best option if you don’t have a big budget. While the pricing information is only available on request, it could cost you over $2500/month. This could be quite pricey if you’re on a budget and it’d be best to opt for a platform that’s more affordable.
- You want a more beginner-friendly platform: While GainsightPX does offer some beginner-friendly features like a WYSIWYG editor, it does have a long learning curve. If you have a non-technical background, you’re perhaps better off using a GainsightPX alternative.
- You need more extensive survey features: GainsightPX offers numerous types of surveys, including NPS. It also enables you to create multi-question survey engagements. But if you need more advanced features like behavior-based survey triggers and translations, you should opt for other platforms.
- If you’re looking for a better option for user engagement analysis, Userpilot exceeds both functionality and value for money compared to GainsightPX
- Ready to see Userpilot in action? Schedule a demo today to explore its powerful user engagement analysis capabilities firsthand.
What is GainsightPX?
GainsightPX is a powerful product experience platform that helps you gather insights into how users interact with your software or app.
The tool provides advanced enterprise-grade product analytics, native omnichannel engagement features to drive customer engagement, and closed-loop feedback with surveys to gauge your user experience. From NPS surveys to real-time data, GainsightPX has it all.
Must have features of user engagement analysis tools
Here are some must-have features that you should look for when considering a user engagement tool:
- Have different UI patterns such as checklists, modals, tooltips, banners, and hotspots – so you can build interactive in-app experiences to drive engagement.
- Options to offer in-app support by creating a resource center so you can provide users with easy access to help articles, tutorials, and FAQs.
- Advanced segmentation features that allow you to filter customers based on product usage, in-app behavior, user feedback, etc. – so you can trigger flows or send hyper-personalized messages.
- A/B test for driving engagement that helps you identify what change is necessary to improve user experiences and increase conversion.
- User survey features for you to collect insights on user engagement and satisfaction – so you can improve your product offerings.
- Product analytics feature for engagement data visualization which enables you to track and act on user behavior data.
GainsightPX features for user engagement analysis
GainsightPX offers several options to track and analyze user behavior. Whether you’re looking to improve user onboarding, test new features, or maximize user activation, these user behavior insights come in handy.
Here are a few different ways to monitor user behavior with GainsightPX:
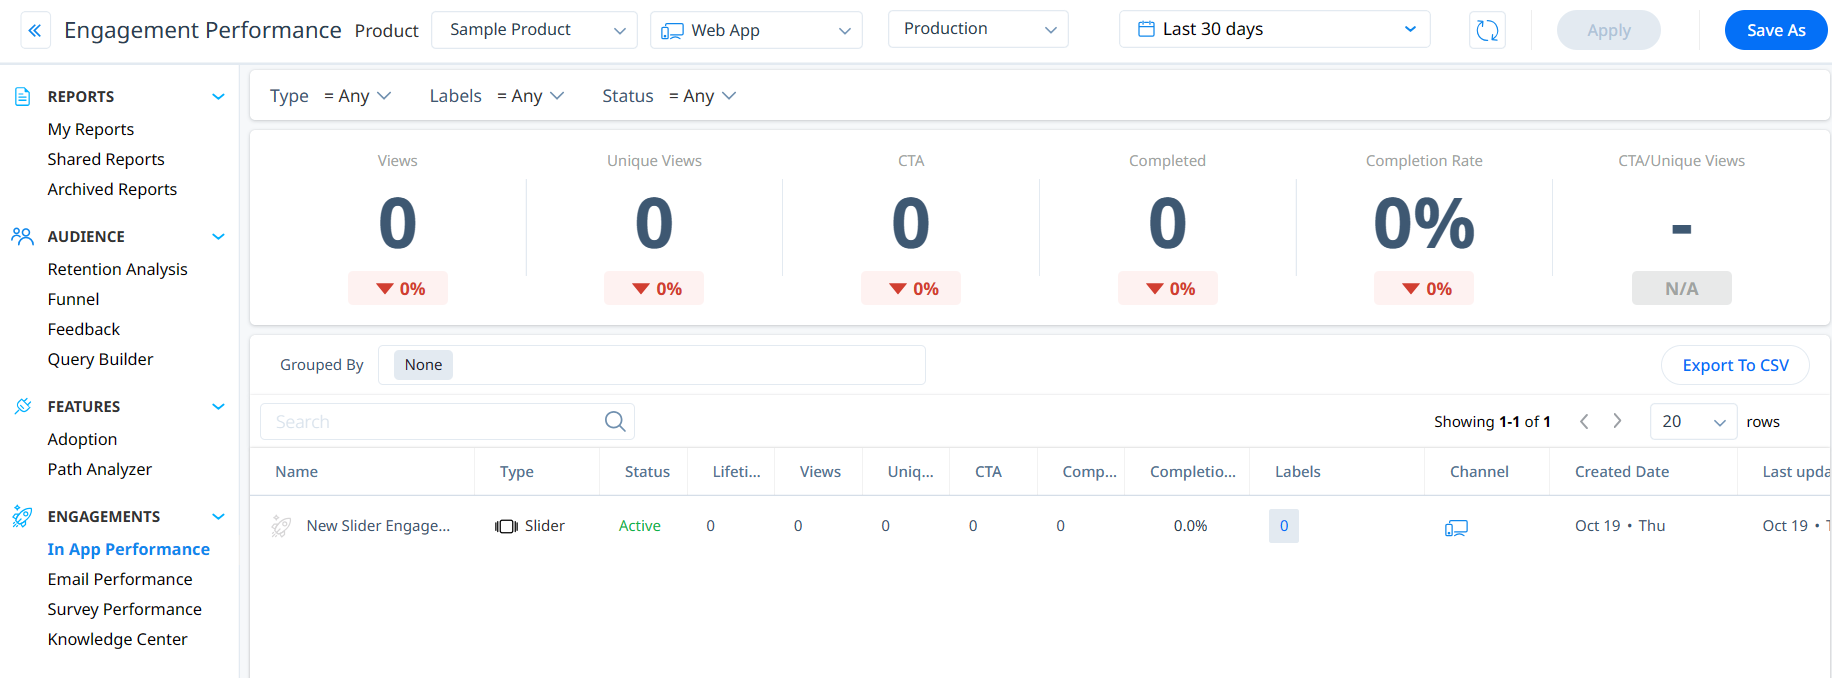
- You can monitor the performance of different in-app experiences, such as guides, tooltips, sliders, etc., to understand how users engage with them. Metrics like views, CTA clicks, and completion rates are worth tracking here. You can even target different user segments with similar in-app experiences to understand how their behavior varies based on shared attributes or demographics.
Engagement performance. - Similarly, you can track the performance of email campaigns, in-app surveys, and knowledge center bots. These reports will help you build a complete picture of user sentiment and friction points in your user experience.
- You can also use other features like funnel analysis and path analysis to understand how users move through your product and what drives some of them away. Additionally, you can perform retention analysis to monitor user retention rates over a given period.
GainsightPX’s feature tags
If you want to improve feature adoption, you must monitor how users are engaging with it. It’ll help you understand whether a feature has hit the right chord with users. Also, you can identify features that users struggle with or don’t find particularly helpful.
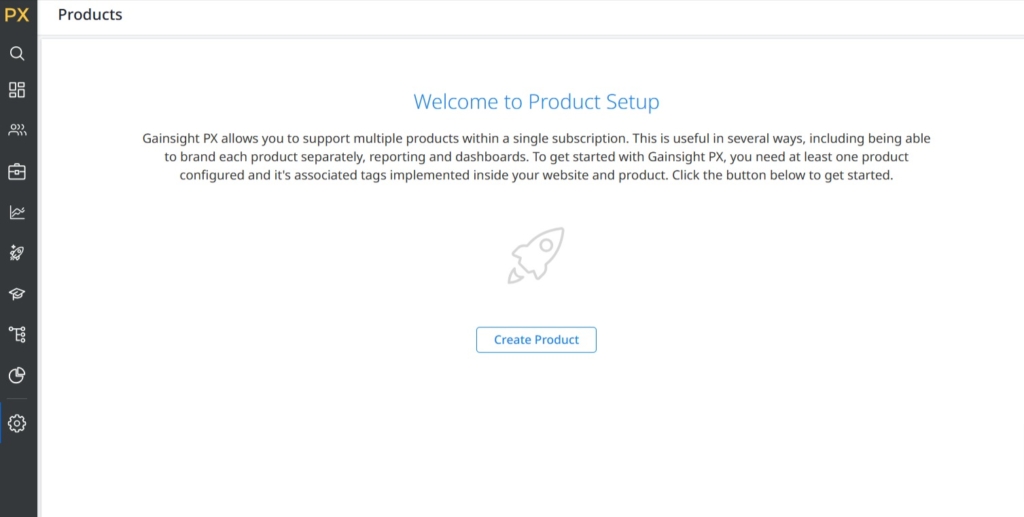
With GainsightPX, you can let the platform automatically scan your product and tag relevant features. It’ll also create a hierarchy of available features and tag new features as your product grows. All you have to do is install its Javascript code in your product and enable suggestion mode from Product Mapper. Alternatively, you have the option to tag features manually.
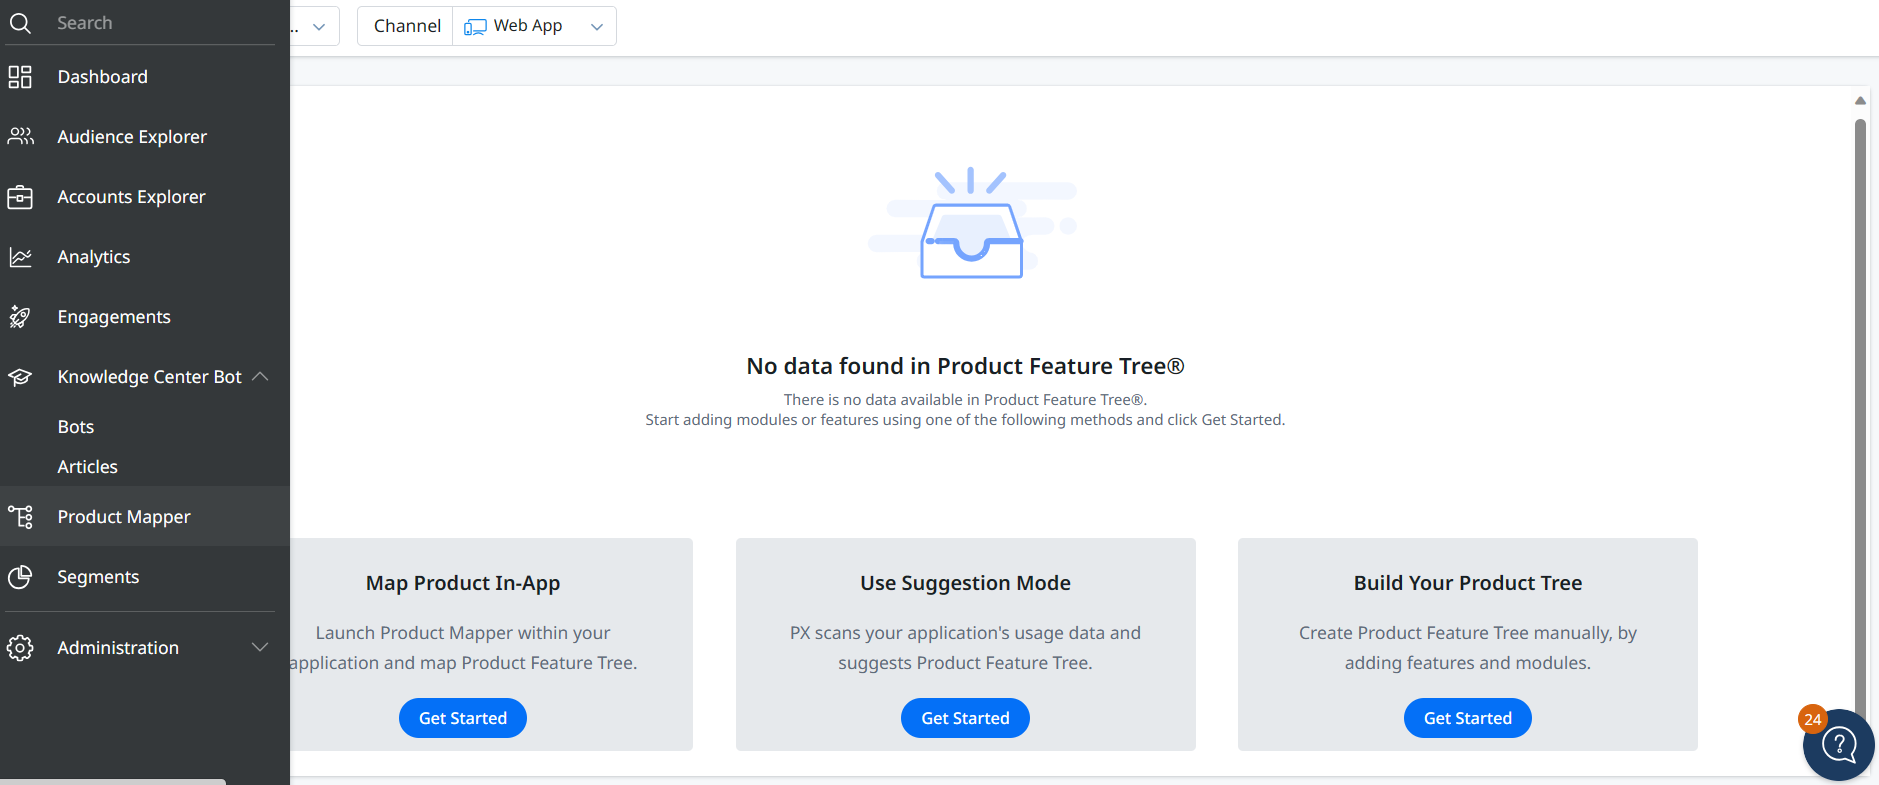
Once you’ve tagged the relevant features, you can measure usage and adoption through GainsightPX. Here’s how:
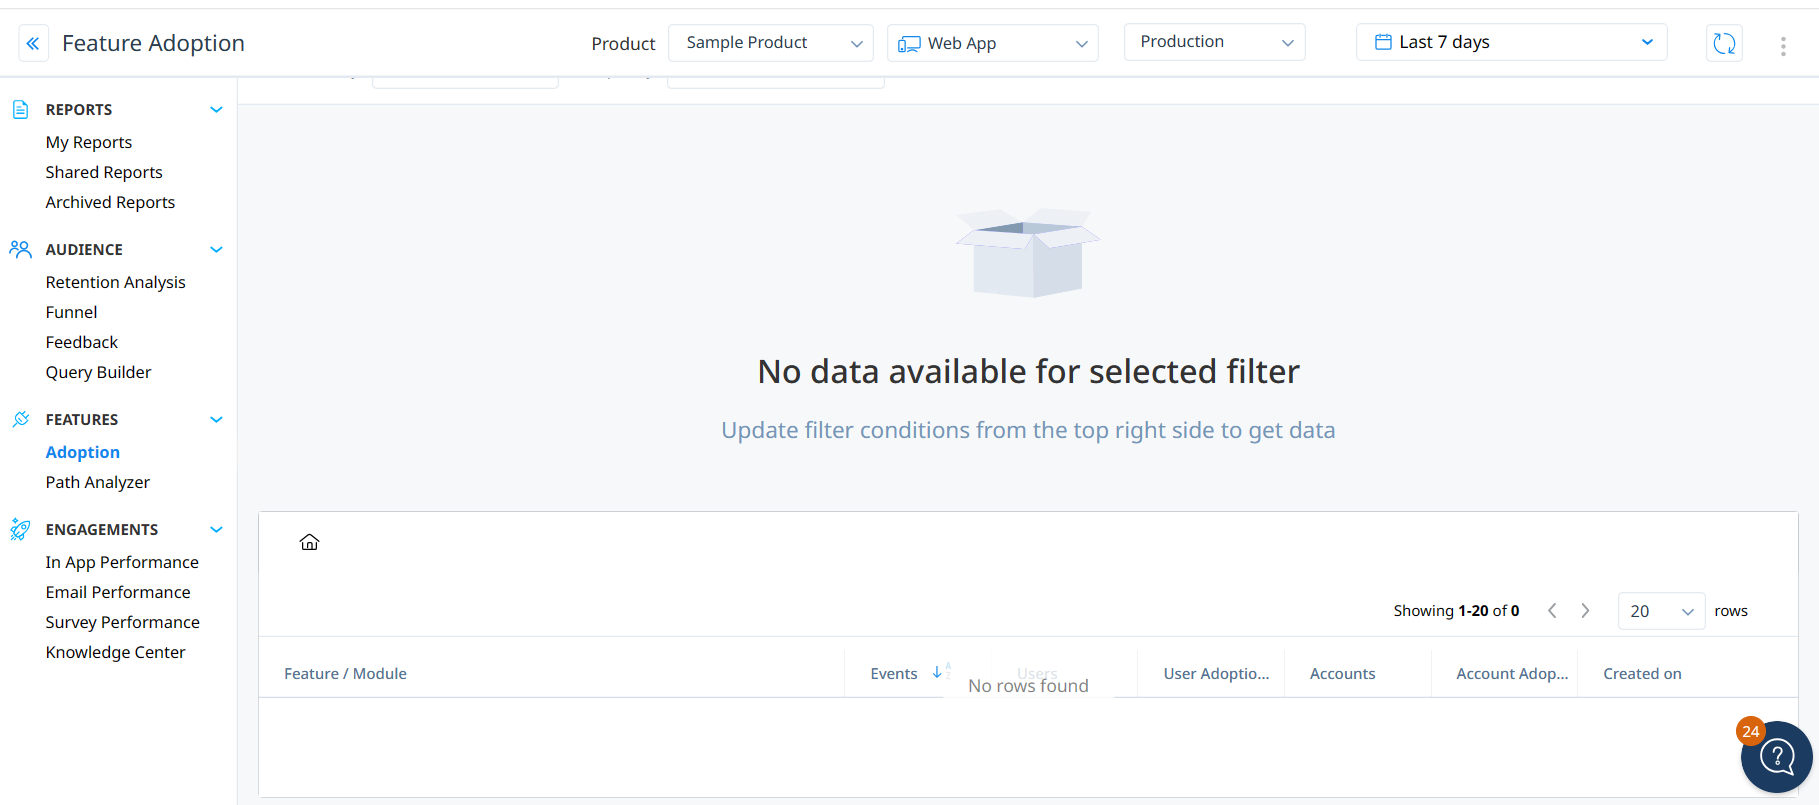
- The Adoption option under the Features dropdown menu gives you access to detailed data about the number of users/accounts that have adopted a particular feature.
Adoption analytics. - You can filter the data by date range to understand how feature usage has evolved over time. Also, you can use the refresh icon to view the latest data.
- Besides the Adoption report, you can also create feature walkthroughs in Engagements and monitor their performance to get an idea of feature usage. Similarly, you can build feature adoption funnels and monitor completion rates to identify features that drive stickiness.
GainsightPX’s in-app events
When you install the GainsightPX code snippet on your product, it automatically starts tracking various events, such as page loads, sessions, link clicks, and button clicks. Monitoring and analyzing data from these events can help you assess product usage better.
Additionally, you can set up and track custom events to monitor more specific user actions, such as when they use the in-app search functionality. Here’s how you can track in-app events:
- Use the Analytics section to track various metrics related to in-app events like page loads, sessions, and more.
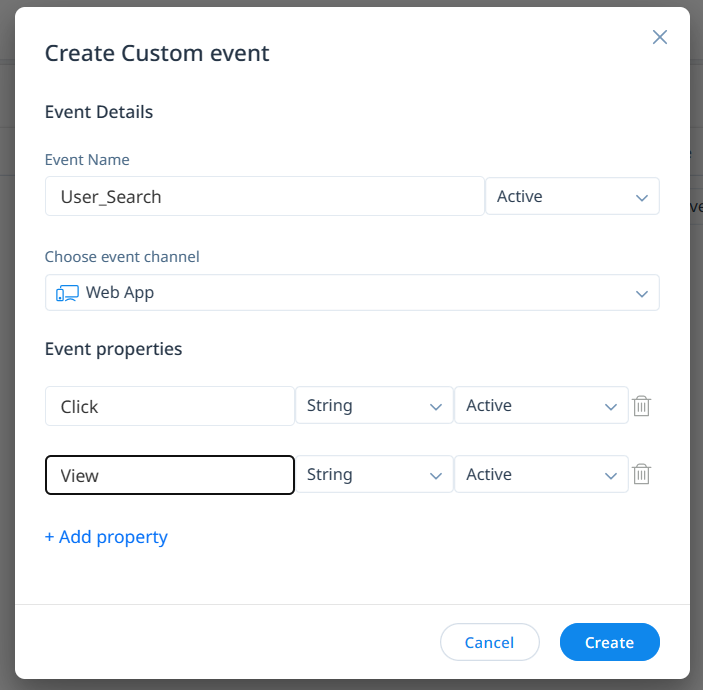
- Creating and tracking a custom event isn’t as straightforward on GainsightPX, though. While it offers a simple builder to help you get started, things get complicated later on. You can easily configure the initial settings of your custom event. GainsightPX also gives you control over the event’s status so you can instruct the platform when to collect and store the event data.
Create custom event. - You will, however, need to create Javascript calls from relevant locations in your product to activate the event. It requires some knowledge of coding and may not be suitable for users from non-technical backgrounds. If you’re looking for a code-free way to track custom events, consider using a tool like Userpilot.
- That said, once you’ve created an event and set up the required Javascript calls, you can use it to trigger in-app engagements and monitor their performance. You can also use these events to build conversion funnels.
GainsightPX’s behavioral analytics
GainsightPX offers several options to track and analyze user behavior. Whether you’re looking to improve user onboarding, test new features, or maximize user activation, these user behavior insights come in handy.
Here are a few different ways to monitor user behavior with GainsightPX:
- You can monitor the performance of different in-app experiences, such as guides, tooltips, sliders, etc., to understand how users engage with them. Metrics like views, CTA clicks, and completion rates are worth tracking here. You can even target different user segments with similar in-app experiences to understand how their behavior varies based on shared attributes or demographics.
Engagement performance. - Similarly, you can track the performance of email campaigns, in-app surveys, and knowledge center bots. These reports will help you build a complete picture of user sentiment and friction points in your user experience.
- You can also use other features like funnel analysis and path analysis to understand how users move through your product and what drives some of them away. Additionally, you can perform retention analysis to monitor user retention rates over a given period.
GainsightPX’s survey analytics
In-app surveys play a crucial role in helping you collect user feedback, preempt customer churn, and improve your product. They can help you understand whether your product development and marketing efforts are yielding the desired results. Additionally, they tend to garner better response rates than email surveys.
With GainsightPX, you can implement different types of surveys, including NPS (Net Promoter Score) and CES (Customer Effort Score) surveys. You can choose from different types of pre-built survey templates and even create surveys with Boolean (yes/no) and multiple-choice questions.
The good thing is that you can also monitor and analyze survey results on GainsightPX. Here’s how GainsightPX enables you to see survey metrics:
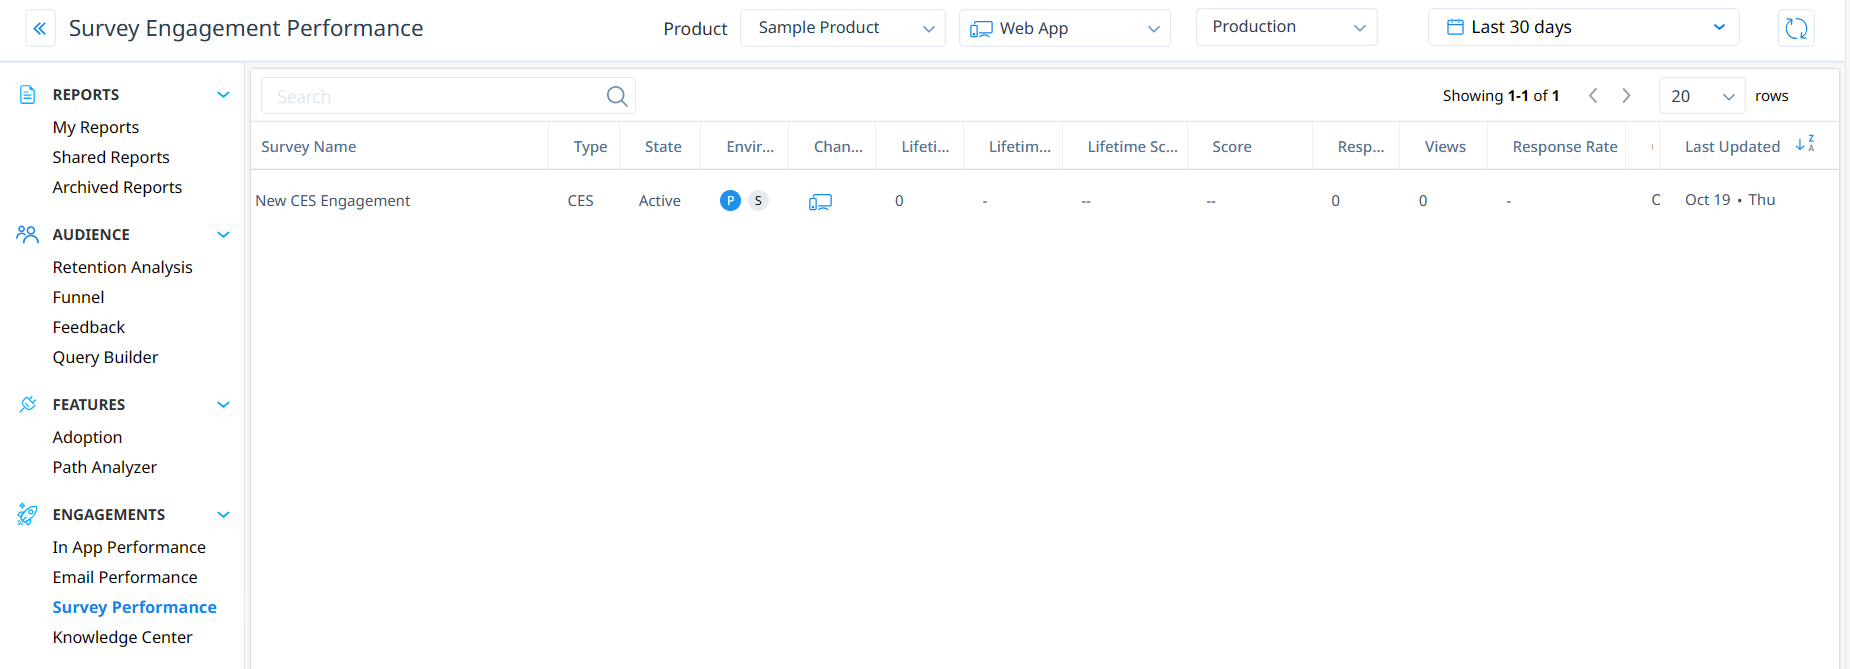
- GainsightPX will show you various metrics, such as scores, response rates, and views, to give you an idea of how individual surveys are performing. You can find these in the Survey Performance section in Analytics. It’ll help you understand whether you need to modify audience targeting or trigger the survey after specific actions to improve response rates.
Survey analytics.
You can filter the results based on the date range and sort the list based on when the surveys were last updated.
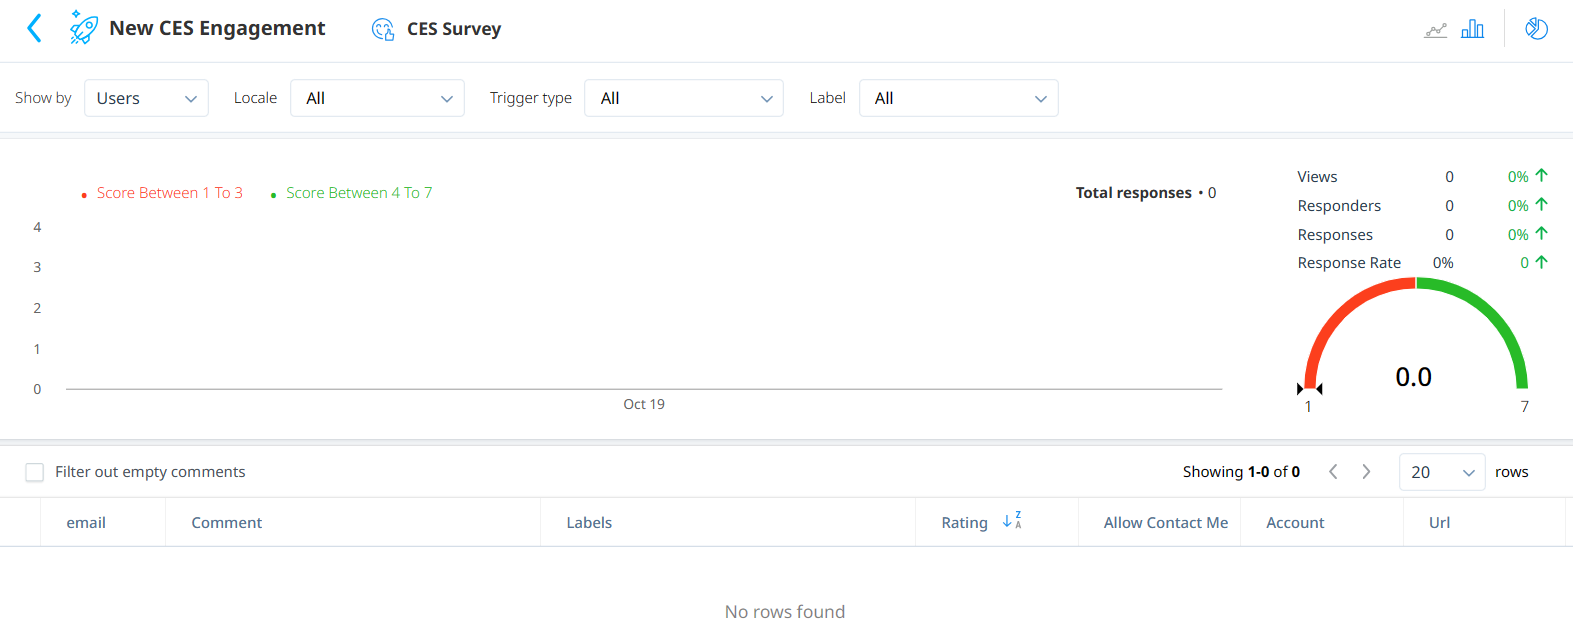
- It’s also possible to view individual survey responses. GainsightPX allows you to switch between line charts and bar charts according to your preference. You also get a pie chart view for a quick summary of the results.
Survey chart. - You also have the option to filter the responses by date, labels, and trigger types. Additionally, you can set custom filters for more granular analysis and export the results into a .csv file.
It’s worth mentioning here that GainsightPX only offers basic survey analytics. You don’t have the option to tag qualitative responses or use them to trigger in-app experiences. If you’re looking for such advanced features, a tool like Userpilot might be a better fit.
What are the pros and cons of GainsightPX?
GainsightPX’s pros
As a prominent product experience platform, GainsightPX offers several valuable features that can help you elevate your user experience. Let’s see why it stands out.
- Powerful segmentation: GainsightPX excels when it comes to segmentation. You can easily segment your audience into groups based on behavior, demographics, and other parameters to personalize their experience.
- Beginner-friendly: You have a WYSIWYG editor that helps you build product tours, in-app guides, and other UI elements that can help you engage your users and improve their experience. The ease of creating these makes the platform great for non-technical users.
- Powerful analytics: GainsightPX offers built-in analytics features that help you track key user engagement and behavior metrics. You can easily find trends and understand your customers better through the platform to elevate their experience further.
- Knowledge center: You can elevate user experience by leveraging the knowledge center bot offered by GainsightPX. It guides users on how to use your product by providing all the necessary links needed (including external ones). This, paired with knowledge center articles, makes for a great user experience.
- Easy feedback collection: GainsightPX makes it simple to create feedback surveys with multiple question types to gauge user requirements and feedback. You can create NPS, CES, Boolean, and numerous other types of surveys.
GainsightPX’s cons
While GainsightPX provides powerful product experience features, there are a few areas where it lags behind. Let’s take a look at them in detail.
- Long learning curve – GainsightPX offers some beginner-friendly features, but you need to spend some time using the tool before you can get the hang of it. The steep learning curve can make it difficult for beginners to use the platform to its fullest.
- Basic analytics – While the analytics feature offered by GainsightPX is powerful, it can get difficult to drill deeper into the data due to the numerous dashboards and widgets. It lacks predictive analytics features too.
- Limited integrations – GainsightPX offers a handful of integrations with third-party platforms. This makes it difficult to simplify workflow with your existing tech stack. It’d help if the number of integrations could be increased.
- In-app screen recording – GainsightPX doesn’t have an in-app screen recording feature that can help you see how users interact with your product. This feature could, otherwise, come in handy to understand how to elevate the user experience.
What do users say about GainsightPX?
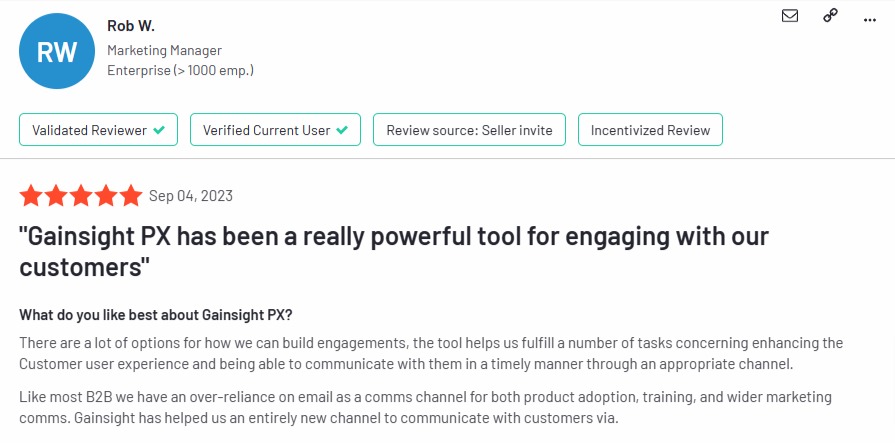
GainsightPX has a great rating of 4.4 stars (out of 5) on G2. It also has a rating of 4 (out of 5) on Capterra. Users mostly praise how the platform offers numerous options for building engagements and understanding user behavior.
Here’s what a GainsightPX user had to say:
“GainsightPX has been a really powerful tool for engaging with our customers” There are a lot of options for how we can build engagements, the tool helps us fulfill a number of tasks concerning enhancing the Customer user experience and being able to communicate with them in a timely manner through an appropriate channel. Like most B2B we have an over-reliance on email as a comms channel for both product adoption, training, and wider marketing comms. Gainsight has helped us an entirely new channel to communicate with customers via. Rob W., Marketing Manager (Enterprise)
Here’s what one of the users had to say:
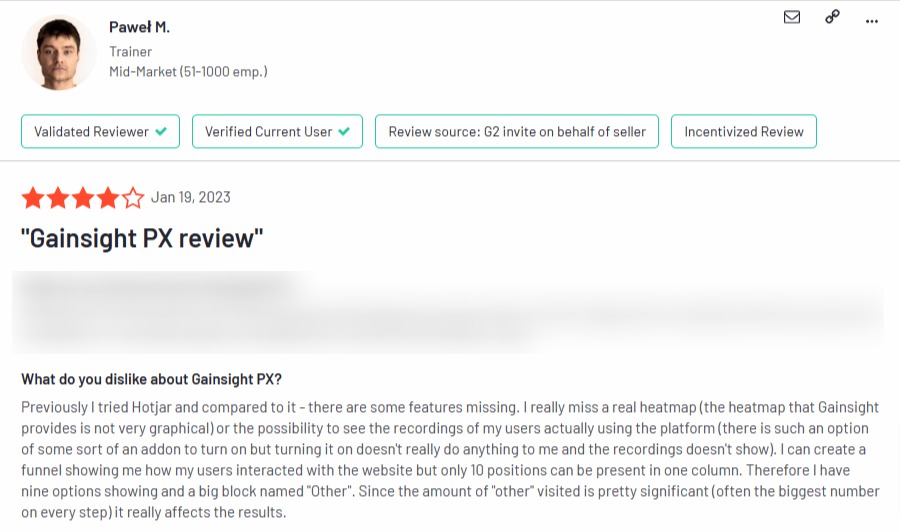
Previously I tried Hotjar and compared to it – there are some features missing. I really miss a real heatmap (the heatmap that Gainsight provides is not very graphical) or the possibility to see the recordings of my users actually using the platform (there is such an option of some sort of an addon to turn on but turning it on doesn’t really do anything to me and the recordings doesn’t show). I can create a funnel showing me how my users interacted with the website but only 10 positions can be present in one column. Therefore I have nine options showing and a big block named “Other”. Since the amount of “other” visited is pretty significant (often the biggest number on every step) it really affects the results. Pawel M., Trainer (Mid-Market)
GainsightPX’s pricing
Pricing details for GainsightPX aren’t readily available. Instead, you have to request them by filling out a form. The final pricing of the platform will depend on your requirements.
That said, you can get a 30-day free trial of the platform with ease. You could also request a free demo of the platform.
3 Reasons why you might need a GainsightPX alternative
GainsightPX is one of the most prominent product experience platforms in the market. However, it does have its fair share of flaws.
Here are three main scenarios in which you would be better off choosing a GainsightPX alternative:
- You’re on a budget: GainsightPX isn’t the best option if you don’t have a big budget. While the pricing information is only available on request, it could cost you over $2500/month. This could be quite pricey if you’re on a budget and it’d be best to opt for a platform that’s more affordable.
- You want a more beginner-friendly platform: While GainsightPX does offer some beginner-friendly features like a WYSIWYG editor, it does have a long learning curve. If you have a non-technical background, you’re perhaps better off using a GainsightPX alternative.
- You need more extensive survey features: GainsightPX offers numerous types of surveys, including NPS. It also enables you to create multi-question survey engagements. But if you need more advanced features like behavior-based survey triggers and translations, you should opt for other platforms.
Userpilot – A better alternative for user engagement analysis
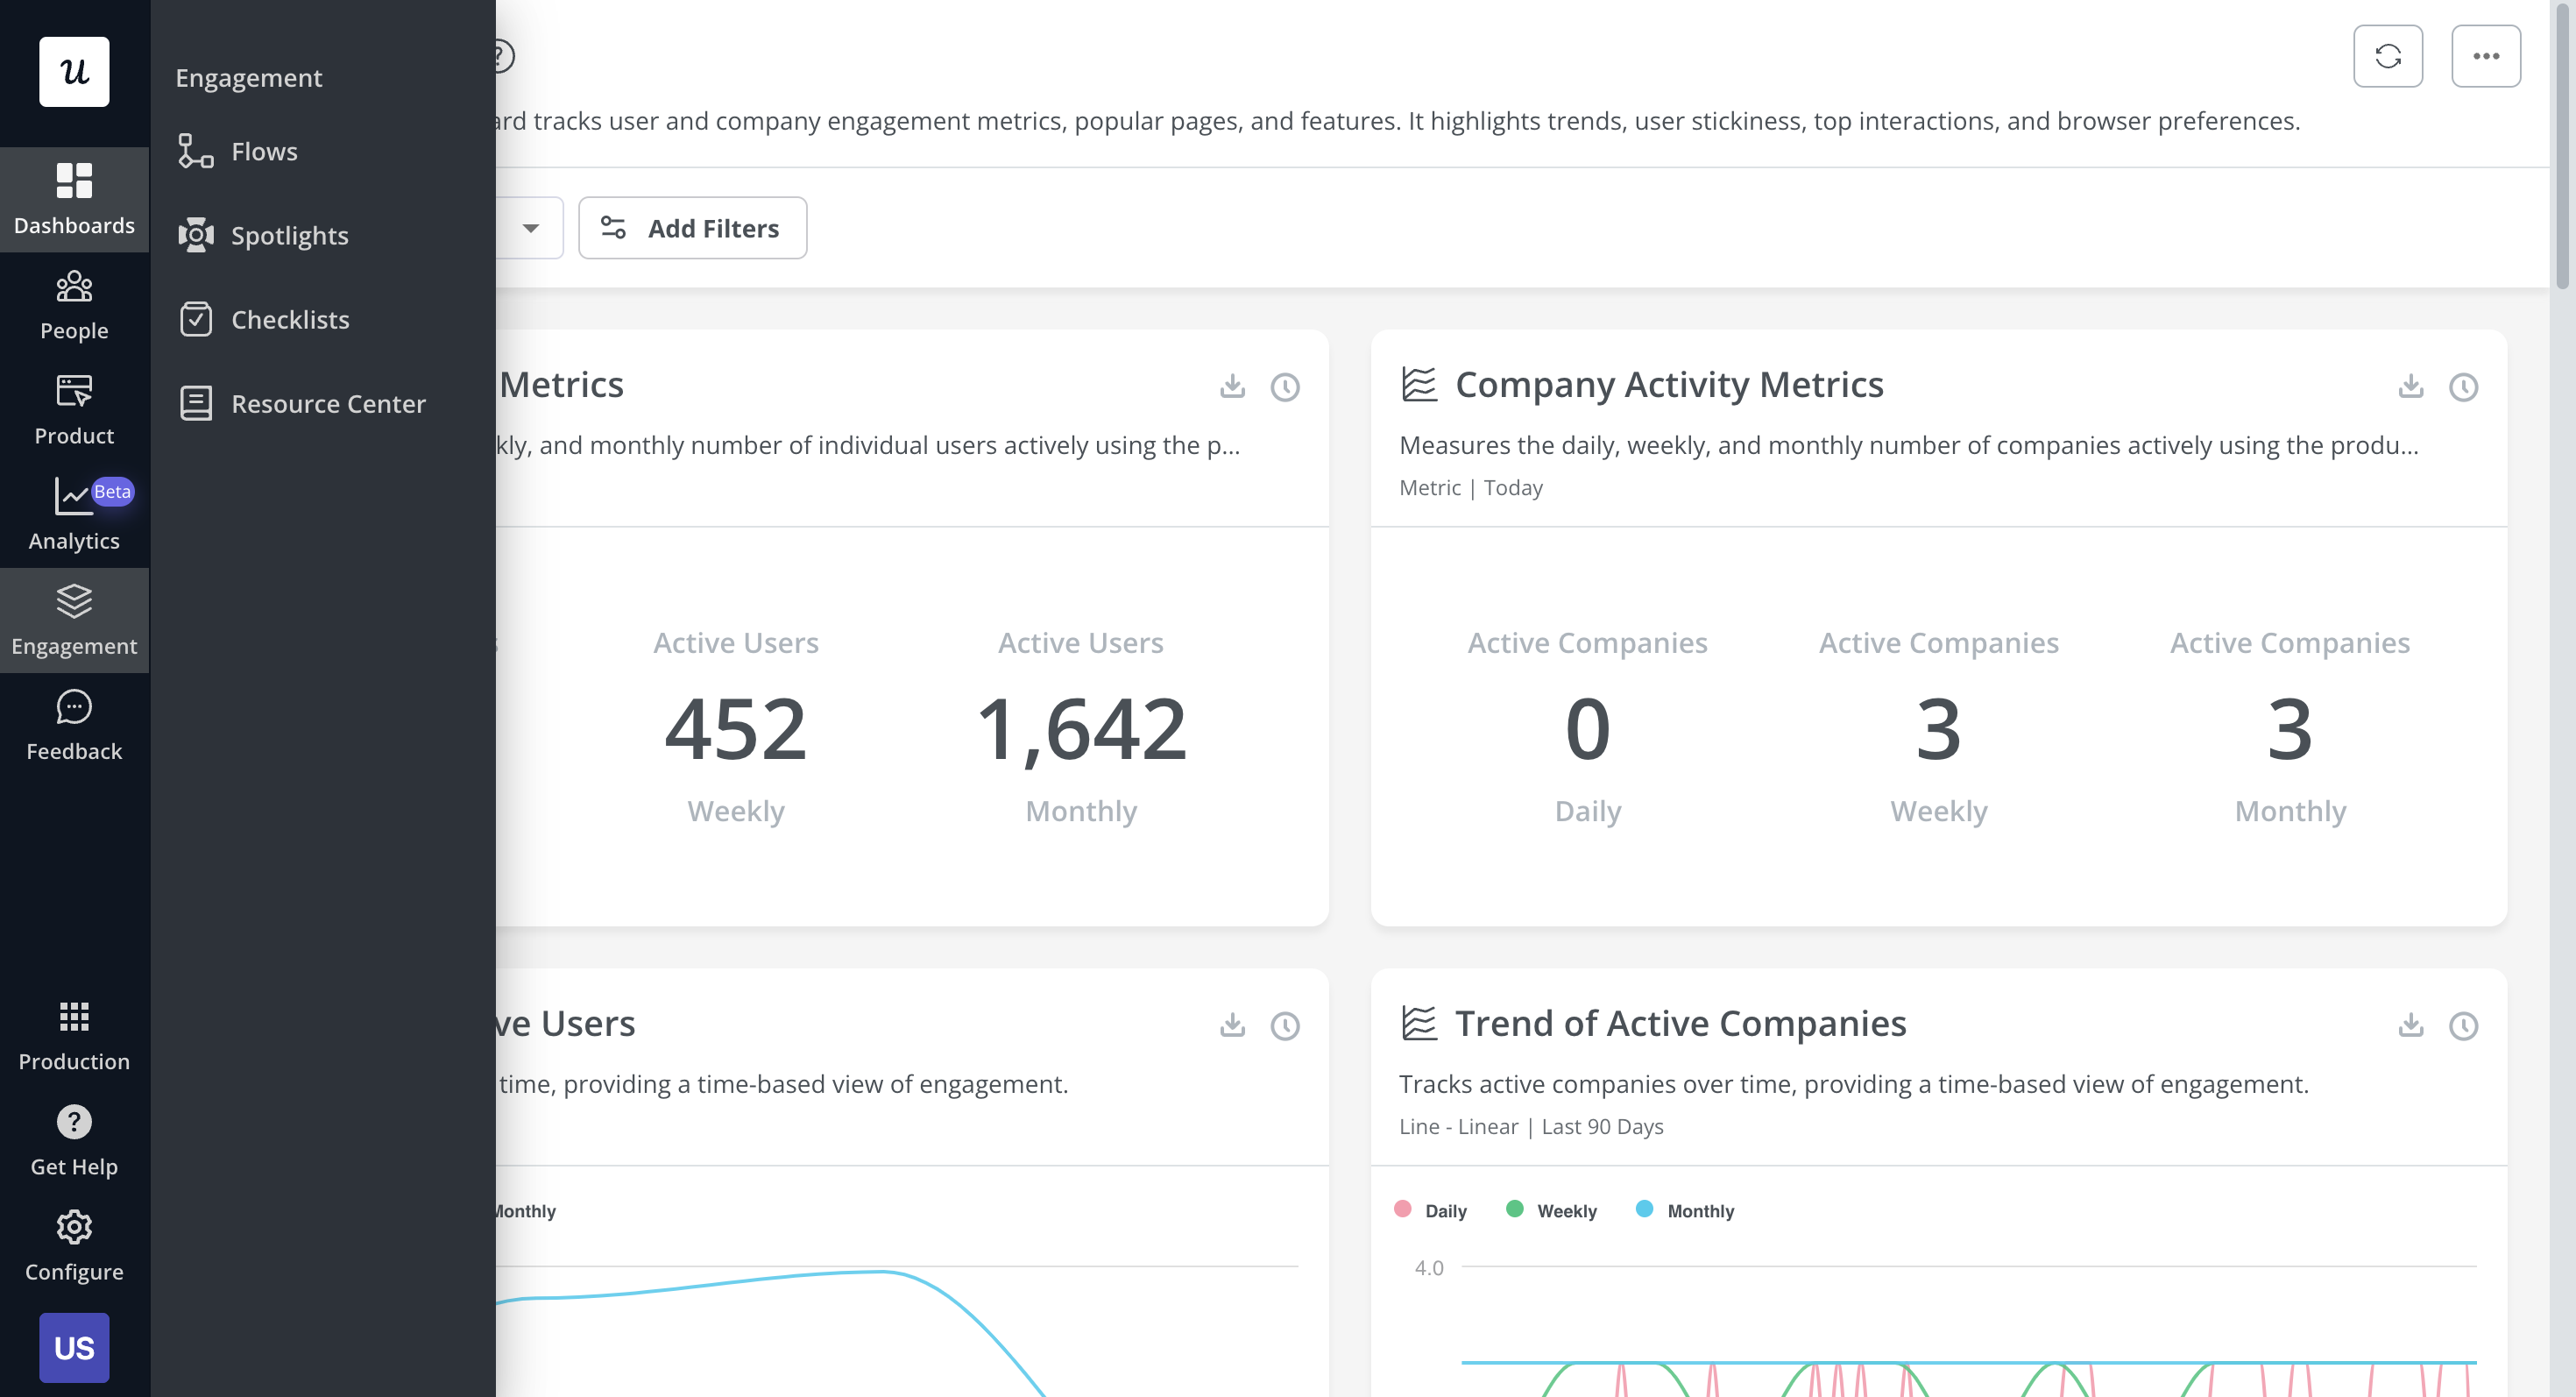
Here are some Userpilot features you can use for user behavior tracking:
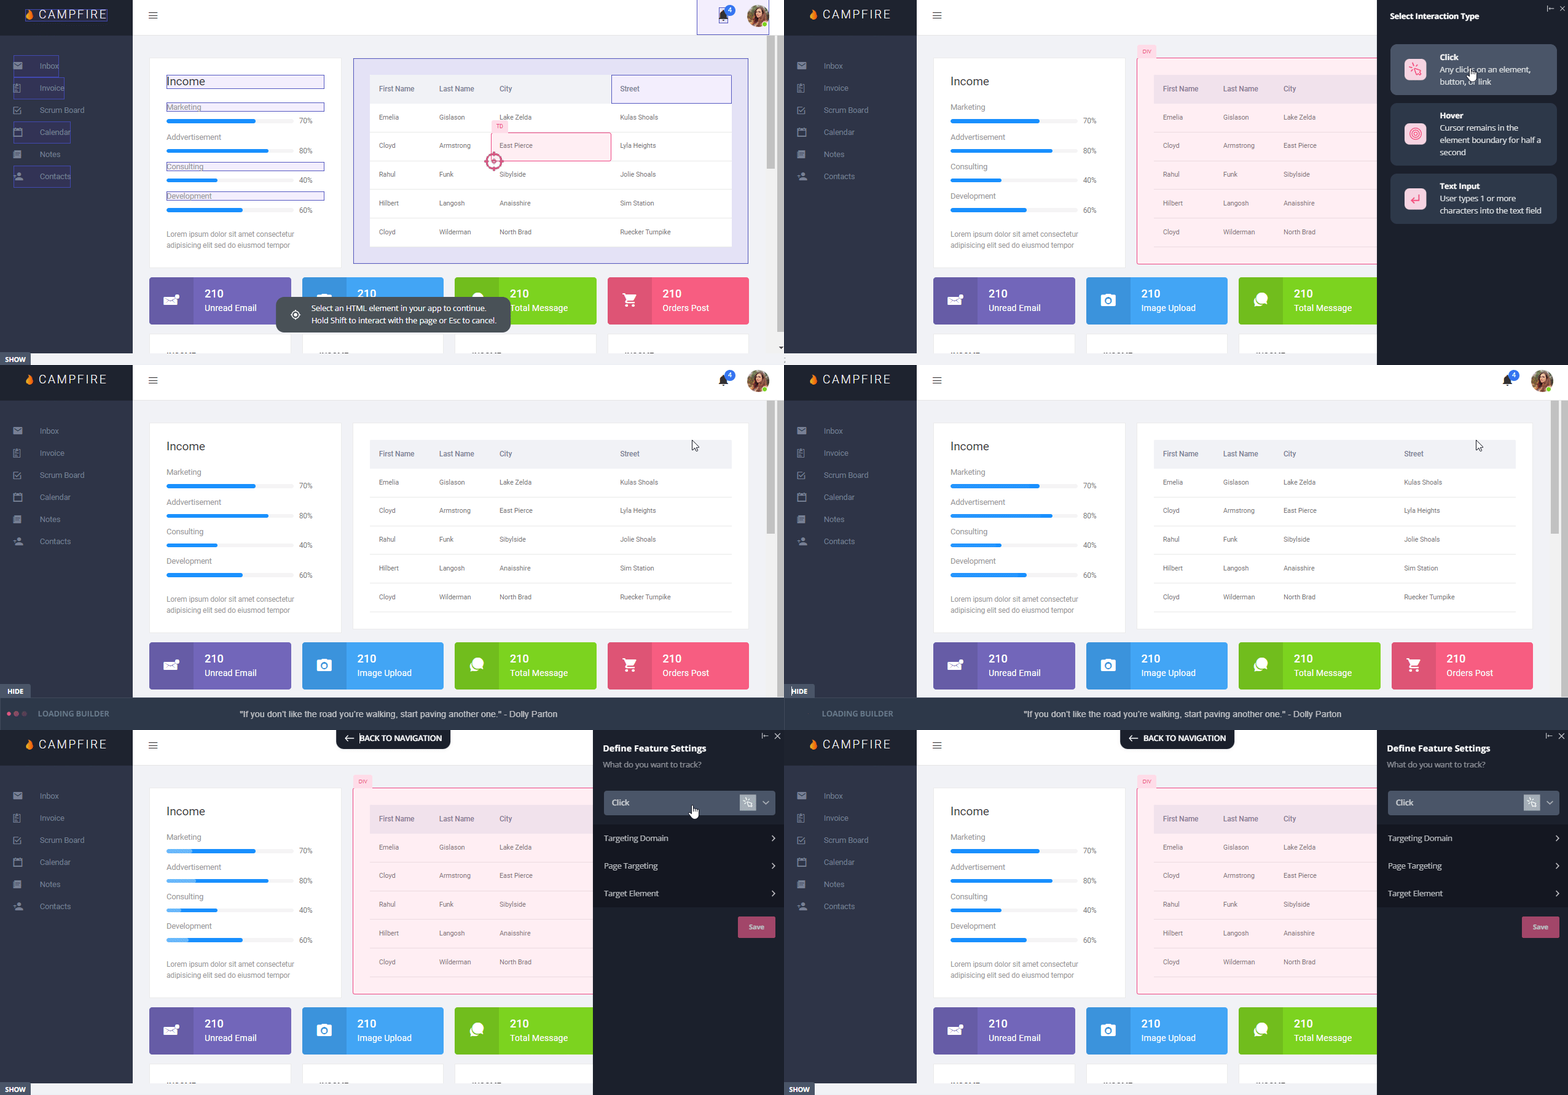
- No-Code Feature Tagging: Userpilot’s click-to-track feature tagger lets you mark features, buttons, and elements with the Chrome extension. You’ll be able to track user interactions such as clicks, hovers, or inputs to get an accurate behavioral view for specific features.
- Funnel Reports: Funnel reports show you the total number of users that enter a funnel and the percentage of users that complete each step. This can help you track behavioral paths and see which stages most users get stuck on.
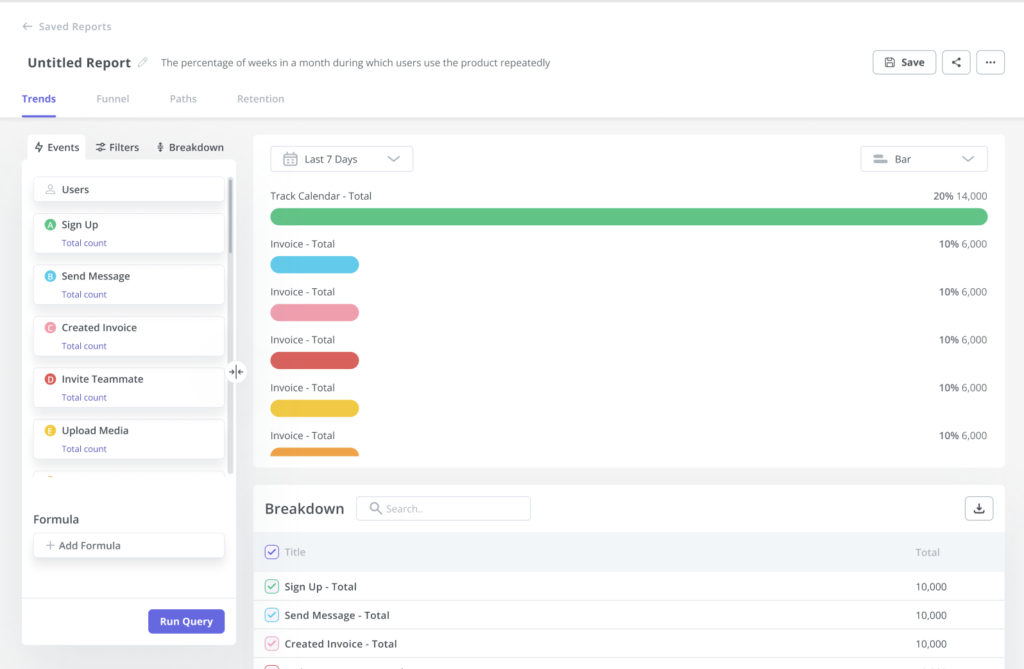
- Trends Reports: Generating trends reports will help you visualize the occurrence of key events over time and break down these analytics by device, browser, operating system, country, signup date, or even individual user IDs and email addresses to see granular behavioral analytics.
Userpilot’s feature tags
Tracking feature adoption is essential to identify under-utilized features and push users toward discovering them. Userpilot lets you tag features without writing any code, track adoption through engagement analytics, and visualize feature usage with heatmaps.
Here’s how you can use Userpilot to conduct feature audits and drive feature adoption:
- No-code tagging: Userpilot’s no-code feature tagger lets you add tags through the Chrome extension’s visual builder. You’ll also be able to select whether the tag should track clicks, hovers, or text inputs from users to get contextual data that reflects actual feature usage.
- Feature tags: The advanced feature analytics of Userpilot lets you track feature performance trends, see the top 20 features across your user base, and see granular data for individual features. You’ll also be able to filter your data by segment, company, or time period.
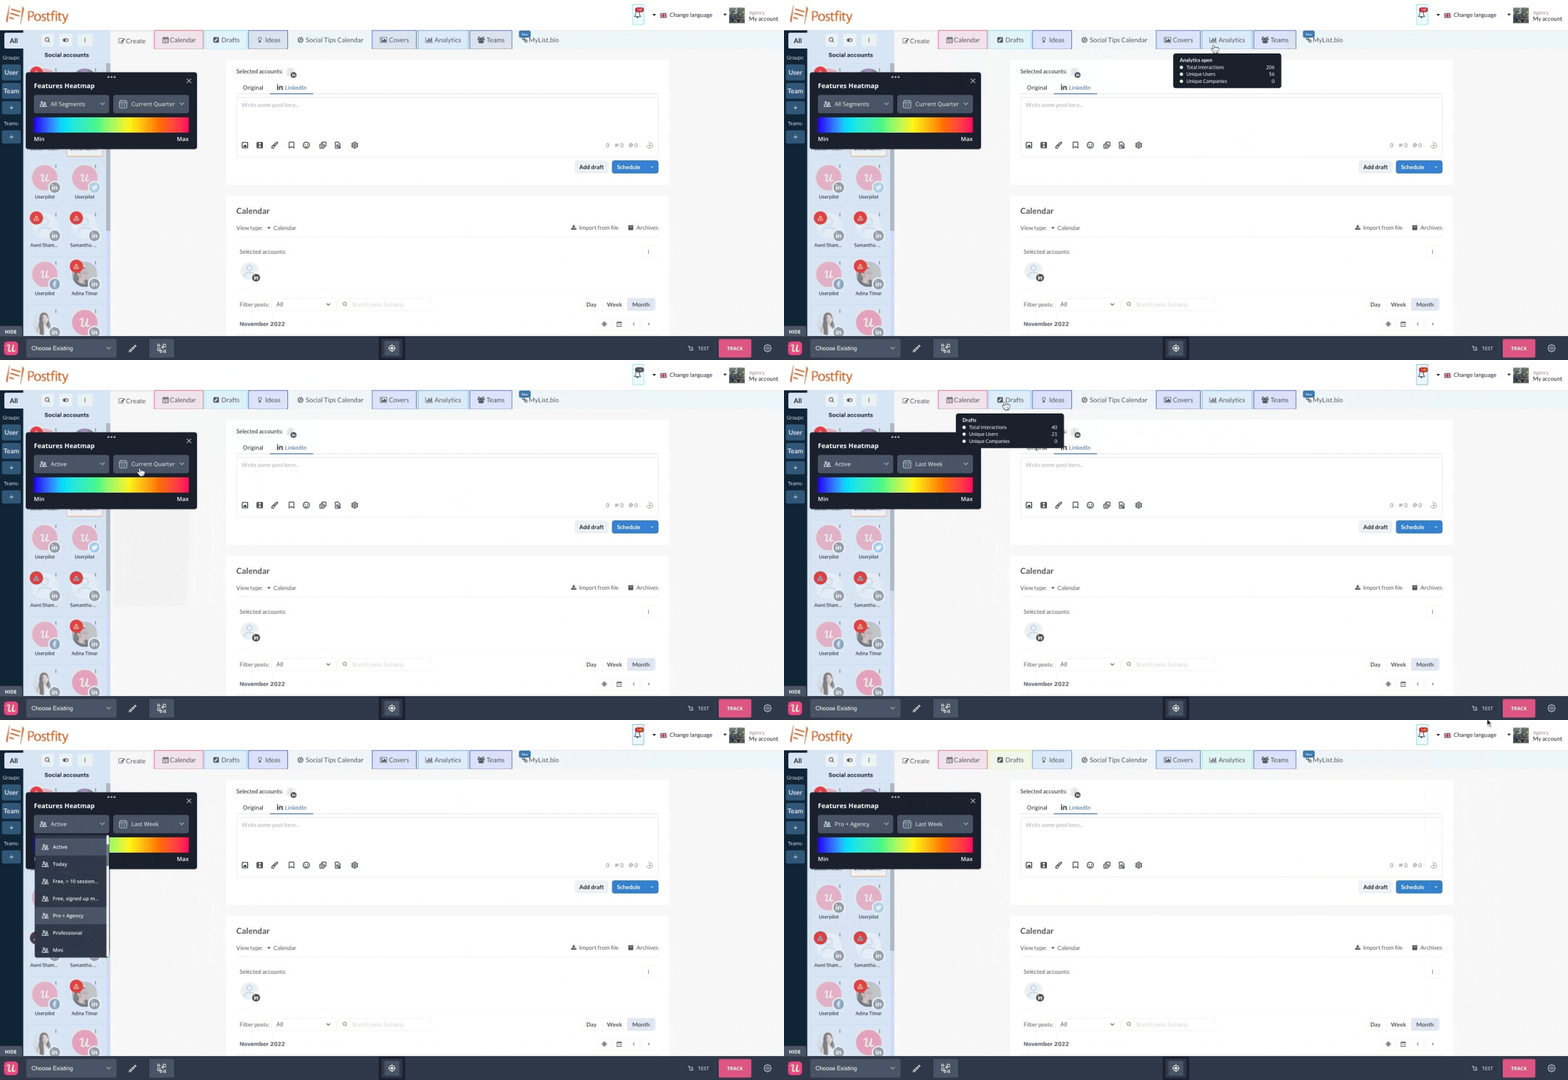
- Usage heatmaps: Userpilot heatmaps show you the features/elements with the most interactions. Heatmaps can be generated on the Features & Events dashboard by clicking on a tagged feature, editing it in the builder, and then clicking the heatmap icon on the bottom toolbar.
Userpilot’s in-app events
Tracking and analyzing event data gives you a better understanding of user behavior so you can capitalize on opportunities to improve the in-app experience.
Here are the ways you can use Userpilot as an event-tracking tool:
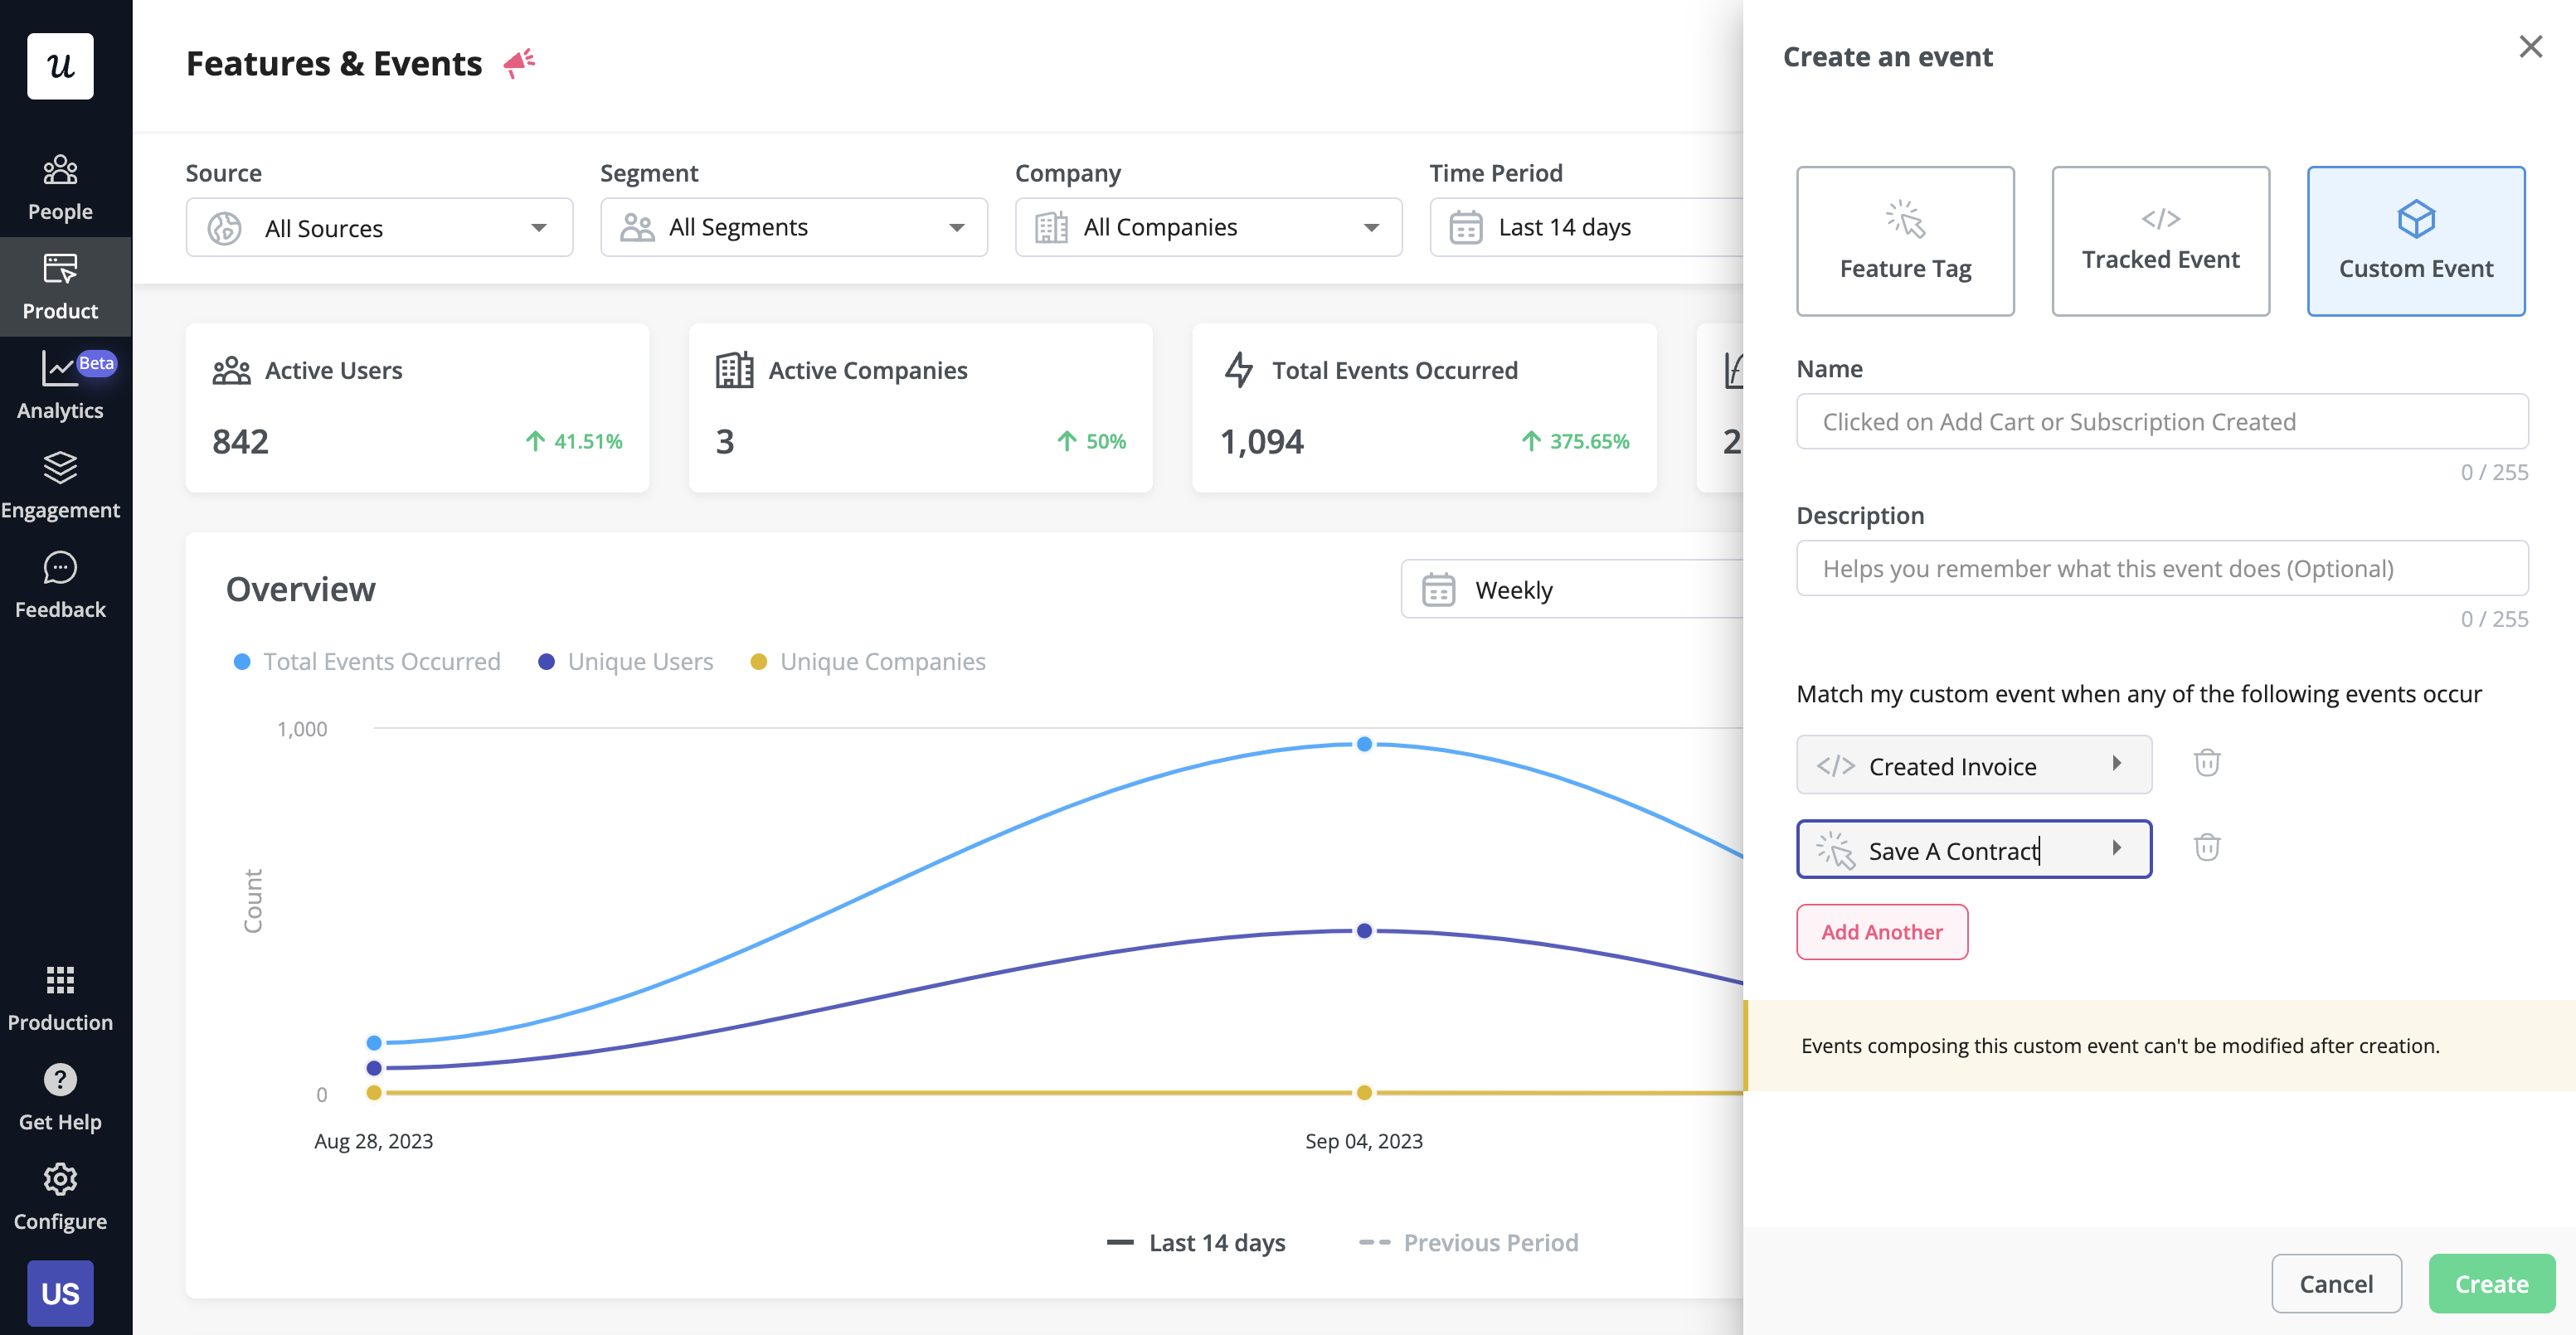
- Event tracking: The Userpilot flow builder lets you track custom events by tagging individual features (Feature Tag), by API (called Tracked Events) or by setting them up using a combination of feature tags and tracked events (Custom Events).
- Feature tags: Userpilot’s no-code feature tagger lets you track important features/elements based on different interaction types (clicks, hovers, and text inputs). You can then display the engagement and performance of different features through heatmaps.
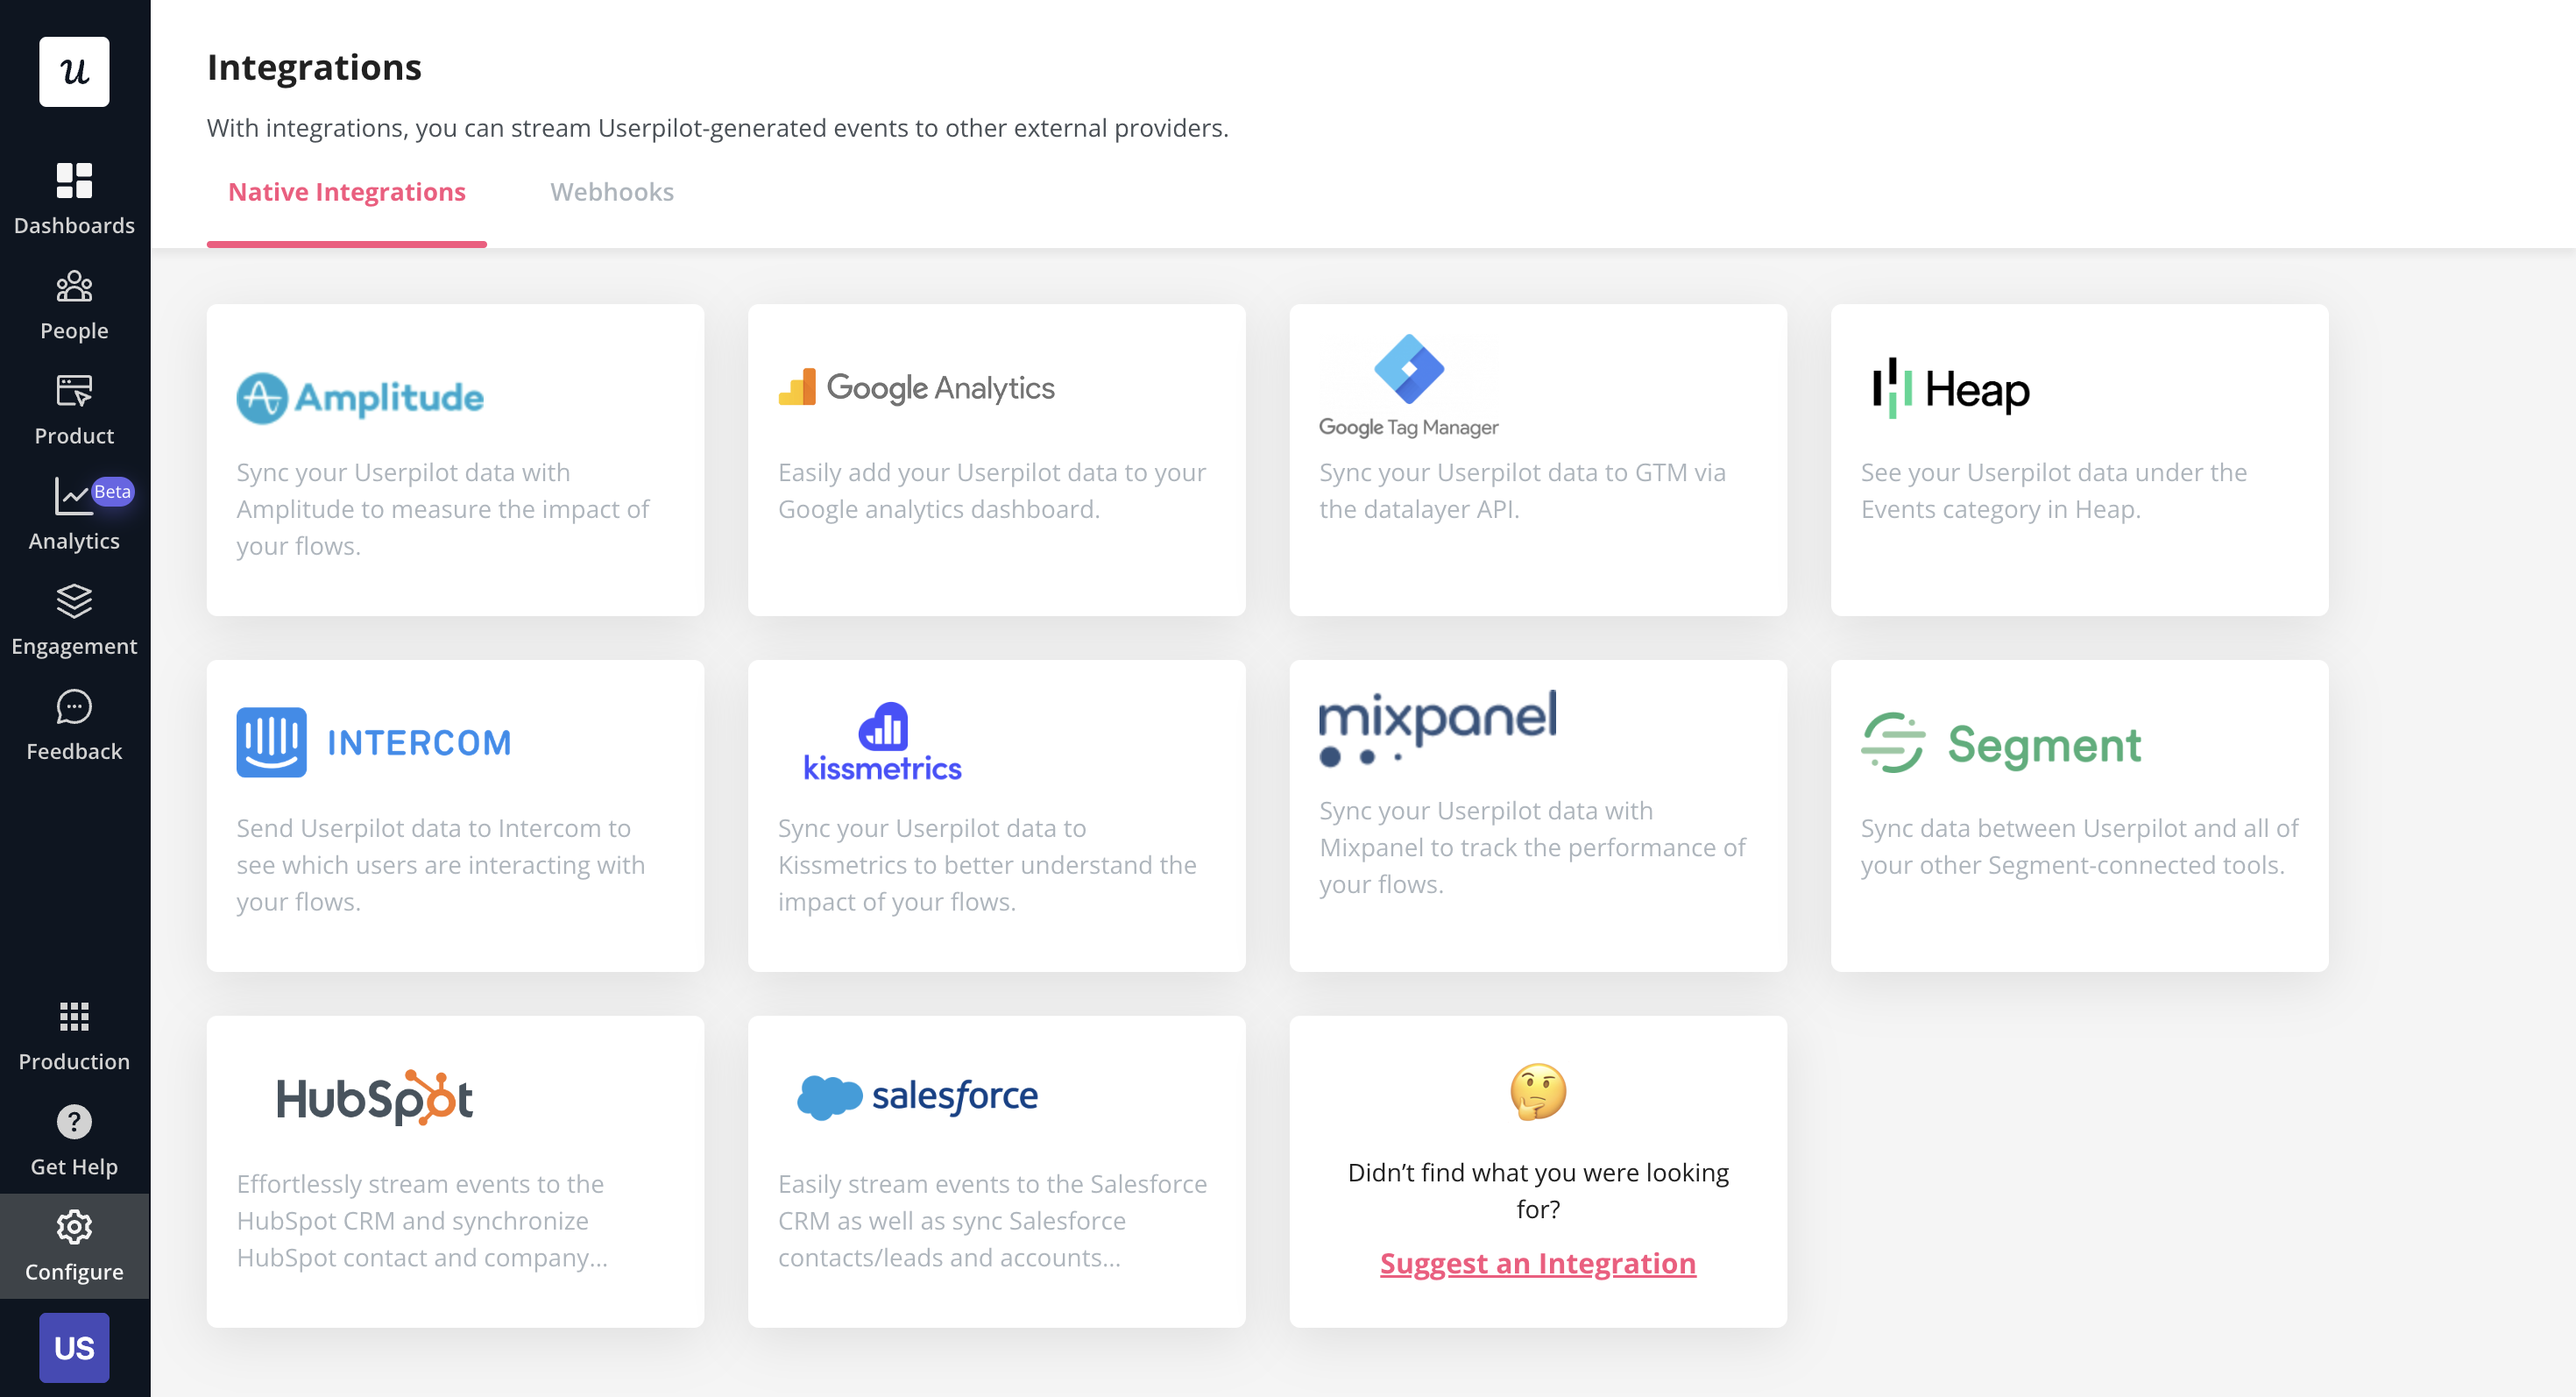
- Data integrations: Userpilot has native integrations with popular analytics tools like Amplitude, Mixpanel, Google Analytics, and more. This makes it possible to sync your event data across multiple tools within your tech stack.
Userpilot’s behavioral analytics
Behavioral analytics make it possible to monitor user activity, group data into cohorts, and extract relevant metrics/insights. Userpilot lets you tag features to see how users interact with them, compare goals by cohort, and create trend reports that track behavioral patterns over time.
Here are some Userpilot features you can use for user behavior tracking:
- No-Code Feature Tagging: Userpilot’s click-to-track feature tagger lets you mark features, buttons, and elements with the Chrome extension. You’ll be able to track user interactions such as clicks, hovers, or inputs to get an accurate behavioral view for specific features.
- Funnel Reports: Funnel reports show you the total number of users that enter a funnel and the percentage of users that complete each step. This can help you track behavioral paths and see which stages most users get stuck on.
- Trends Reports: Generating trends reports will help you visualize the occurrence of key events over time and break down these analytics by device, browser, operating system, country, signup date, or even individual user IDs and email addresses to see granular behavioral analytics.
Userpilot’s survey analytics
Survey analytics are an essential part of extracting actionable insights from user feedback. Userpilot’s advanced analytics capabilities extend to any surveys you build with it. You’ll be able to see granular analytics for surveys, sort by audience or time period, and view NPS data separately.
Here’s an overview of the Userpilot features you can use during survey data analysis:
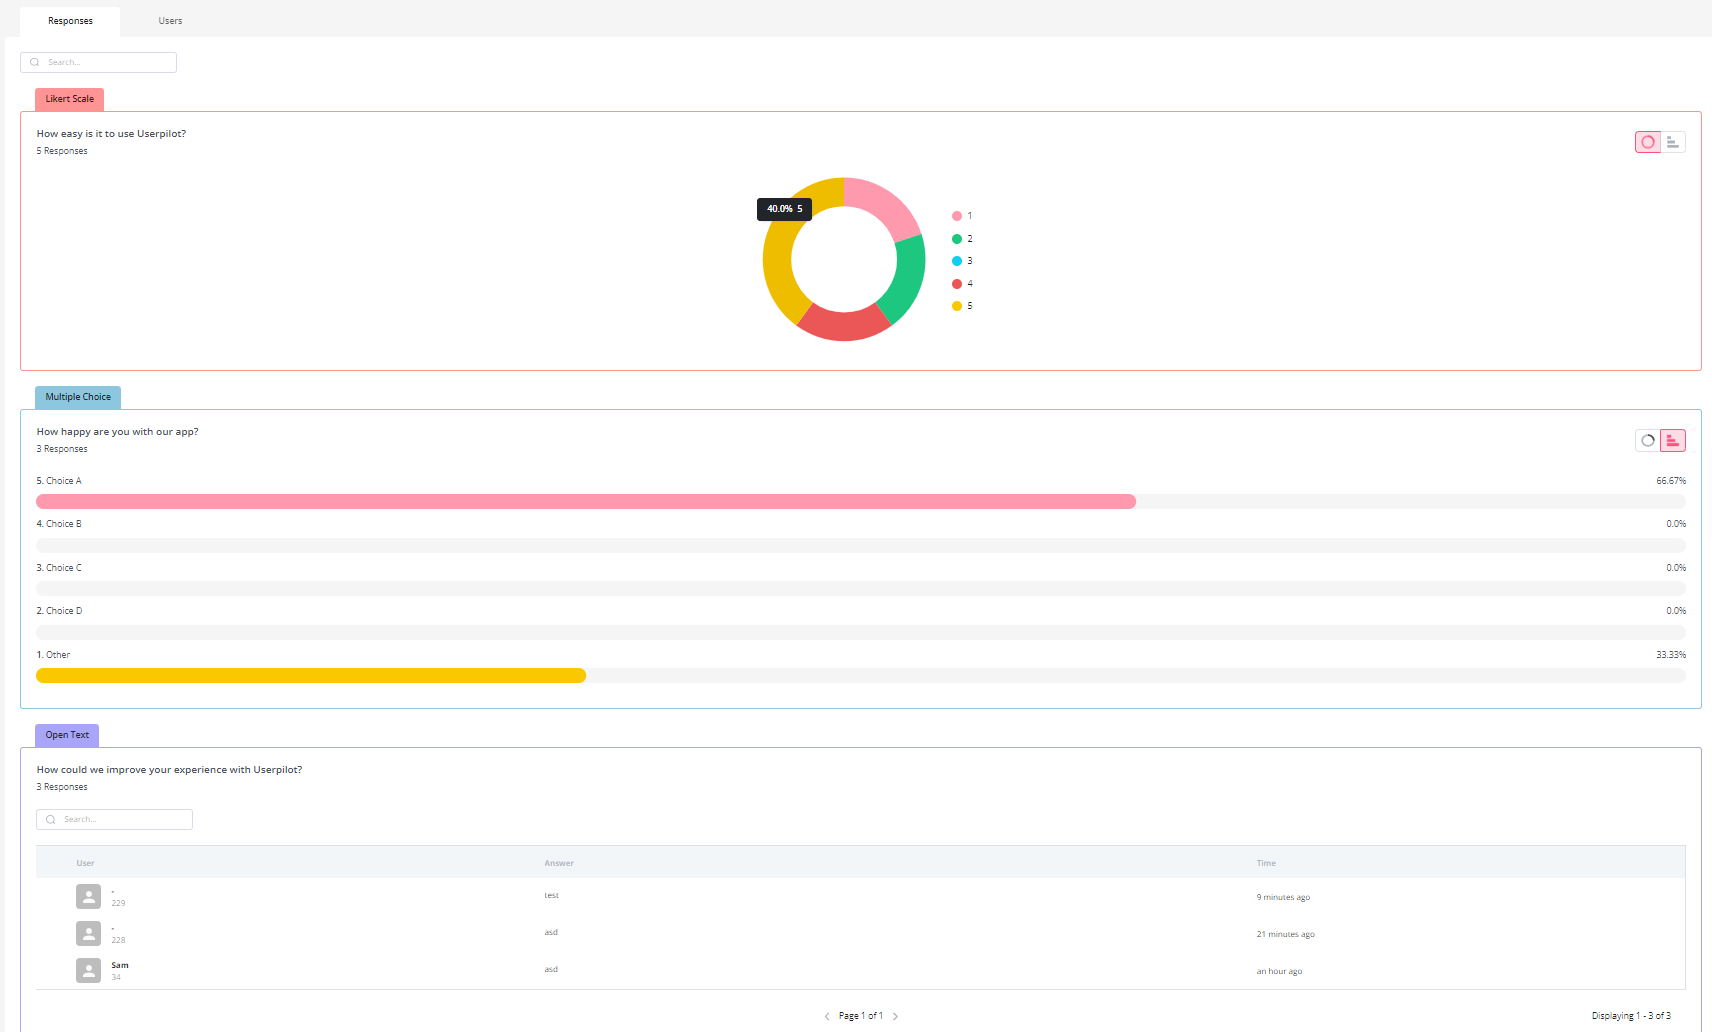
- Granular analytics: Each survey you create has its own analytics tab where you’ll be able to see which percentage of respondents chose a particular option, view the most popular choices, and review qualitative responses of users. You can also sort by segment, company, or time period.
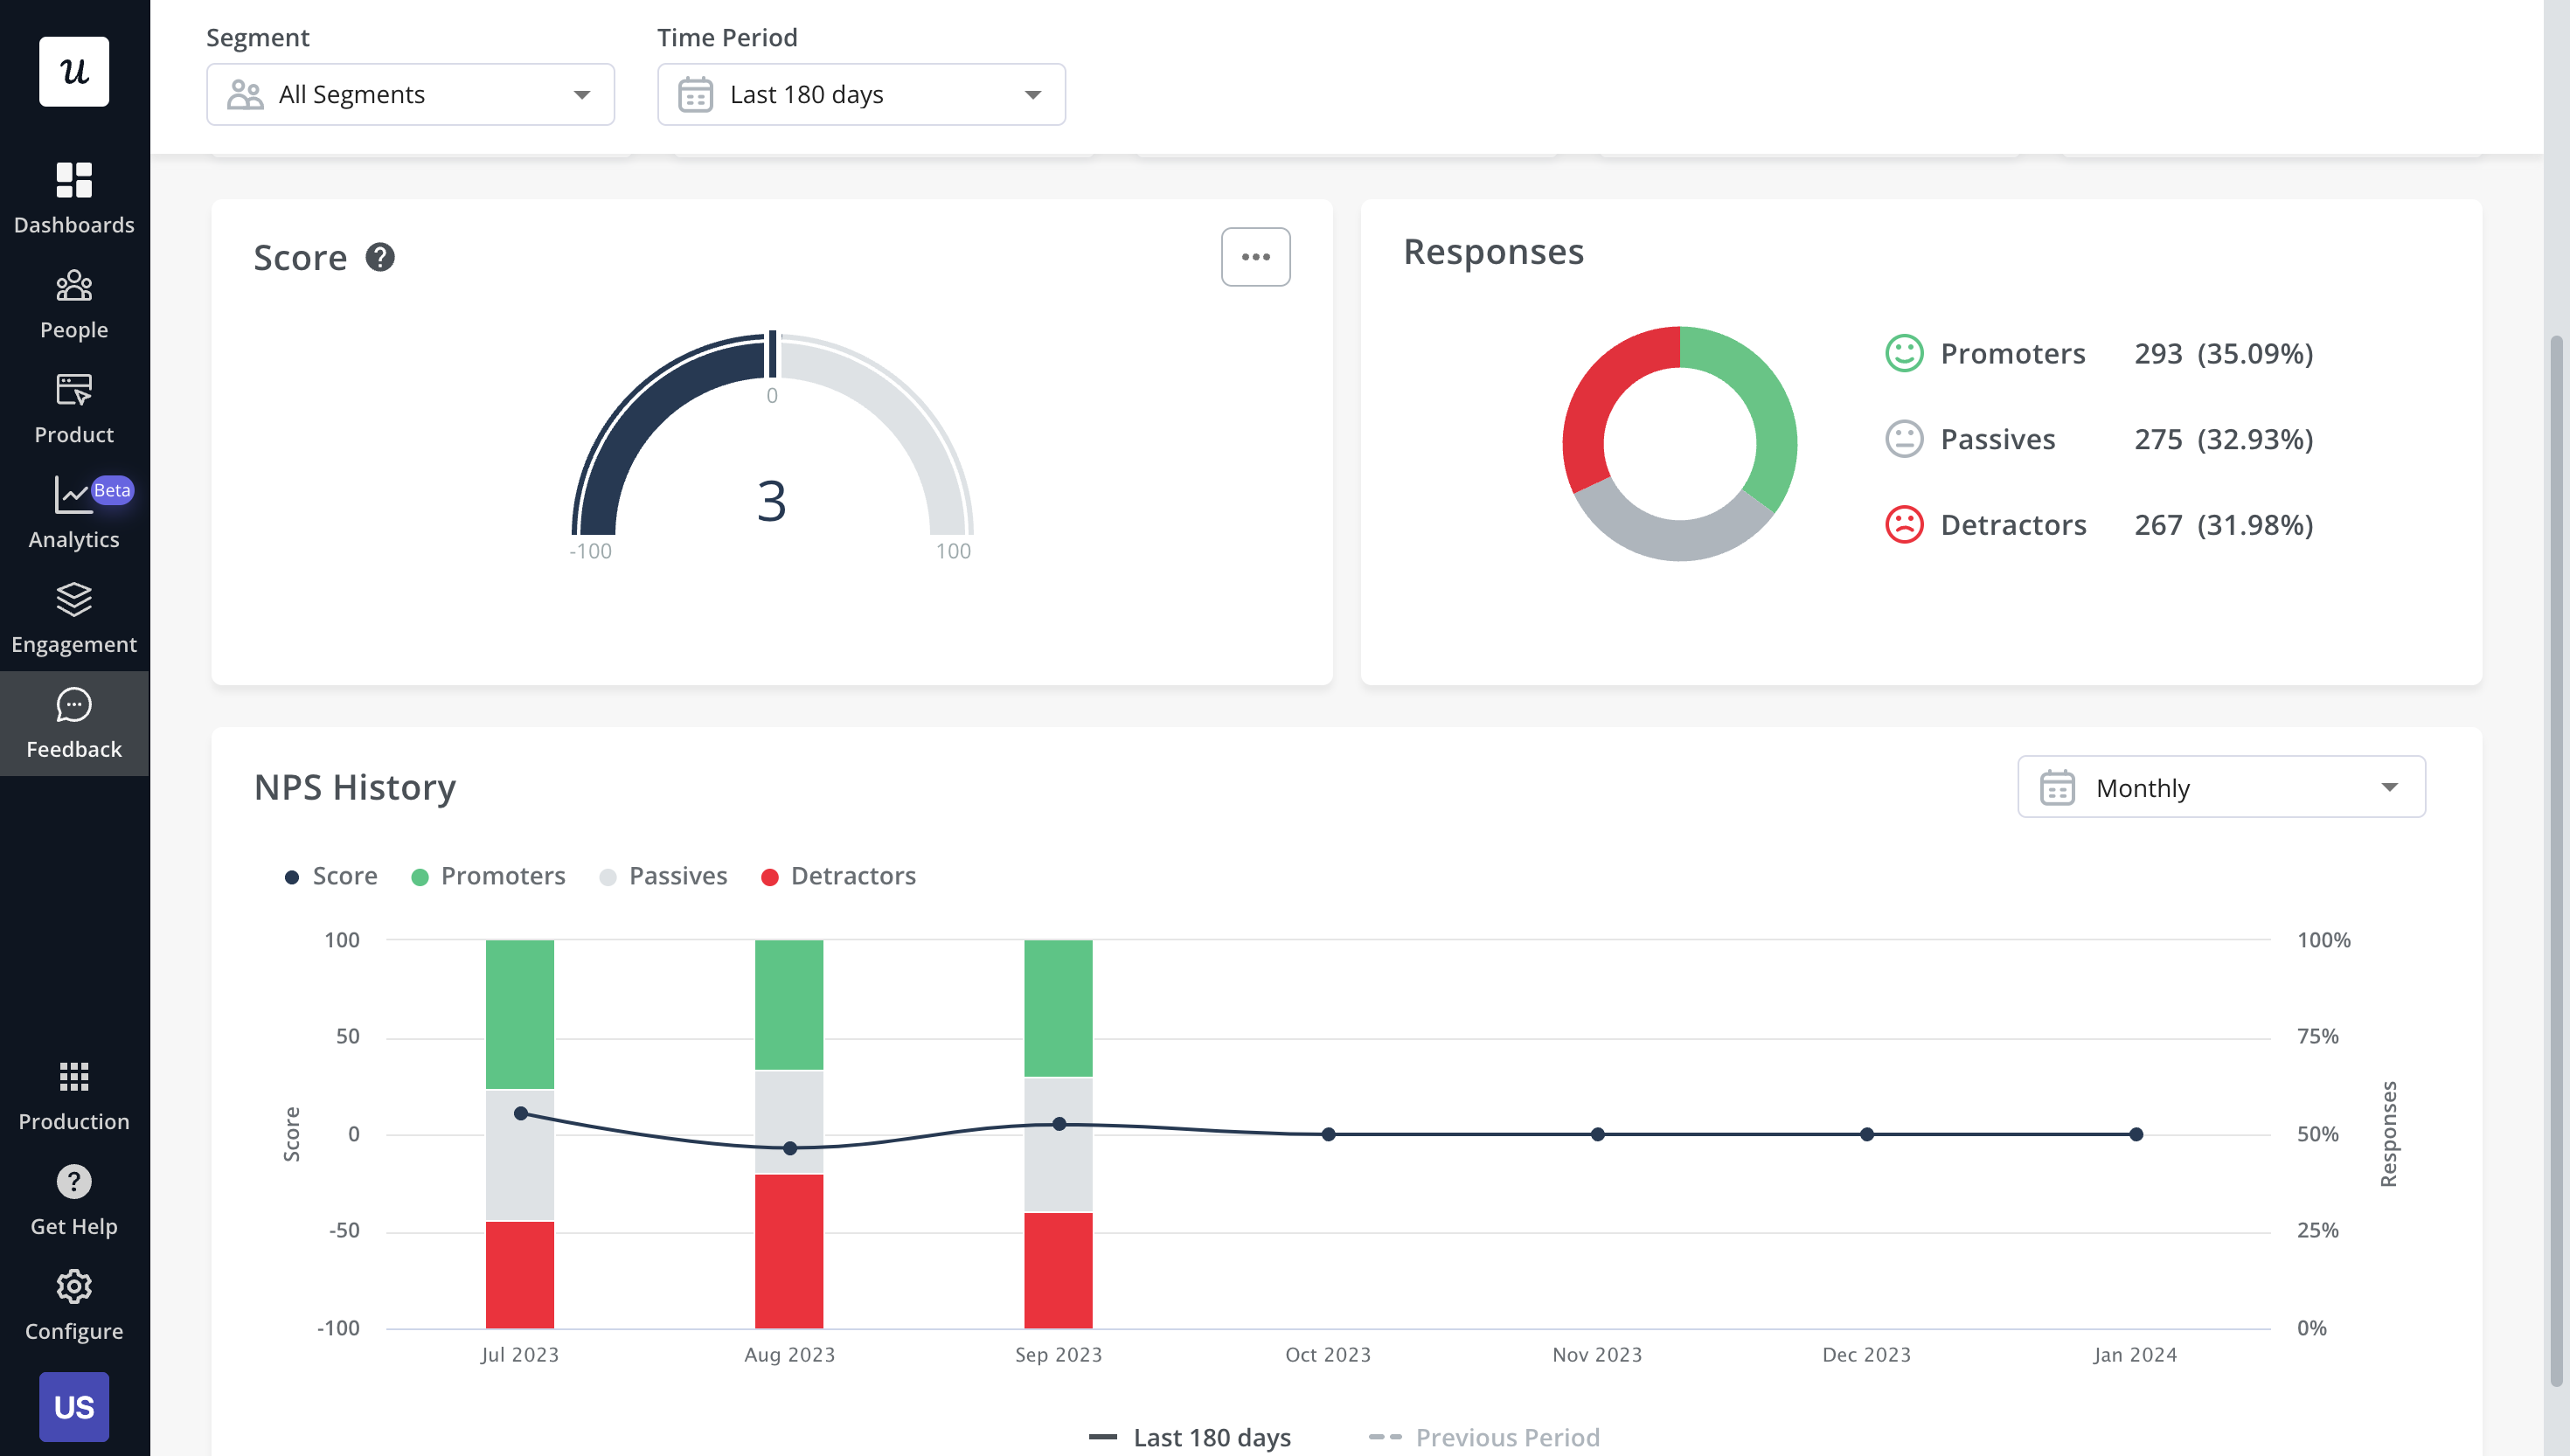
- NPS dashboard: The dedicated NPS dashboard compiles survey responses to show you all relevant Net Promoter Score data in one place. This includes total views, NPS score, total responses, overall response rate, the number of qualitative responses, and how NPS is trending over time.
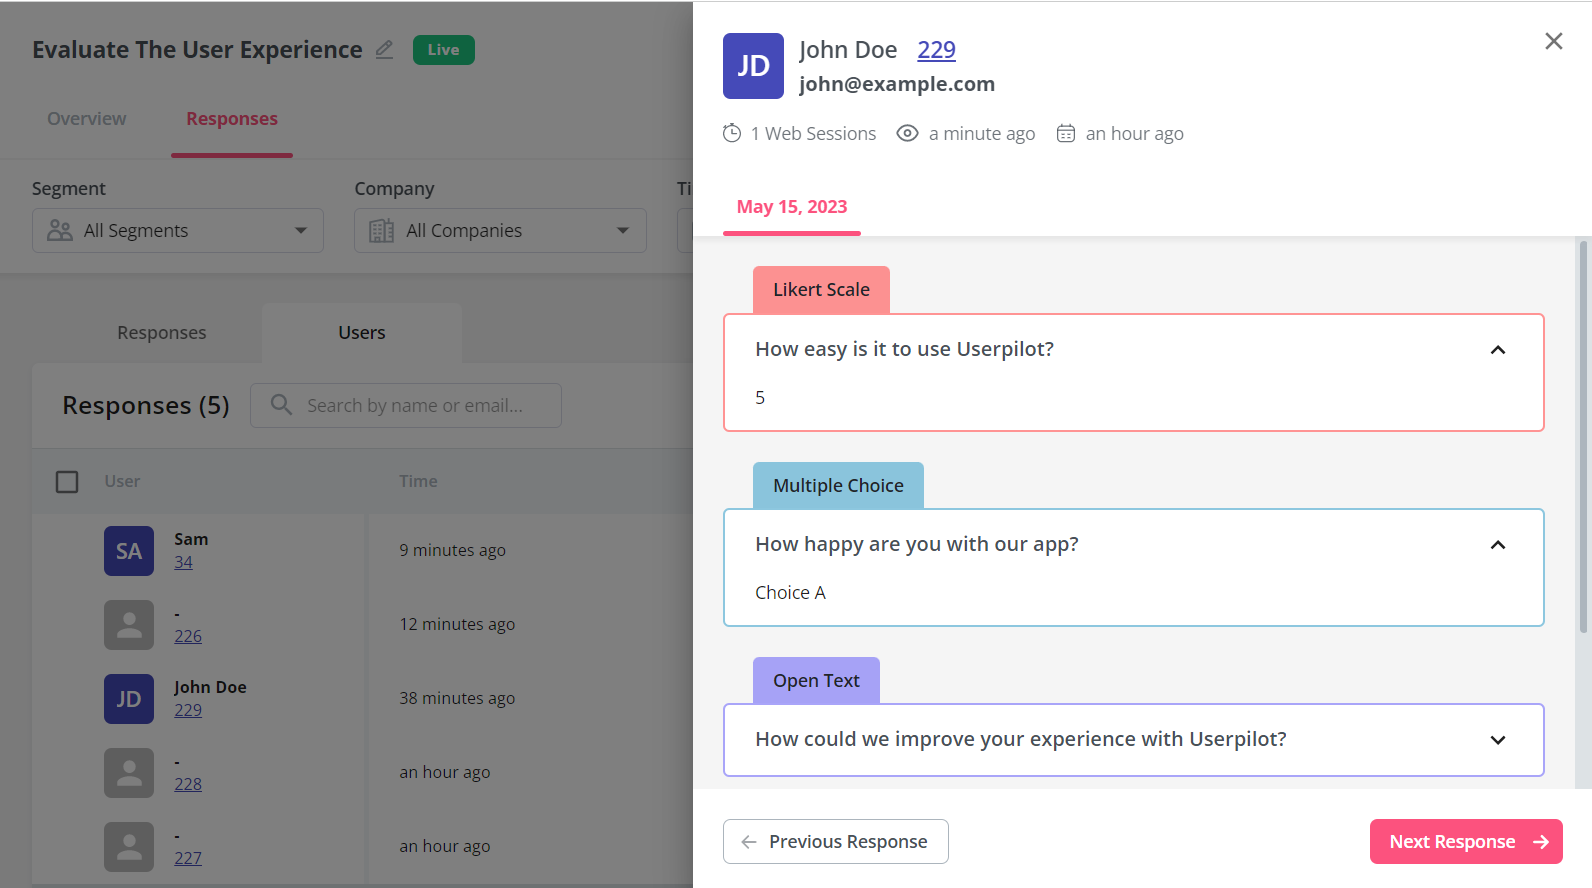
- User responses: Userpilot lets you review the responses of each individual user so you can see how sentiment differs on a customer-to-customer basis. This makes it easier to schedule follow-up interviews or implement suggestions made by users with the highest lifetime value (LTV).
What are the pros and cons of Userpilot?
Userpilot pros
As a full-suite digital adoption platform, Userpilot has all the features you need to onboard users, track analytics, and gather feedback from customers without writing a single line of code. Here are a few pros of using Userpilot as your product growth solution:
- No-code builder: Userpilot’s Chrome extension lets you build flows, add UI elements, and tag features without writing a single line of code.
- UI patterns: There are plenty of UI patterns to choose from when using Userpilot, such as hotspots, tooltips, banners, slideouts, modals, and more!
- Startup-friendly: Userpilot’s entry-level plan gives you access to all available UI patterns so you can hit the ground running.
- Walkthroughs and flows: Build engaging interactive walkthroughs and personalized onboarding flows that target specific segments of your user base.
- Self-service support: Build an in-app resource center to help users solve problems, customize its appearance to align it with your brand, and insert various types of content (videos, flows, or chatbots) to keep your customers satisfied.
- A/B testing: Userpilot’s built-in A/B testing capabilities will help you split-test flows, iterate on the best-performing variants, and continually optimize based on user behavior.
- Feedback collection: Userpilot has built-in NPS surveys with its own unified analytics dashboard and response tagging to help you retarget users. There are other survey types to choose from and you can even create your own custom survey.
- Survey templates: There are 14 survey templates to choose from so you can gather feedback on specific features or run customer satisfaction benchmarking surveys like CSAT and CES.
- Advanced analytics: Userpilot lets you analyze product usage data, monitor engagement on all in-app flows, and use the data to create user segments that are based on behaviors instead of demographics.
- Event tracking: Userpilot’s no-code event tracking lets you tag UI interactions (hovers, clicks, or form fills) and group them into a custom event that reflects feature usage.
- Third-party integrations: Userpilot has built-in integrations with tools like Amplitude, Mixpanel, Kissmetrics, Segment, Heap, HubSpot, Intercom, Google Analytics, and Google Tag Manager so you can share data between all the solutions in your tech stack.
Userpilot’s cons
Of course, no tool is perfect and there are a few cons to consider before choosing Userpilot as your user onboarding or product growth solution:
- Employee onboarding: Currently, Userpilot only supports in-app customer onboarding.
- Mobile apps: Userpilot doesn’t have any mobile compatibility which could make it difficult for developers with cross-platform applications to create a consistent user experience for both versions of their product.
- Freemium plan: There’s no freemium Userpilot plan so those bootstrapping their startup and need sub-$100 solutions should consider more affordable onboarding platforms like UserGuiding or Product Fruits.
What do users say about Userpilot?
Most users laud Userpilot for its versatile feature set, ease of use, and responsive support team:
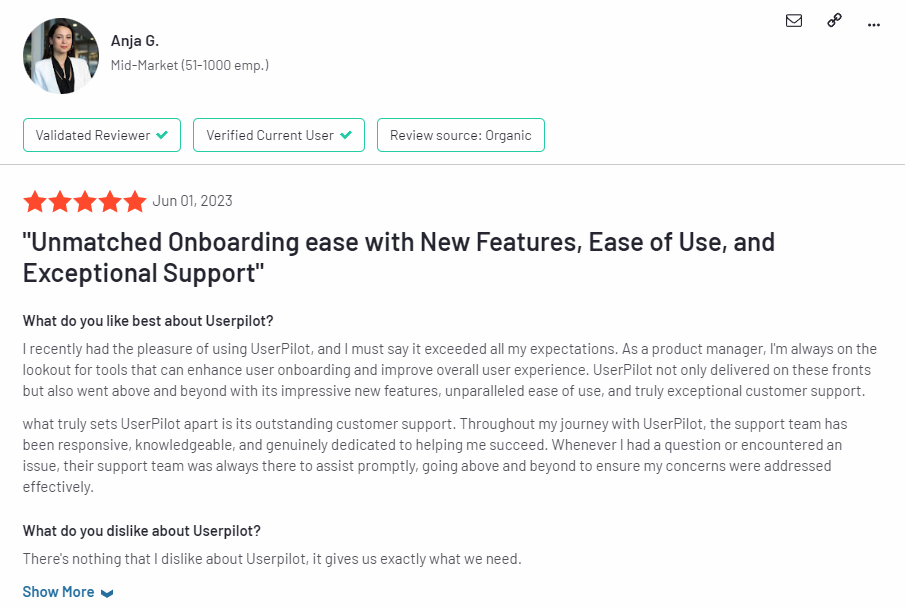
I recently had the pleasure of using Userpilot, and I must say it exceeded all my expectations. As a product manager, I’m always on the lookout for tools that can enhance user onboarding and improve overall user experience. Userpilot not only delivered on these fronts but also went above and beyond with its impressive new features, unparalleled ease of use, and truly exceptional customer support.
What truly sets Userpilot apart is its outstanding customer support. Throughout my journey with Userpilot, the support team has been responsive, knowledgeable, and genuinely dedicated to helping me succeed. Whenever I had a question or encountered an issue, their support team was always there to assist promptly, going above and beyond to ensure my concerns were addressed effectively.
Source: G2.
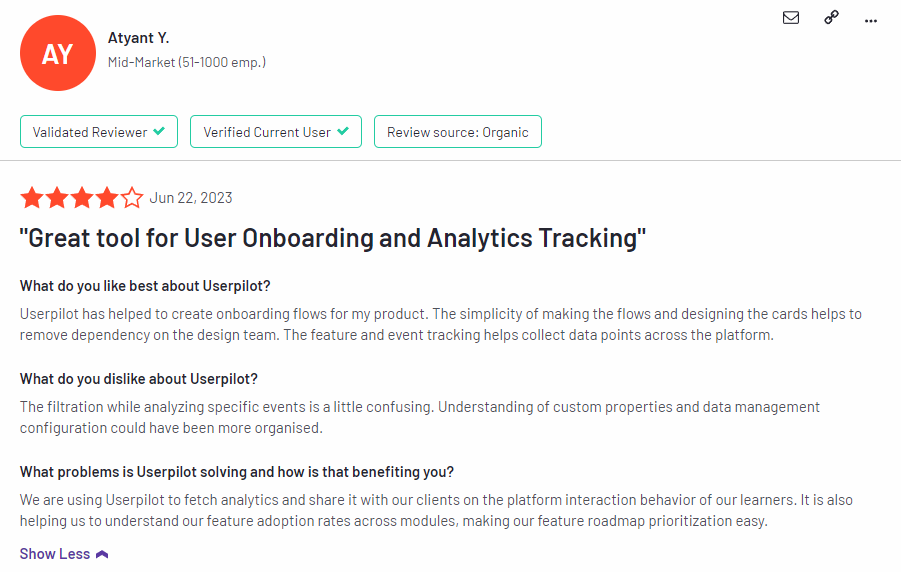
Of course, other users are also kind enough to share constructive criticism regarding specific features like event tracking filters:
“The filtration while analyzing specific events is a little confusing. Understanding of custom properties and data management configuration could have been more organised.”
Source: G2.
Userpilot’s pricing
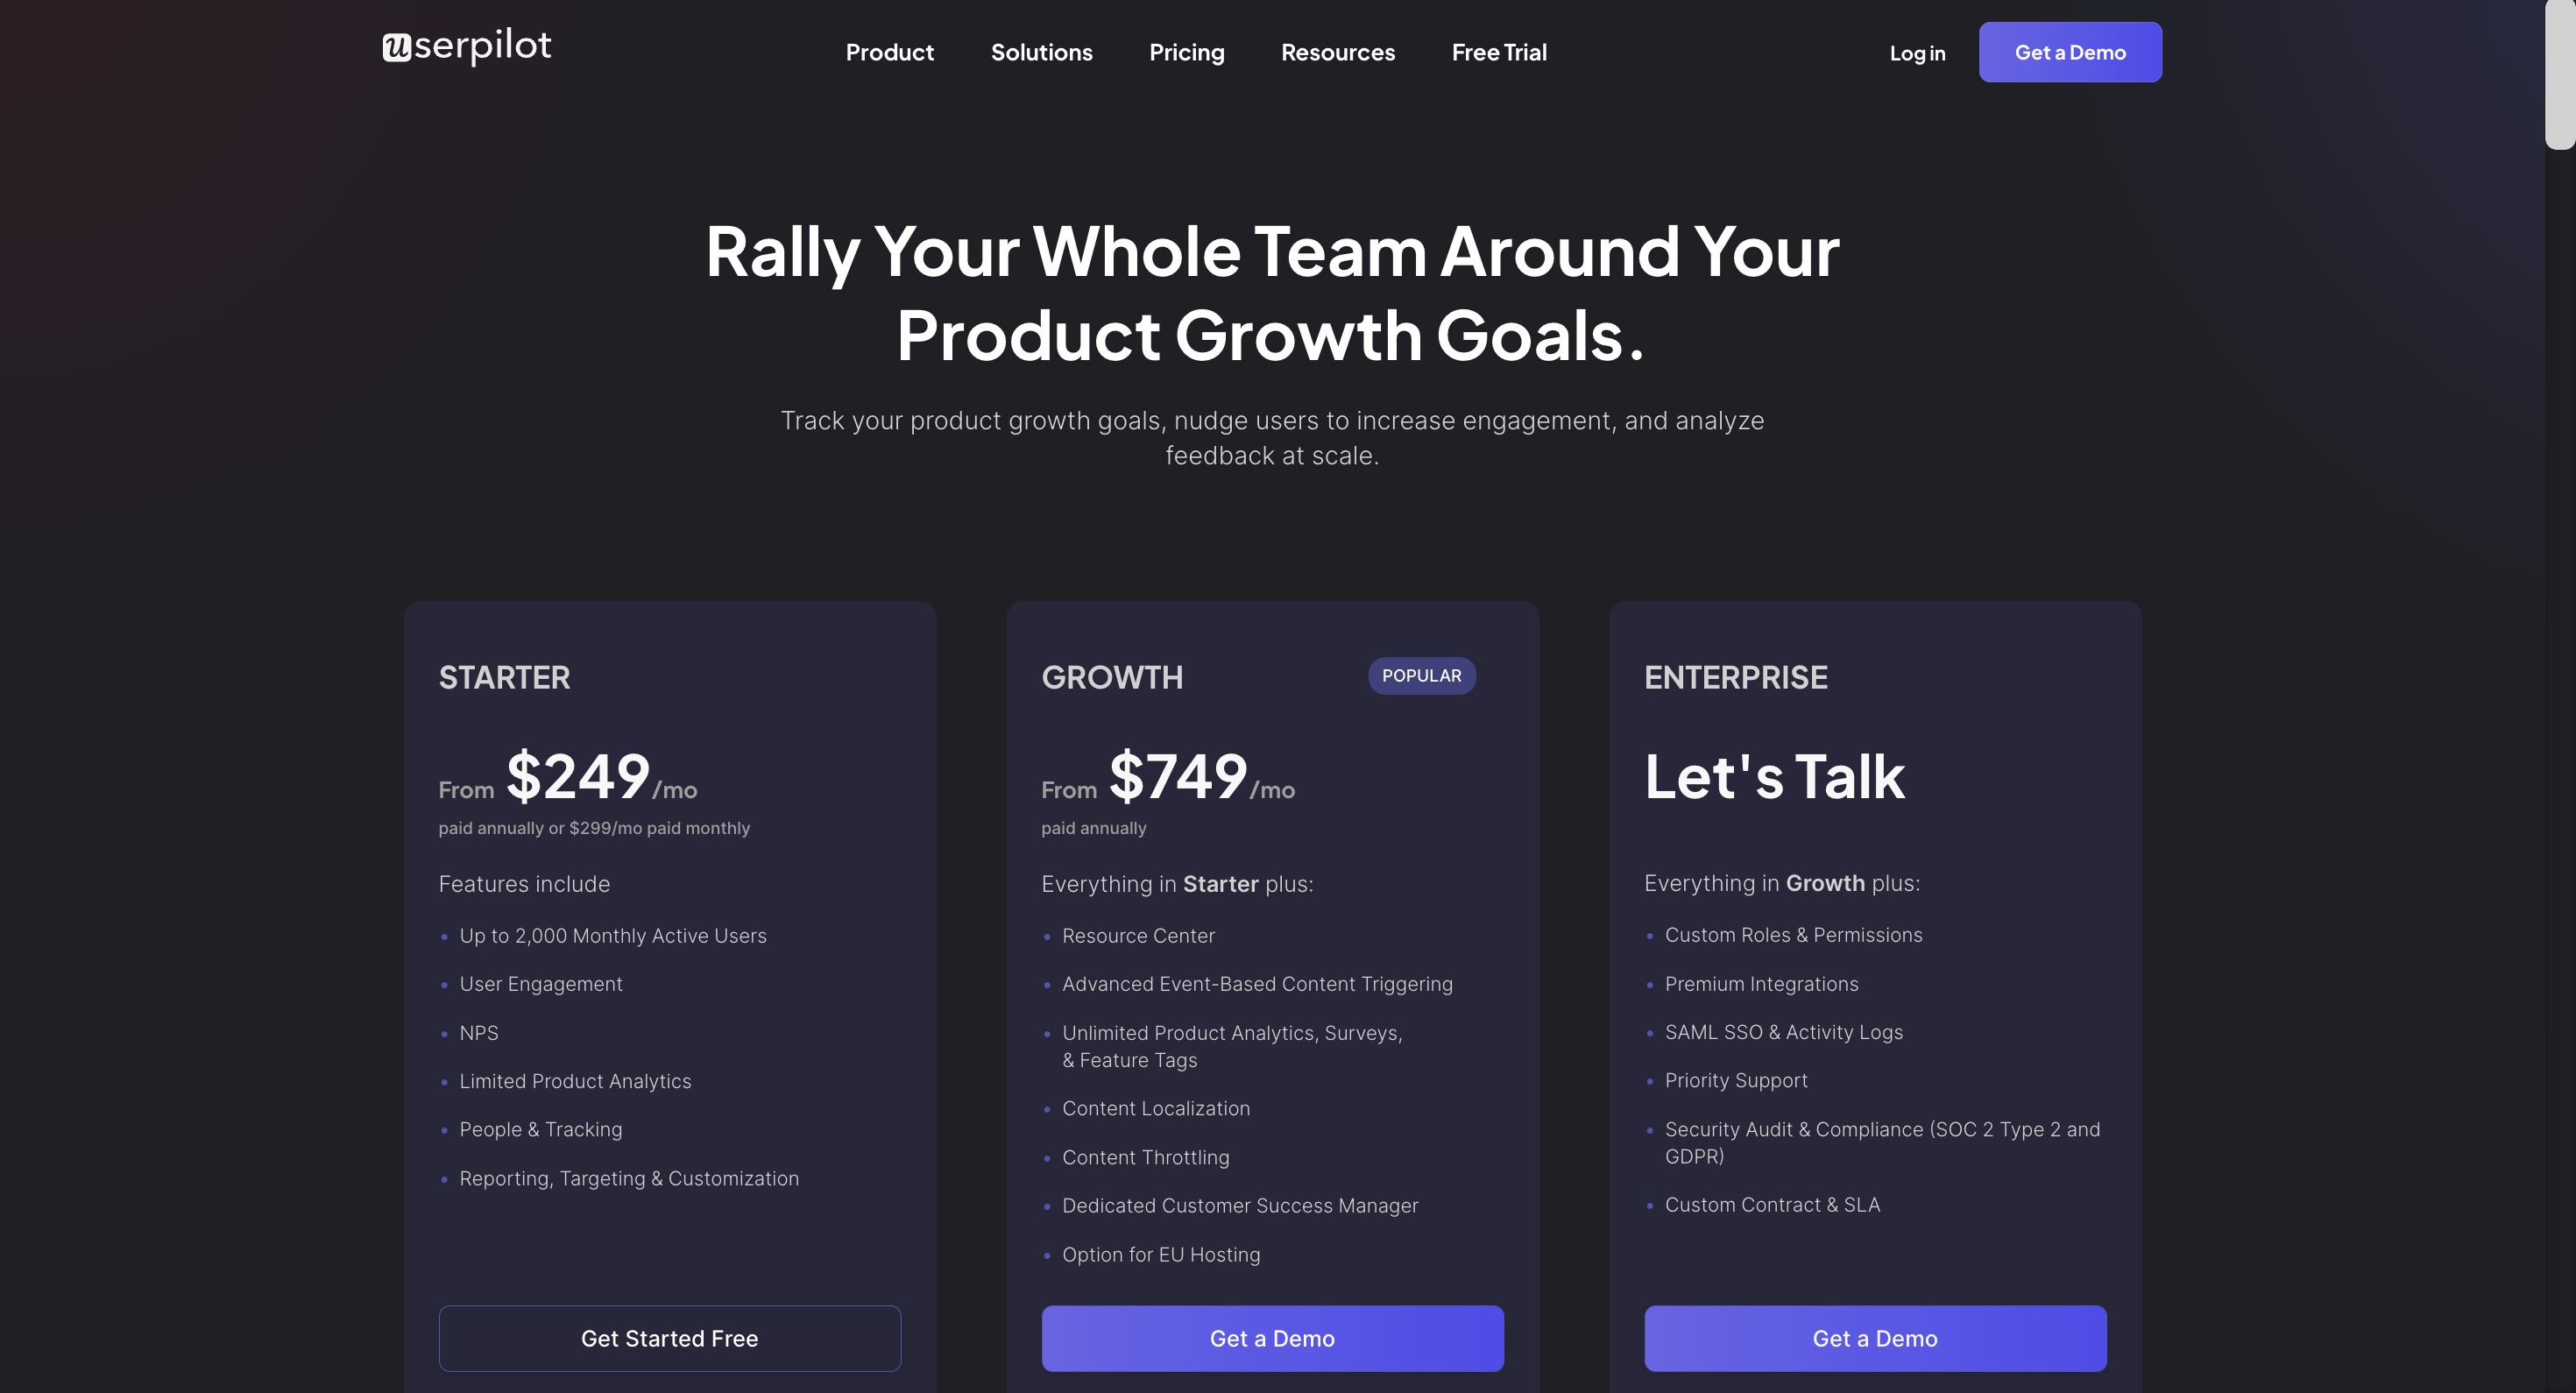
Userpilot’s transparent pricing ranges from $249/month on the entry-level end to an Enterprise tier for larger companies.
Furthermore, Userpilot’s entry-level plan includes access to all UI patterns and should include everything that most mid-market SaaS businesses need to get started.
Userpilot has three paid plans to choose from:
- Starter: The entry-level Starter plan starts at $249/month and includes features like segmentation, product analytics, reporting, user engagement, NPS feedback, and customization.
- Growth: The Growth plan starts at $749/month and includes features like resource centers, advanced event-based triggers, unlimited feature tagging, AI-powered content localization, EU hosting options, and a dedicated customer success manager.
- Enterprise: The Enterprise plan uses custom pricing and includes all the features from Starter + Growth plus custom roles/permissions, access to premium integrations, priority support, custom contract, SLA, SAML SSO, activity logs, security audit, and compliance (SOC 2/GDPR).
Conclusion
There you have it.
It should be easier now to make an informed decision whether GainsightPX is your go-to option for user engagement analysis. Ultimately, the best choice will depend on your product and current needs.
If you’re looking for a better alternative to GainsightPX for user engagement analysis, book a Userpilot demo today to experience firsthand how it can enhance your user experience and drive product growth!
Looking for a Better Alternative for User Engagement Analysis? Try Userpilot
