
Looking for the right product engagement metrics to track and see how well users are interacting with your product?
As a product manager, you need to track product engagement metrics as it allows you to measure user engagement and find ways to deliver more value to your daily active users.
In today’s article, we’ll be covering various product engagement metrics, five effective strategies to boost user engagement, and two of the best product analytics tools in the market.
Ready to get started? Let’s go!
Try Userpilot Now
See Why 1,000+ Teams Choose Userpilot

Summary of product engagement metrics
- Product engagement refers to the extent of interaction users have with your product.
- Product engagement metrics help you uncover whether users are getting value from your product and find ways to increase user retention and revenue through high engagement.
- Different methods exist to measure your product engagement scores, such as through NPS, CSAT, or churn surveys.
- If you’re a product manager, the 8 most essential product engagement metrics you should measure are the Product Engagement Score, Week 1 Engagement, Product Stickiness, Time in Product, Feature Adoption Rate, Retention Rate, and Churn Rate.
- Here are five effective strategies to boost user engagement:
- Create interactive walkthroughs and onboarding checklists to guide users properly and remove fatigue.
- Track in-app user engagement and create personalized flows to engage new users.
- Segment customers based on engagement level and identify inactive customers to create effective marketing strategies for distinct customer segments.
- Use gamification strategies to boost product engagement.
- Build an in-app help center to offer on-demand support and remove friction.
- Userpilot is one of the best tools to track user engagement metrics. It features an in-app help center, advanced segmentation, and in-app interaction monitoring functionality. Book a demo to see how!
What is product engagement in SaaS business?
Product engagement is a critical component in creating a successful SaaS business. It measures the level of interaction users have with your product or how users engage with your product.
Generally speaking, the more interactions users have with your product, the better it is for your business.
Measuring product engagement allows you to:
- monitor and observe user activity
- understand how users are spending their time within your product
- boost revenue through product-led growth
- improve product design and introduce in-demand features
Why is product engagement important?
Here are two reasons why measuring product engagement is important for your business.
It ensures that users are getting value from your product
A high product engagement means customers are interacting a lot with your product. This only happens when they’re getting value from your product.
High engagement leads to retention and drives revenue
High product engagement is the key to user retention. Engaged users keep using your product for a long time, which increases revenue and helps you minimize customer acquisition costs.
How to measure product engagement?
Different SaaS companies evaluate product engagement in different ways. There is no one specific way to measure it.
You must define what you’re trying to measure before you start using metrics. For example, a business might use feature adoption as a metric for product engagement while others create their unique engagement measures.
NPS (Net Promoter Score), CSAT (Customer Satisfaction Score), user retention, and user churn are some examples of popular engagement metrics.
8 Important product engagement metrics that PMs should track
When it comes to measuring user engagement, here are eight essential metrics that product managers can track.
Product engagement score
Product engagement score helps you understand how users quantitatively interact with your product.
It combines three aspects of user engagement:
- Adoption Rate: This is the average number of key events adopted by active visitors and users.
- Product Stickiness Rate: This is the average ratio of the number of DAUs (daily active users) to the number of WAUs (weekly active users) or MAUs (monthly active users).
- Growth Rate: This is the ratio of new and renewed accounts or visitors to the number of churned accounts or visitors within a given period.
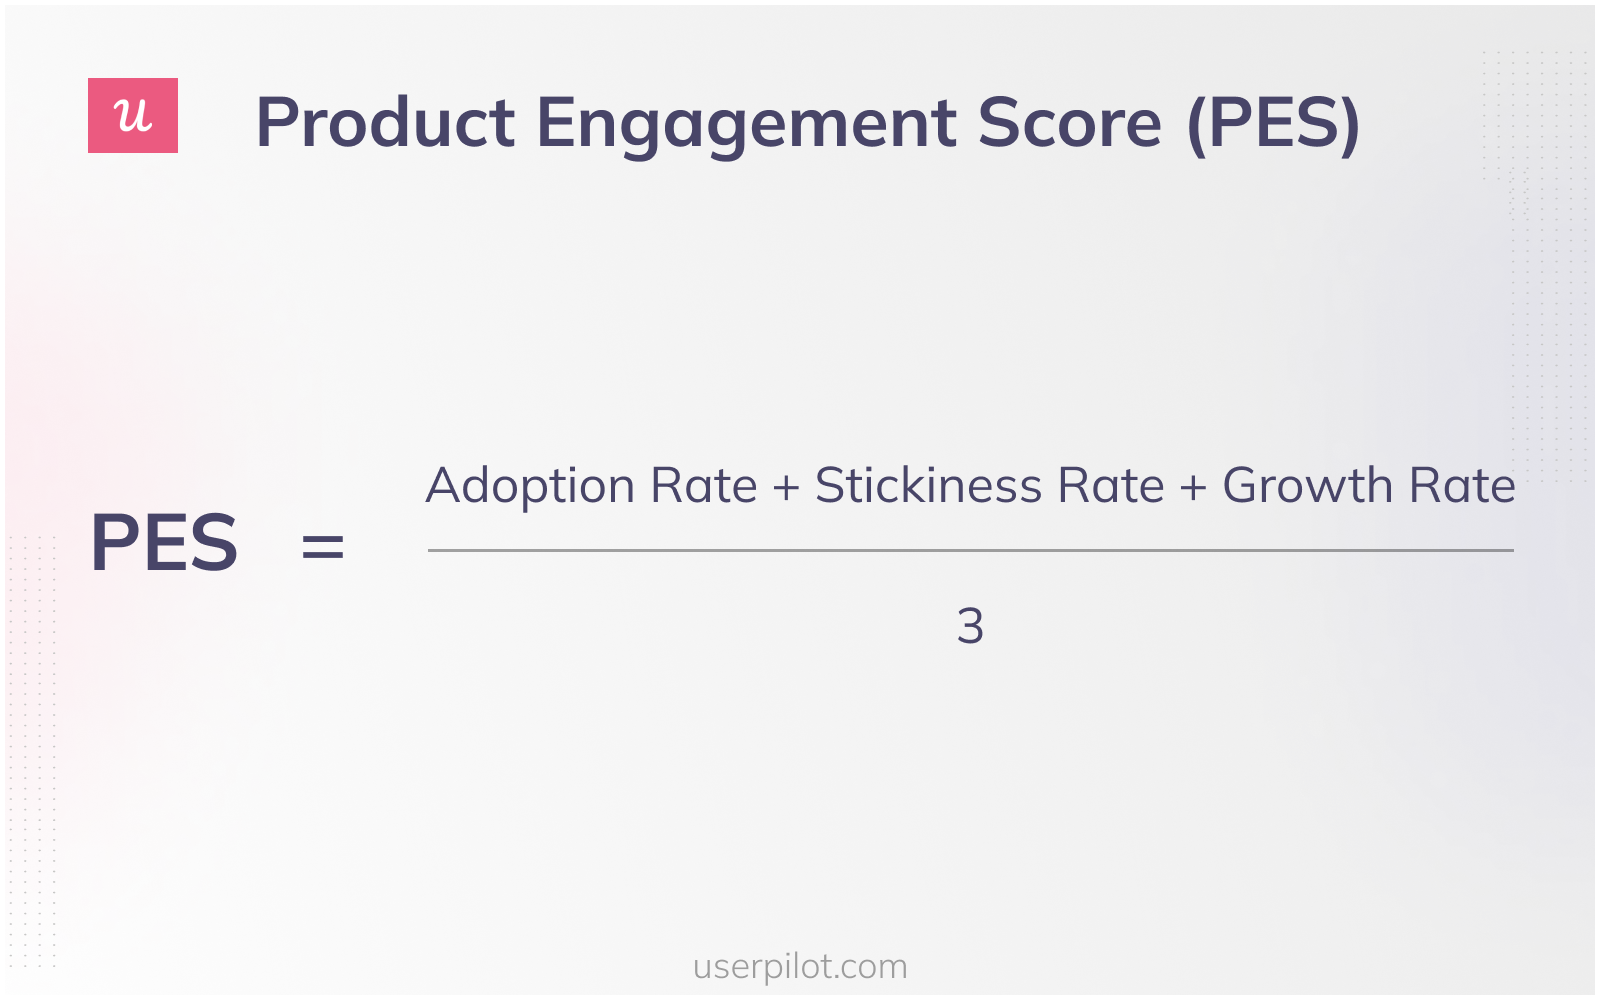
To measure the product engagement score, you need to find out the three rates mentioned above and divide them by 3.
Week 1 engagement
Week 1 engagement is one of the important user engagement metrics that measure user interaction with your product within the first week of the trial or paid usage.
Usually, if a user isn’t engaging with your product within the first week, they are likely to churn and not reach full user activation. This can be due to several reasons: perhaps there were issues with the onboarding process, lack of customer support, missing features, or a combination of all three.
Customer success managers play a vital role in addressing these engagement challenges, as they proactively reach out to users during their first week while providing personalized onboarding assistance.
Monthly active users/Weekly active users (Product stickiness)
Product stickiness is one of the most important product engagement metrics that essentially refers to users’ tendency to keep returning to your product because they find it valuable and engaging.
This metric drives growth by increasing customer retention, providing account expansion opportunities and increasing CLV (customer lifetime value).
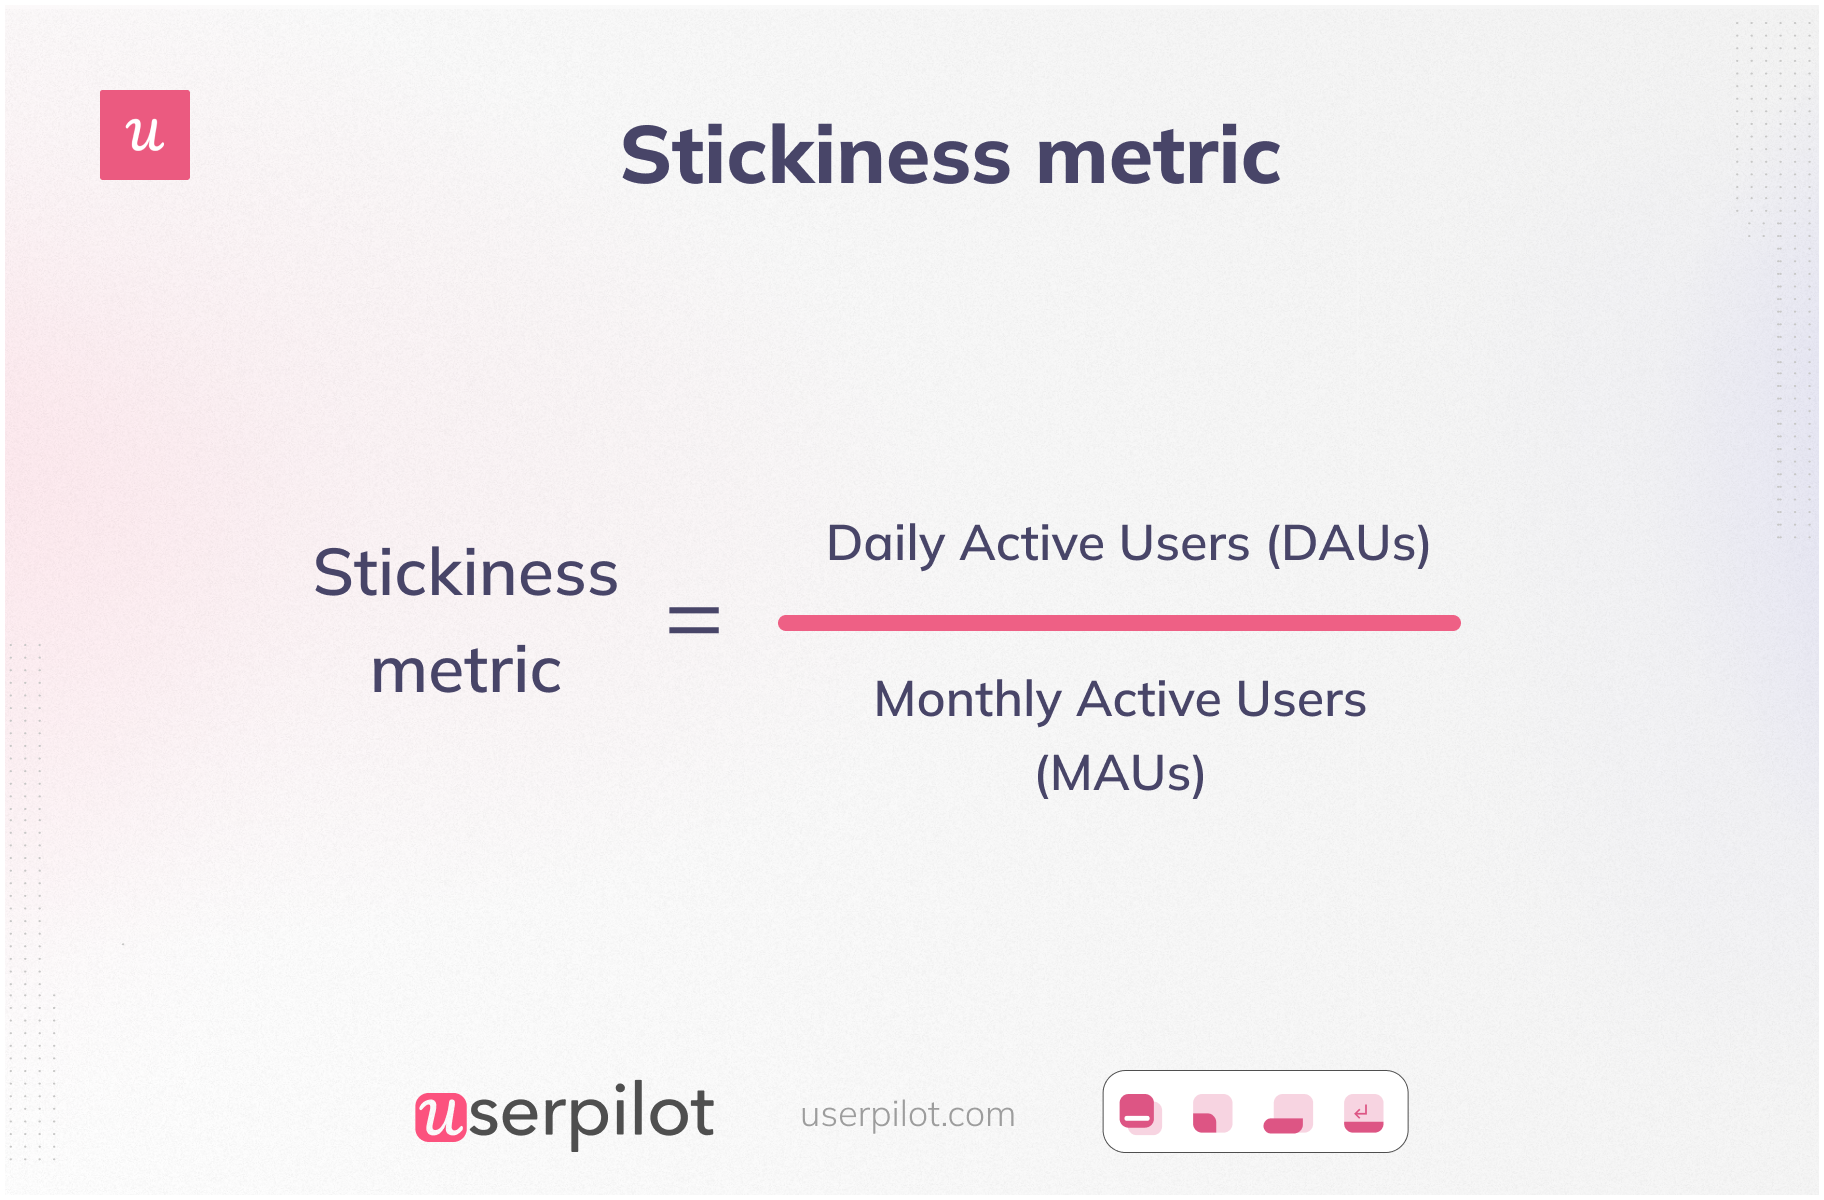
The DAUs/MAUs ratio is one of the key product metrics used to measure product stickiness. For a given period, you need to find out the number of daily users and monthly users and then divide them.
Time in product
One of the core product engagement metrics is the time in the product. This refers to the average session duration an active user spends with your product. If a user is truly receiving value, they will use it for longer periods.
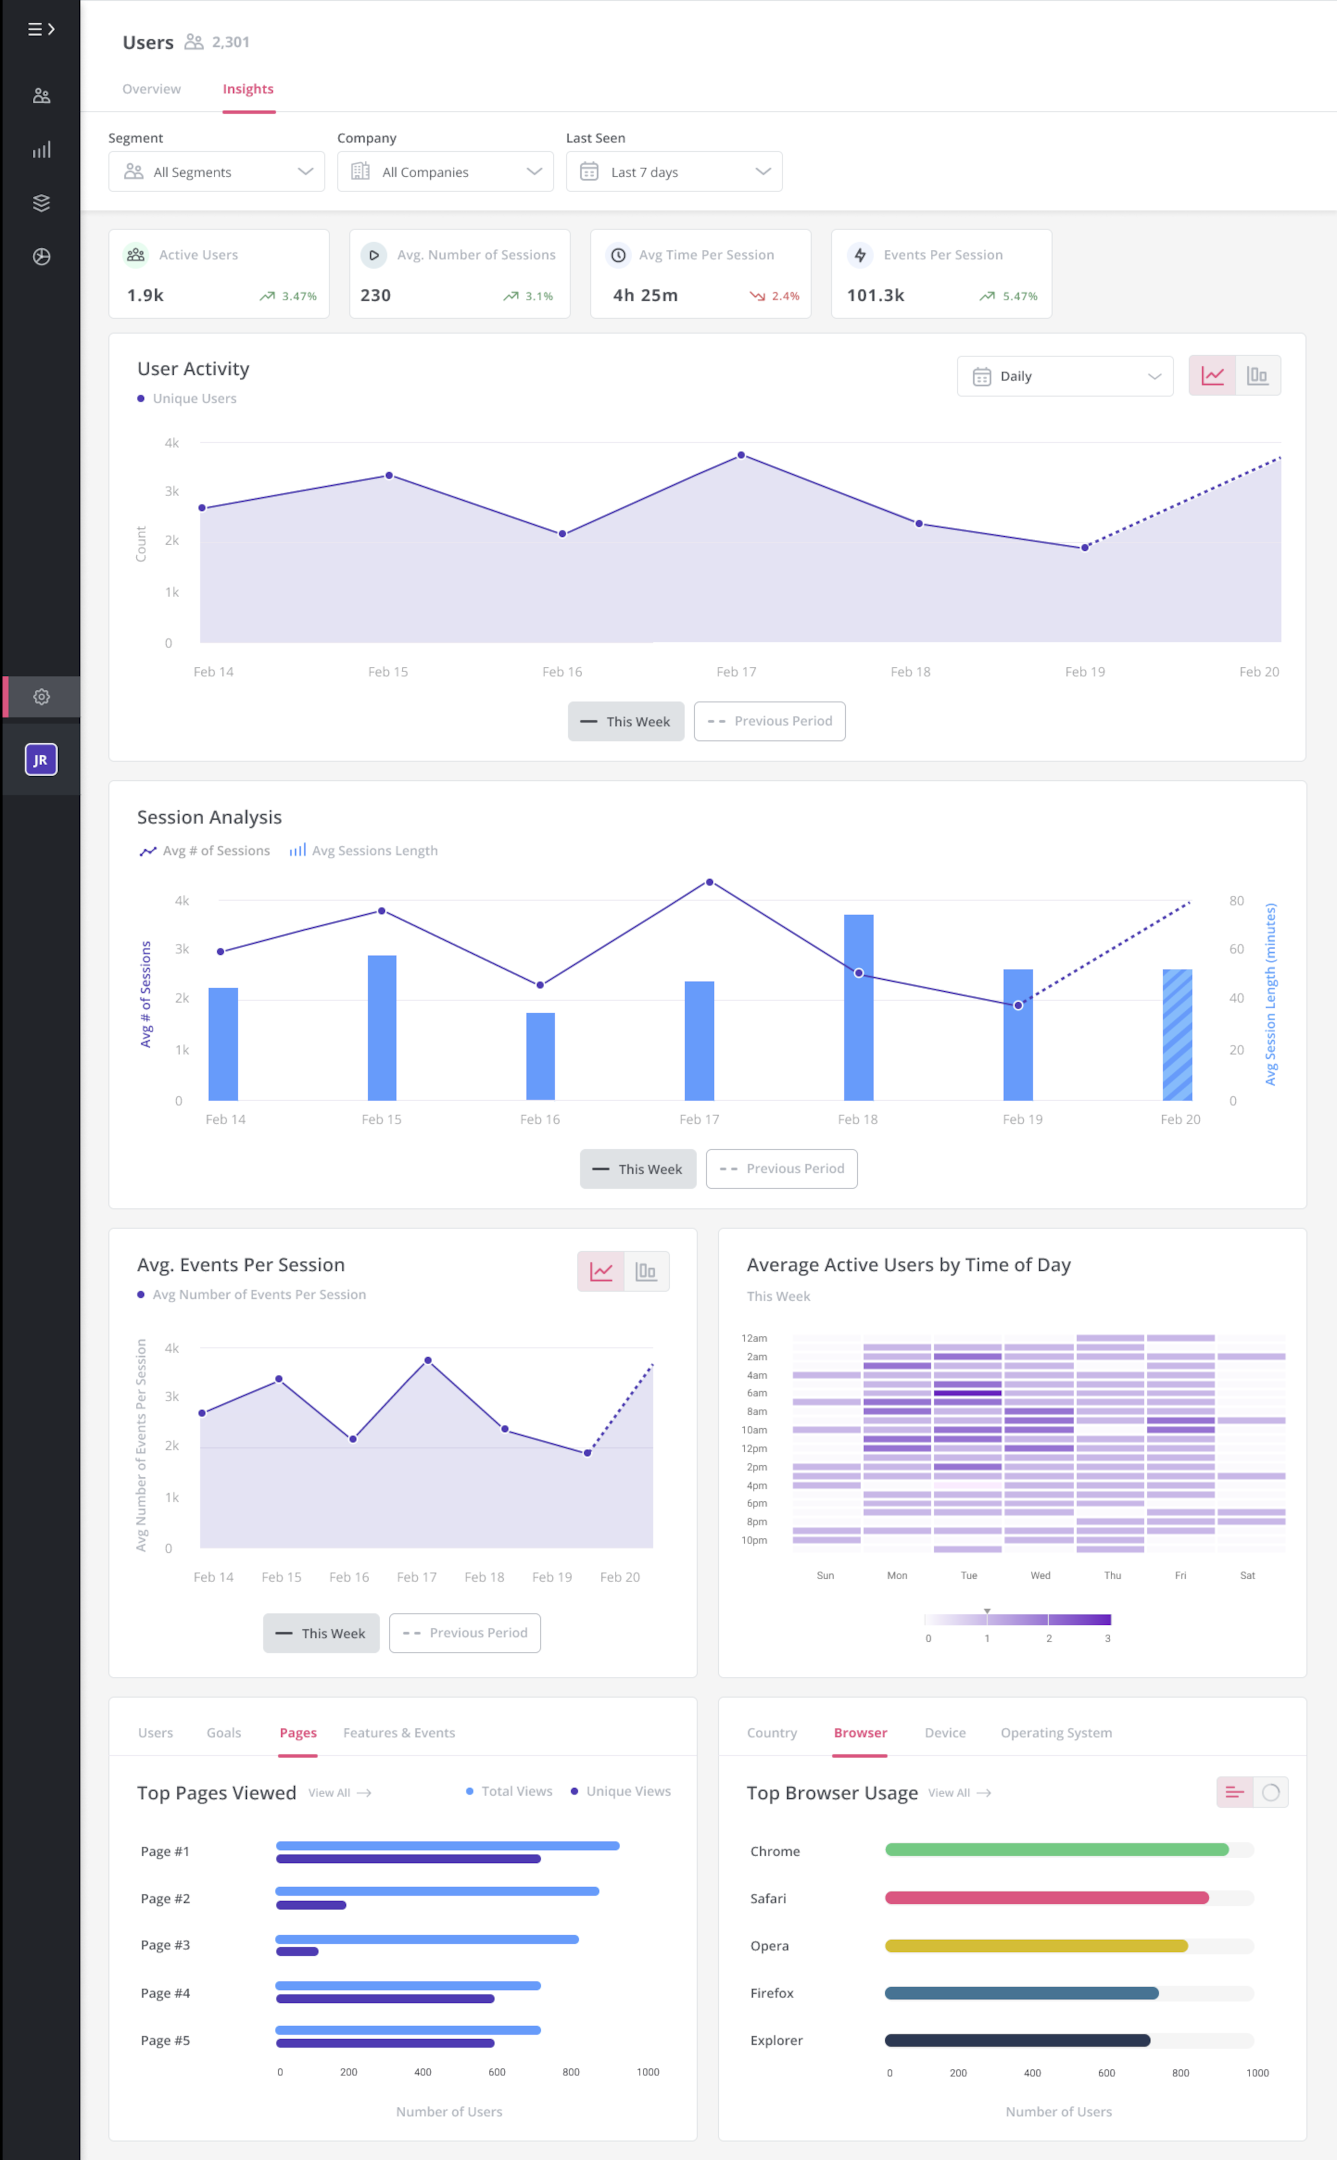
Of course, this also depends on the nature of the product. So your best bet would be to observe your users for a while to create a benchmark and then compare the data with individual users.
Feature adoption rate
Feature adoption is when your customers start using a product’s feature(s). You can track this by recording the number of times users have used a specific feature.
A high feature adoption rate indicates a popular feature. If most of your users are actively interacting with a certain feature, there are good reasons for it.
On the other hand, features that have low adoption rates must be monitored. You can either improve them or cut them out entirely.
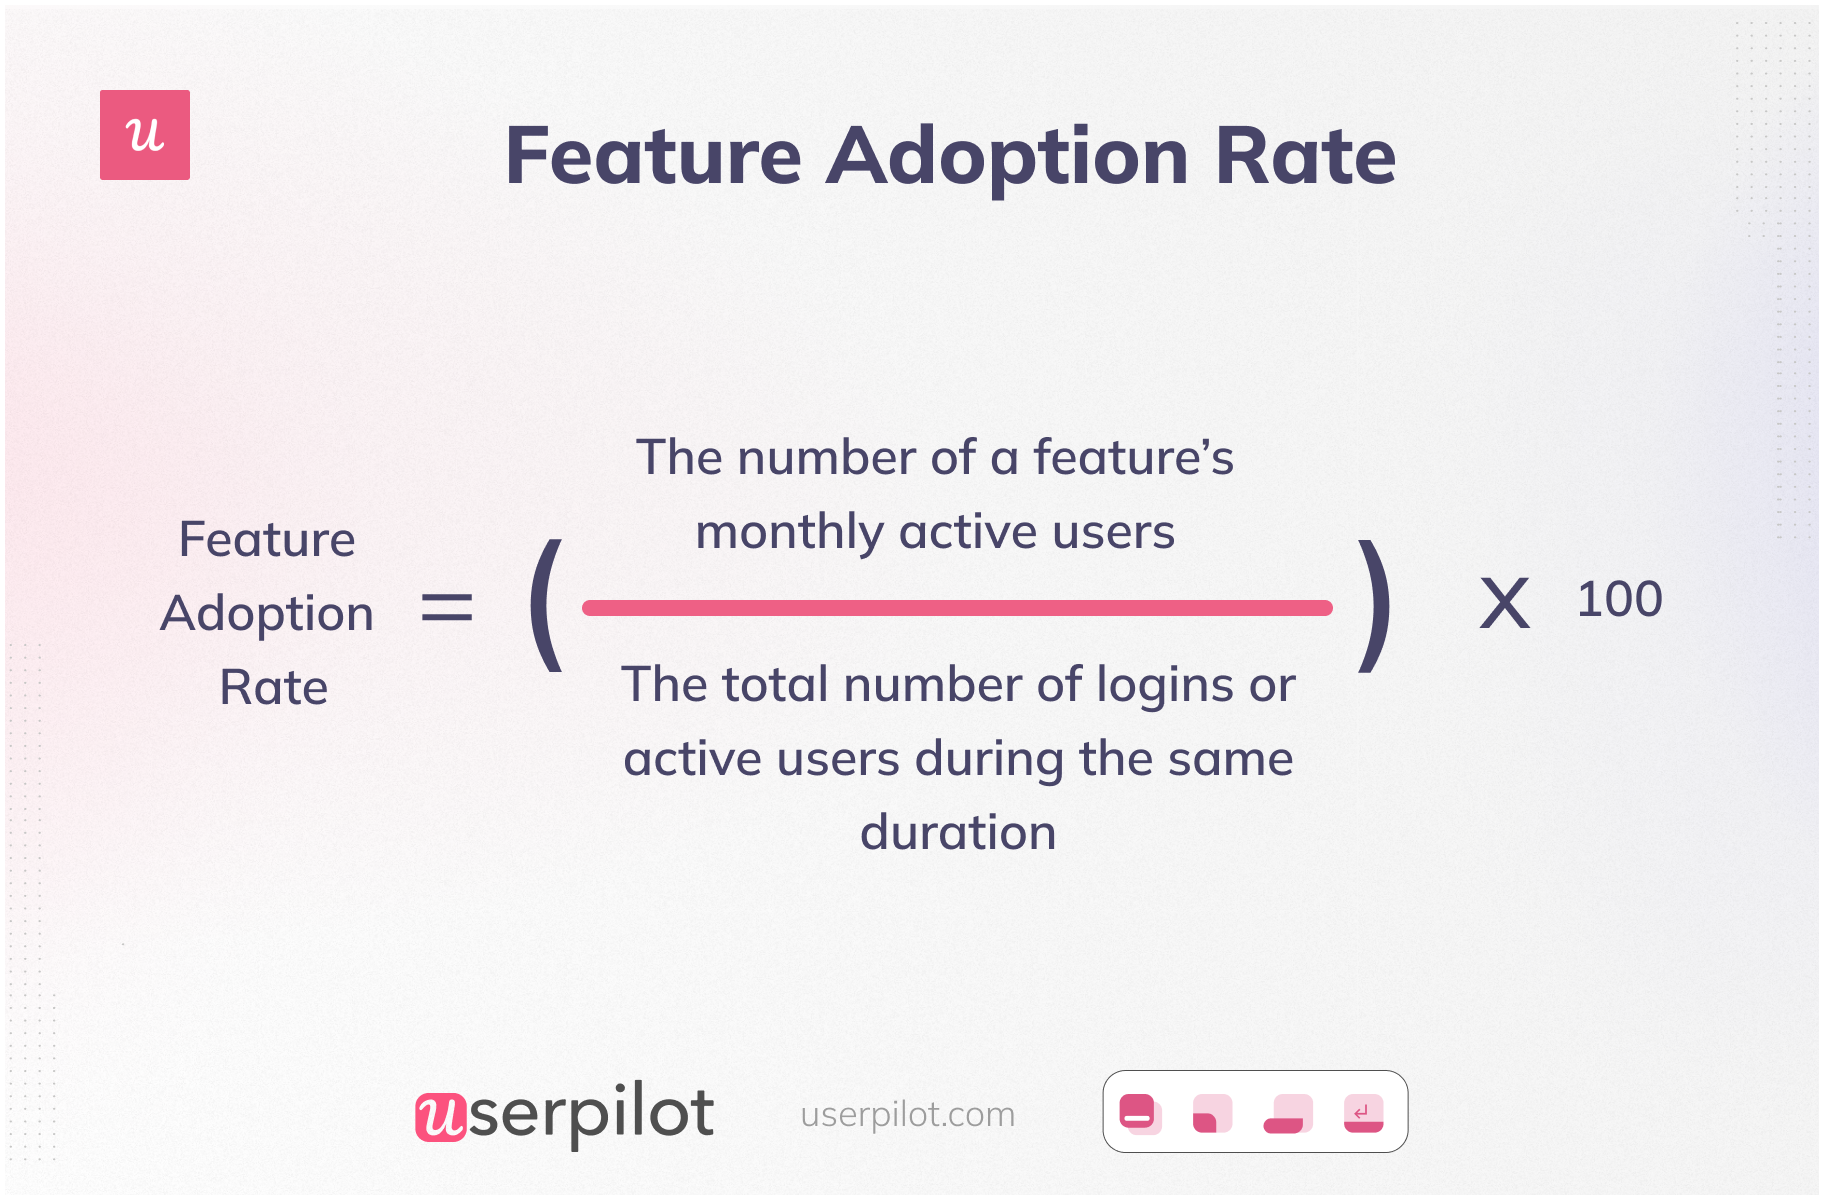
To calculate this rate, you must choose the features you want to measure and a timeframe. Then, you must determine the number of monthly active users for the feature and divide it by the total number of user logins.
Retention rate
Customer retention rate is an important metric for product and customer success teams. It refers to the percentage of customers who stick with your product for a long time. These are users who keep renewing their subscriptions and actively engage with your product.
A high retention rate highlights that users consistently find value in your product, so they keep using it. When you focus on improving retention, you’re more likely to bring in new customers, keep your costs low, increase ROI, and significantly boost user loyalty.
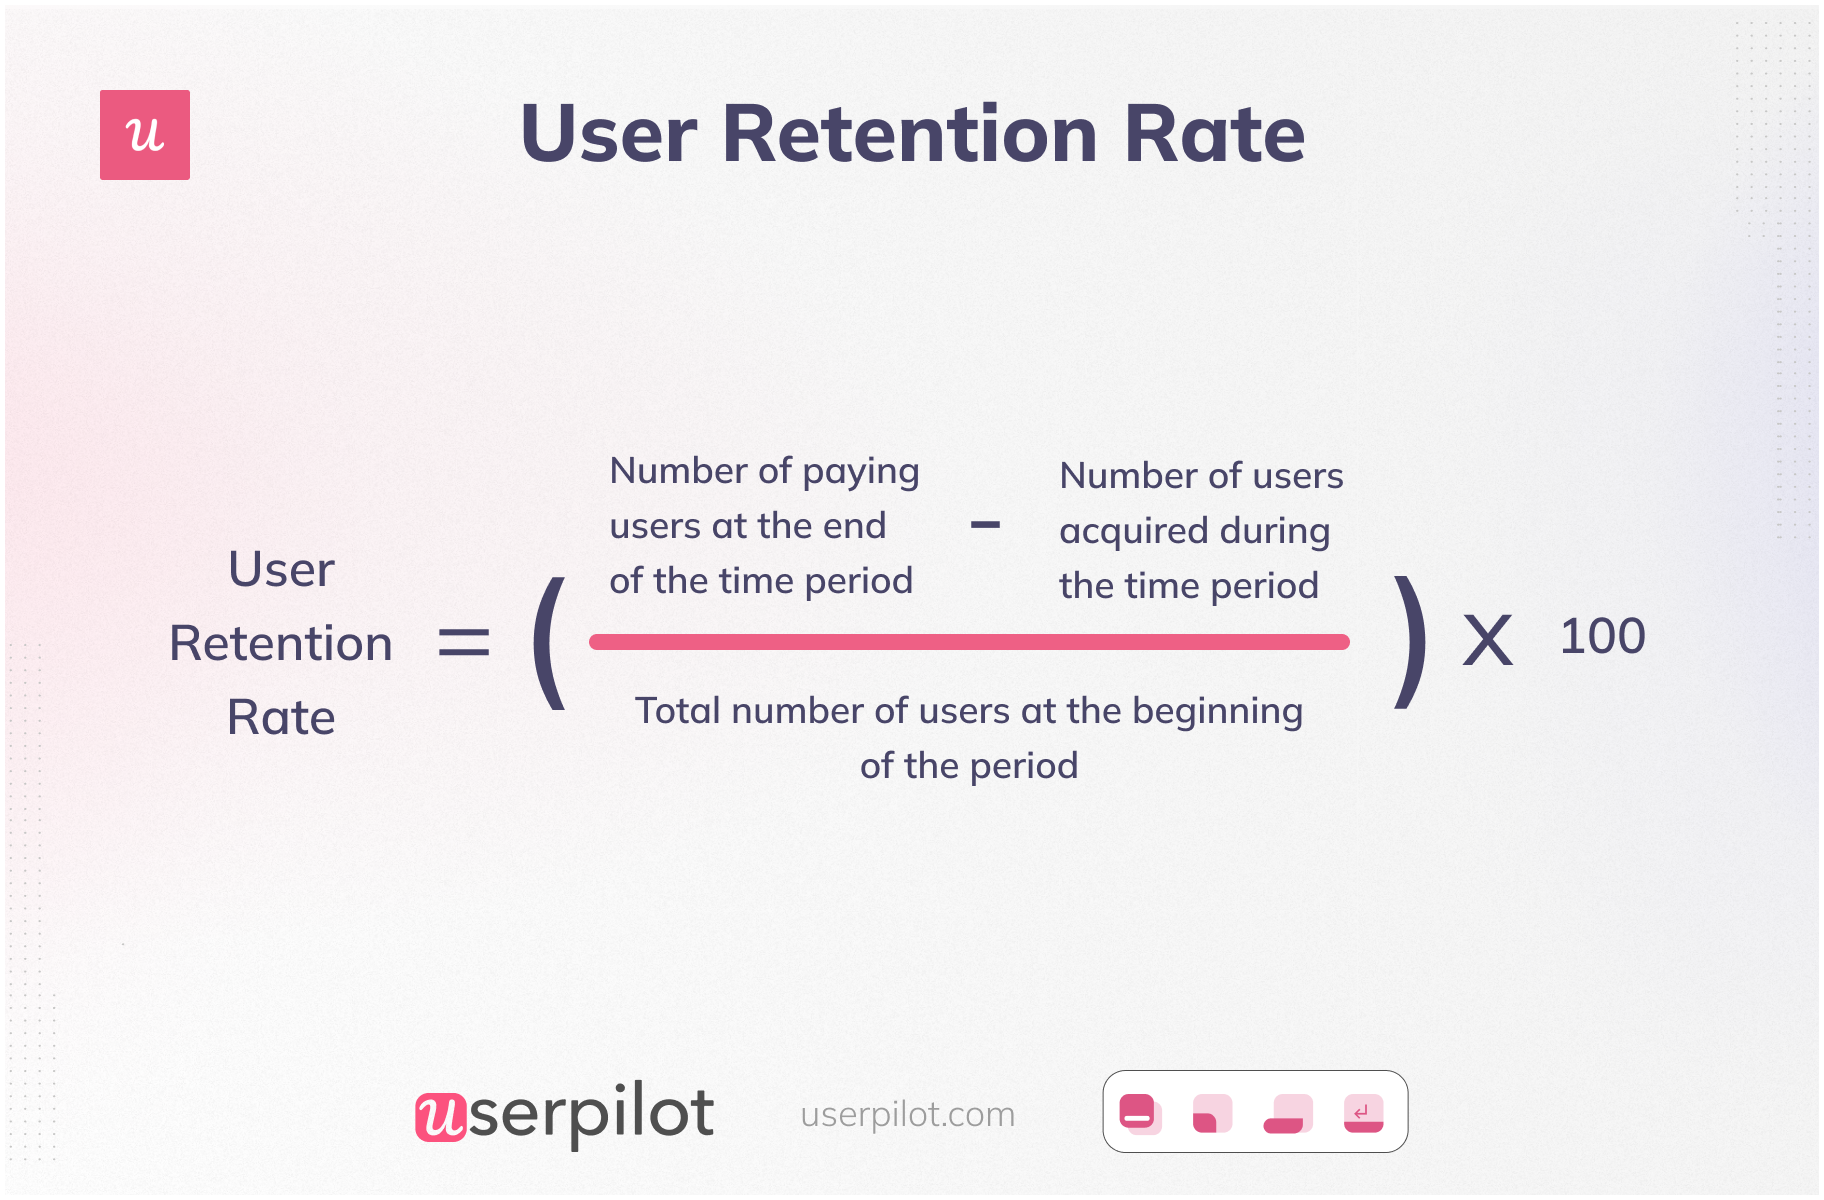
To calculate the customer retention rate, you must first select the timeframe. You can then calculate the retention rate as the total number of paying customers you have at the end of the period divided by the total number at the beginning.
Churn rate
The churn rate refers to the percentage of users that leave your business over a given timeframe.
A high churn rate indicates decreased engagement, as users stop using your product entirely. On the other hand, a low churn rate indicates high user engagement. They are finding continued value in your product and are likely to remain your loyal customers.
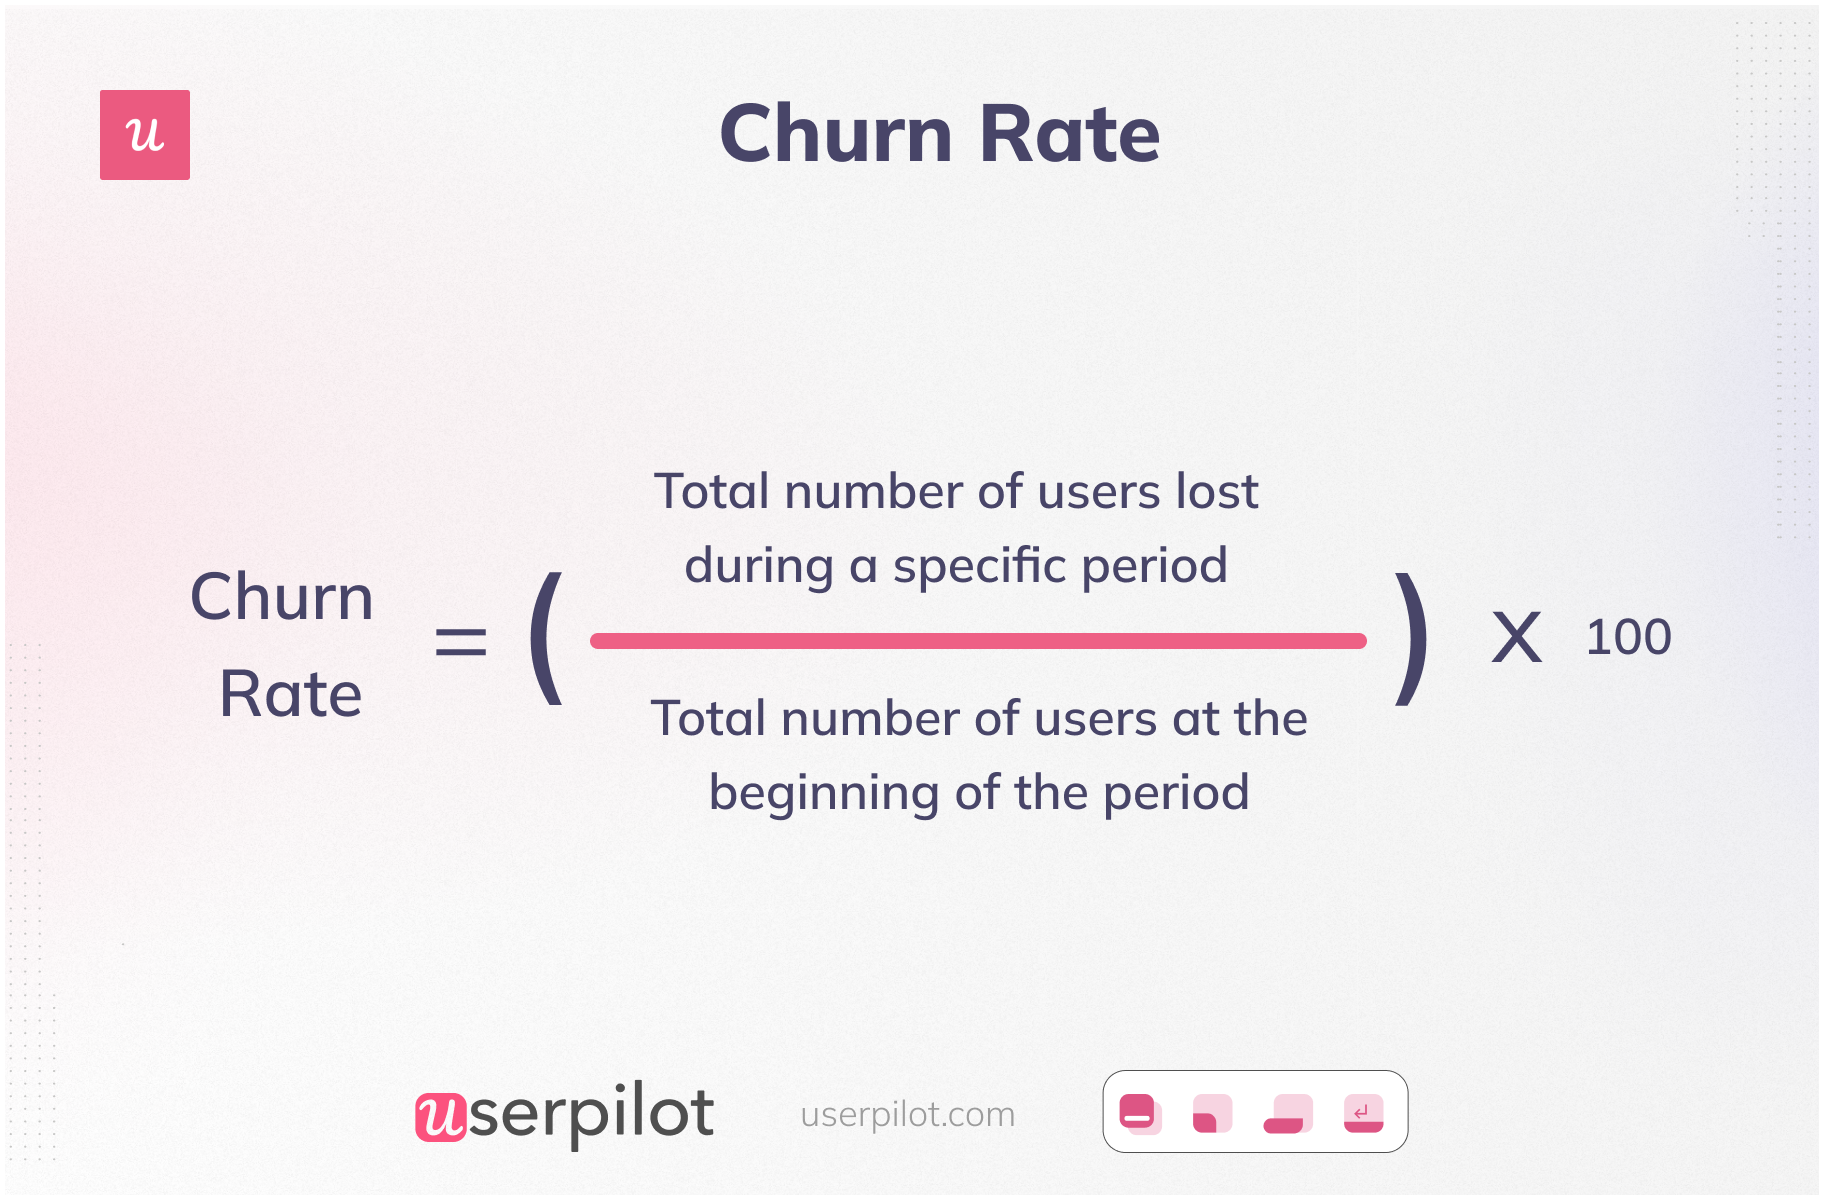
To calculate the customer churn rate, you need to first select a timeframe. Then, you determine how many users churn during this period and divide this number by the total number of customers at the beginning of the period.
5 Effective strategies to boost user engagement
Here are the five most effective strategies to boost user engagement.
Create interactive walkthroughs and onboarding checklists to guide users properly
The first step you can take to improve product engagement is to create interactive walkthroughs and onboarding checklists.
Interactive walkthroughs guide users, so they don’t get confused and lost with your product. Avoid lengthy product tours that overwhelm users with information. Instead, make it short and simple and try to cover all the basic features.
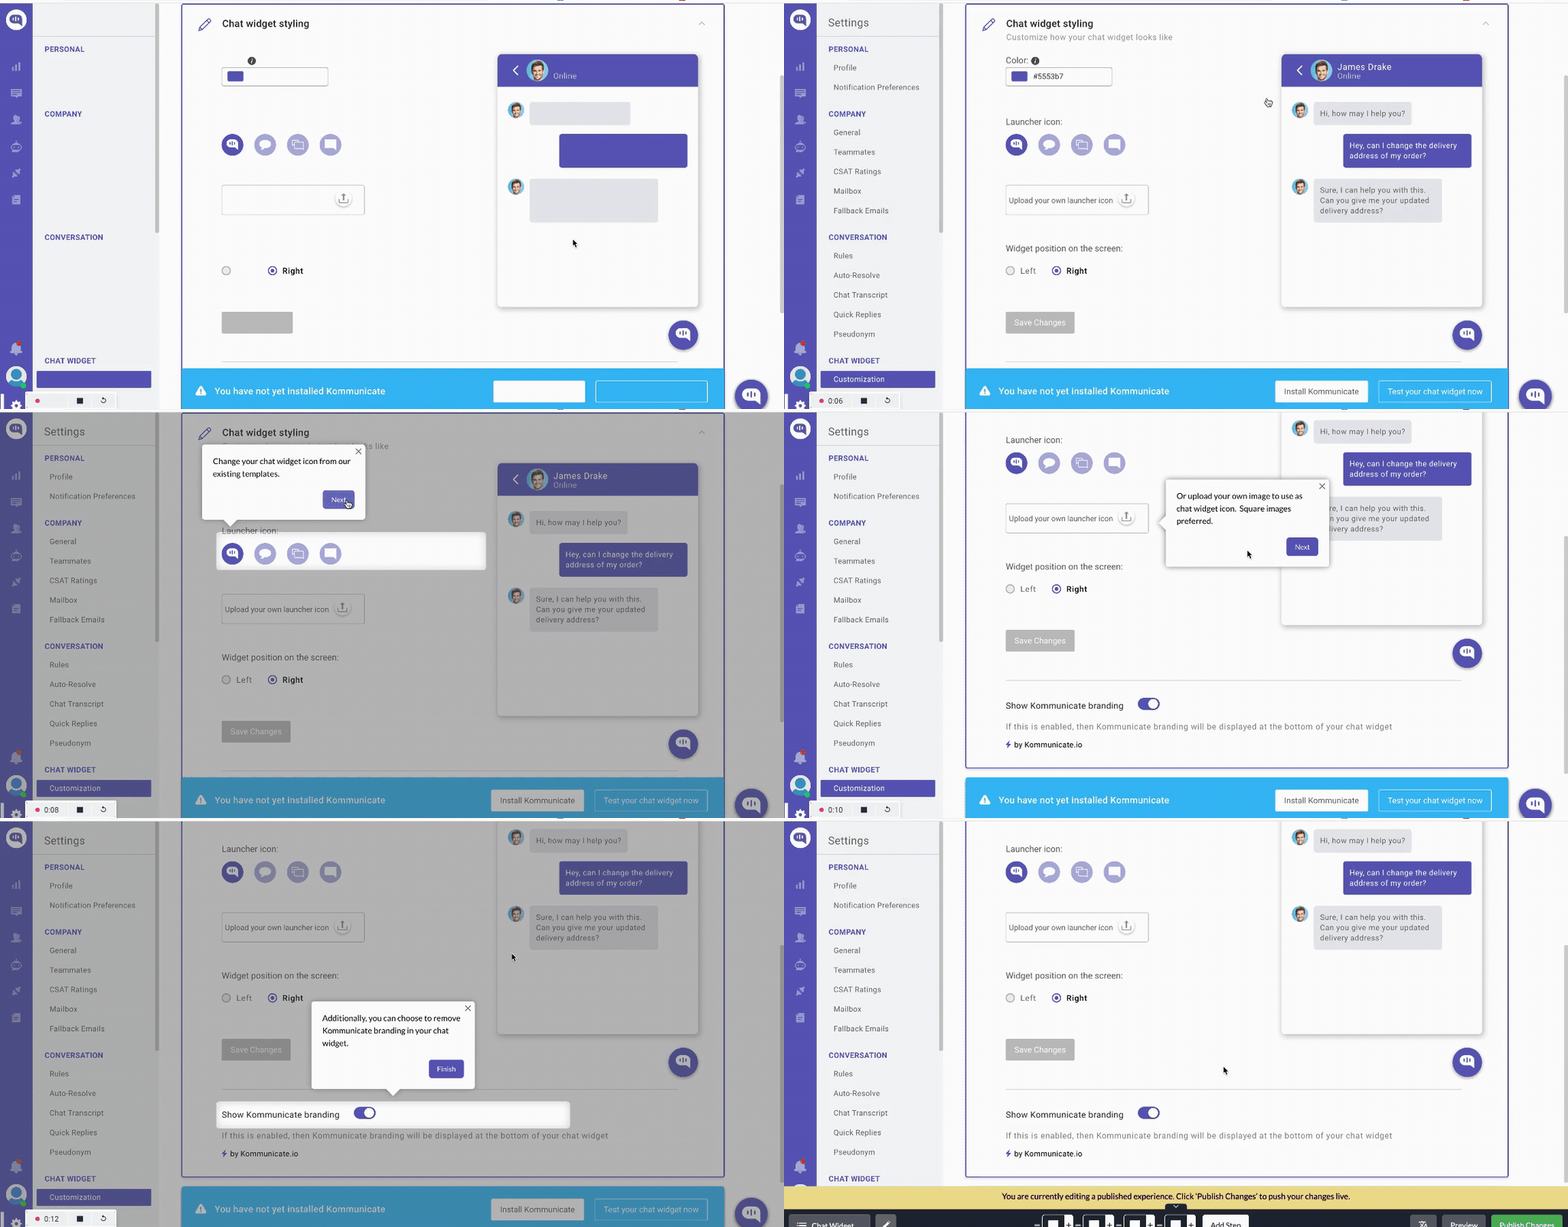
An onboarding checklist consists of the steps a user can take to achieve full product activation. For example, users are encouraged to use a feature and then share it on social media as part of the product tutorial.
Track in-app user engagement and create personalized flows
Another way to improve your engagement score is by tracking how customers are spending their time with your product. This allows you to create personalized flows for different users, taking into account the different use cases of your customers.
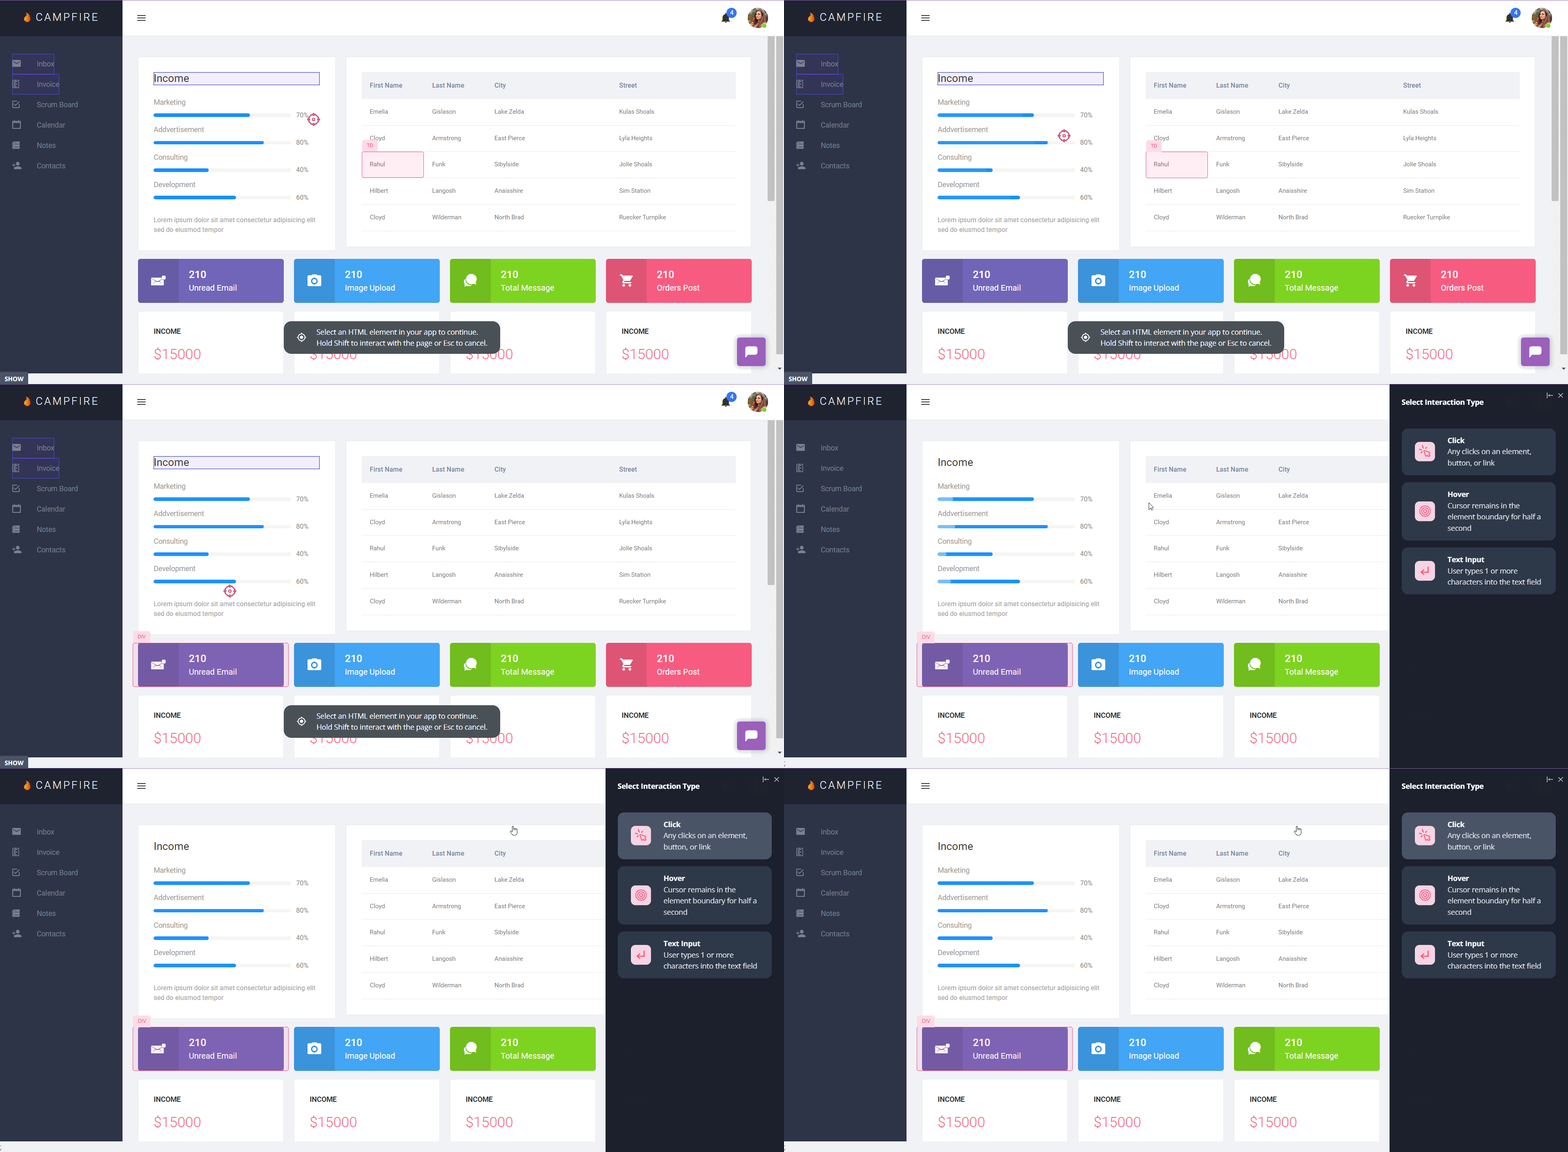
With Userpilot, you can easily track all sorts of interactions within the app, such as clicks, hovers, and even text inputs.
Segment customers based on engagement level and identify inactive customers
Tracking user activity allows you to segment your customers based on different engagement levels. You can discover your power users (those who have reached full product activation), inactive users at risk of churning, and everyone else in between.
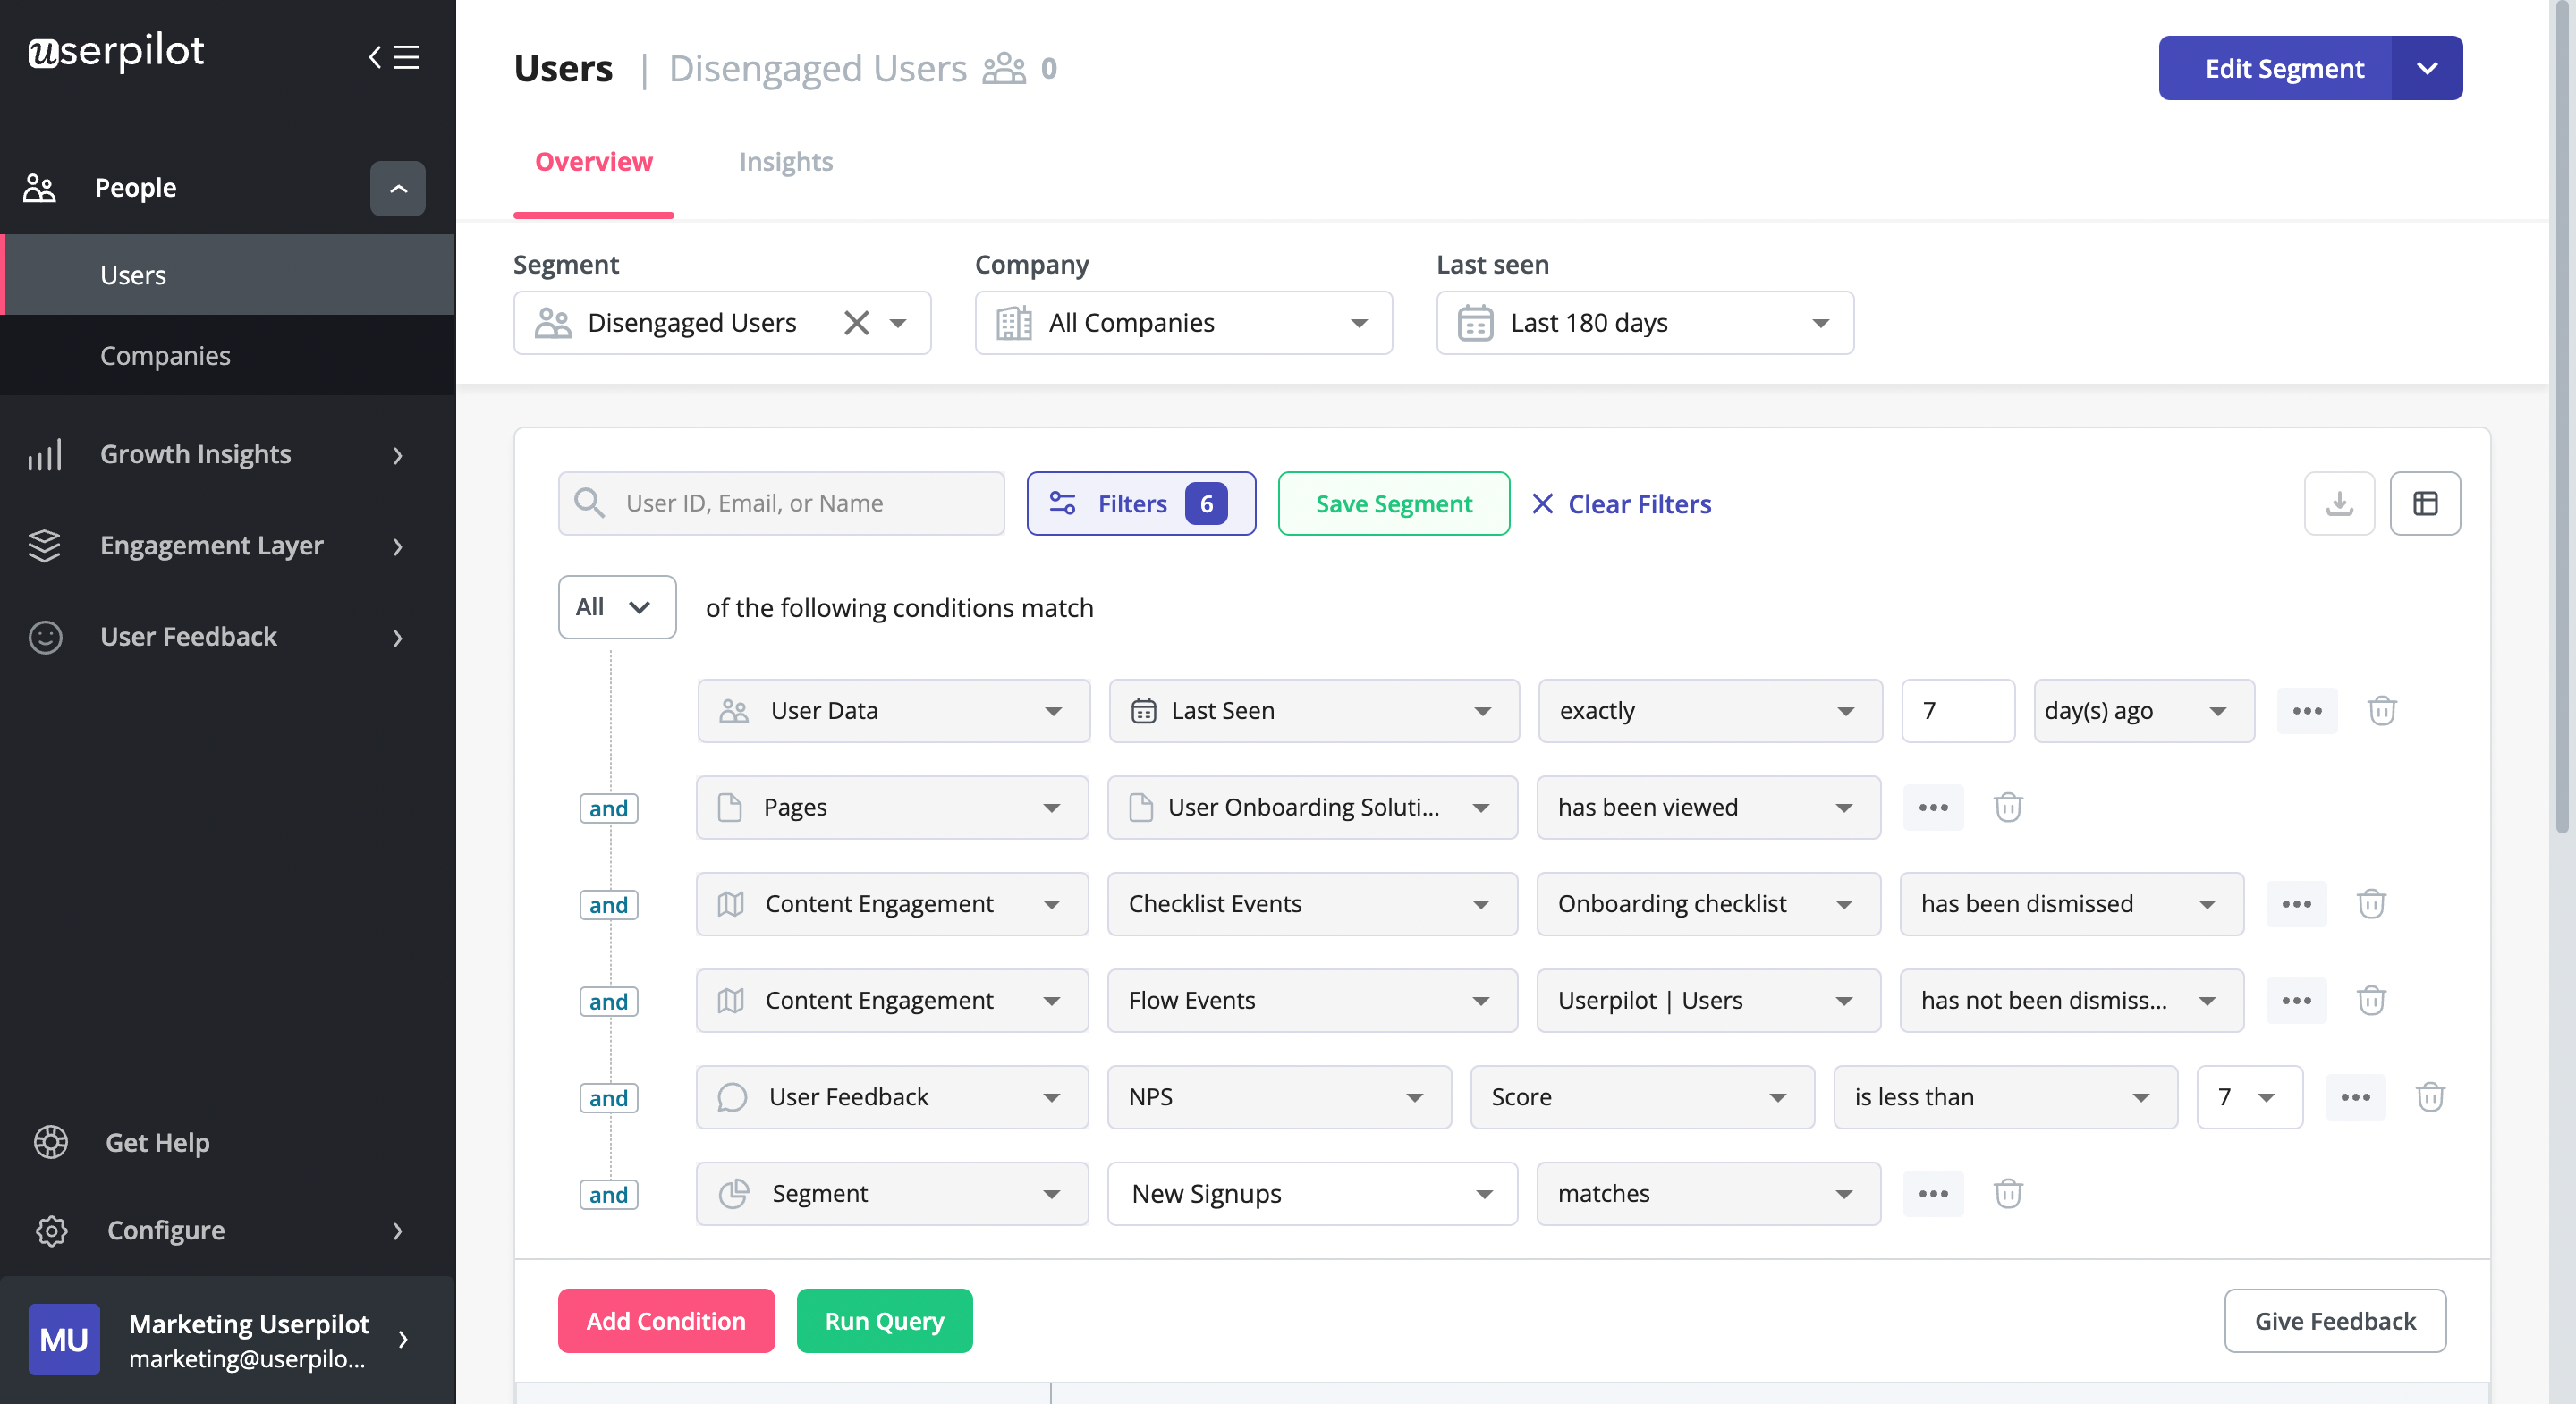
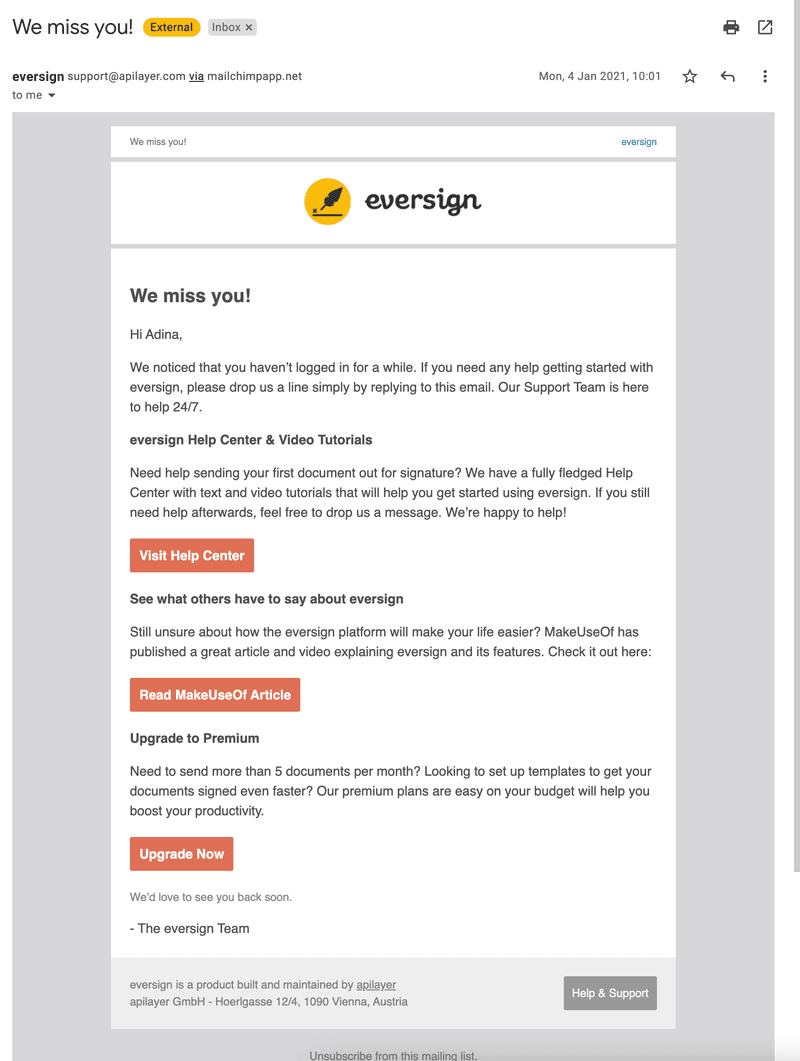
You can then create different marketing strategies (email or ad campaigns) that focus on retaining your most loyal, paid accounts and attempt to win back inactive users, as recovered accounts can be a great indicator of success.
Here’s an example of a re-engagement email by Eversign.
Use gamification strategies to boost product engagement
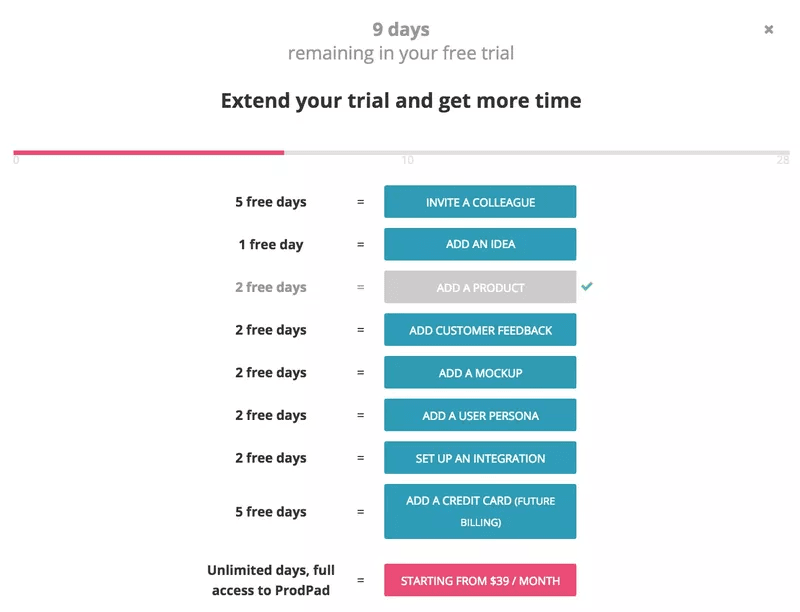
Gamification refers to introducing fun elements to encourage and motivate users to fulfill different tasks. It usually includes a reward or an incentive that guides users to accomplish a goal.
The most common reward elements include points, badges, leaderboards, and discount coupons.
Here’s how Prodpad uses gamification to help users find value in their product.
Build an in-app help center to offer on-demand support and remove friction
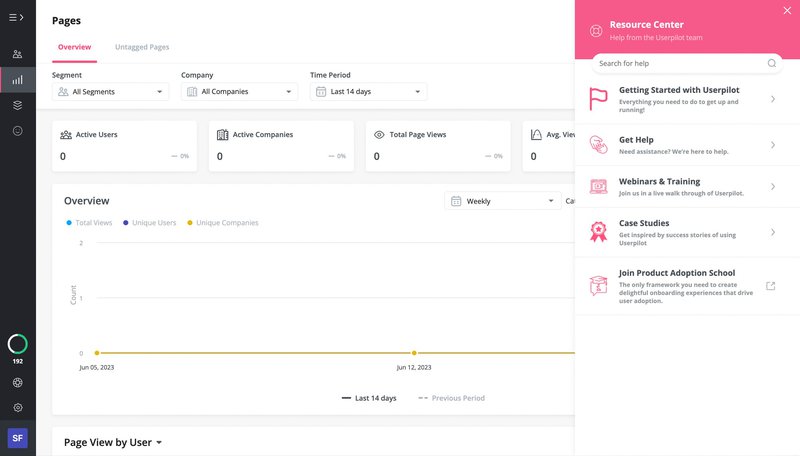
In-app help centers are extremely helpful in improving your engagement model (and your entire SaaS business model) and thus, customer success.
For starters, it takes the pressure off your support teams, leaving them to deal with more complex issues. The resource center helps users find on-demand solutions to commonly occurring problems and increases the time they spend on your product.
This reduces friction significantly and allows users to quickly resolve their problems, which in turn reduces their frustration and improves the overall satisfaction of your user base.
Best tools to track user engagement metrics
Two of the best tools in the market to track these specific metrics are Userpilot and Appcues.
Userpilot
Userpilot is a dedicated product engagement tool with a lot of intelligent features. Its key features include an in-app help center, advanced customer segmentation, and an in-app interaction tracker.
These features focus on engaging users with personalized in-product experiences without needing to code, allowing you to drive user activation, feature adoption, and retention significantly.
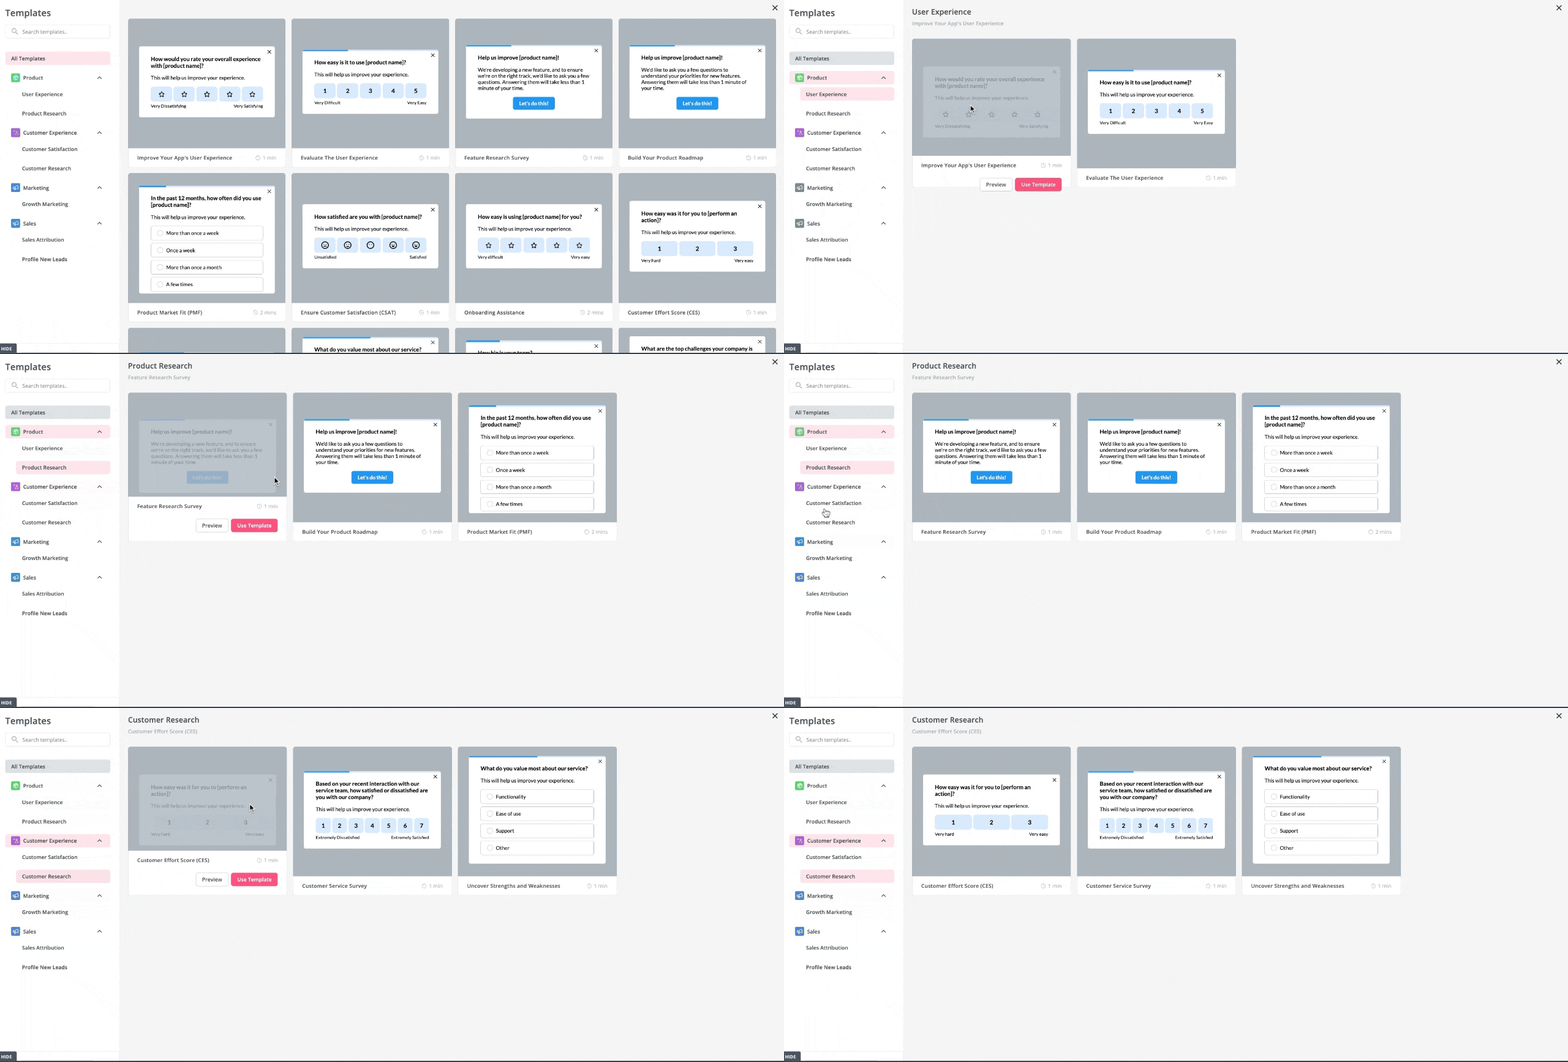
Equipped with numerous microsurvey templates, you can easily launch surveys such as CSAT that help you measure engagement, calculate your scores, and understand the overall user engagement status of your product.
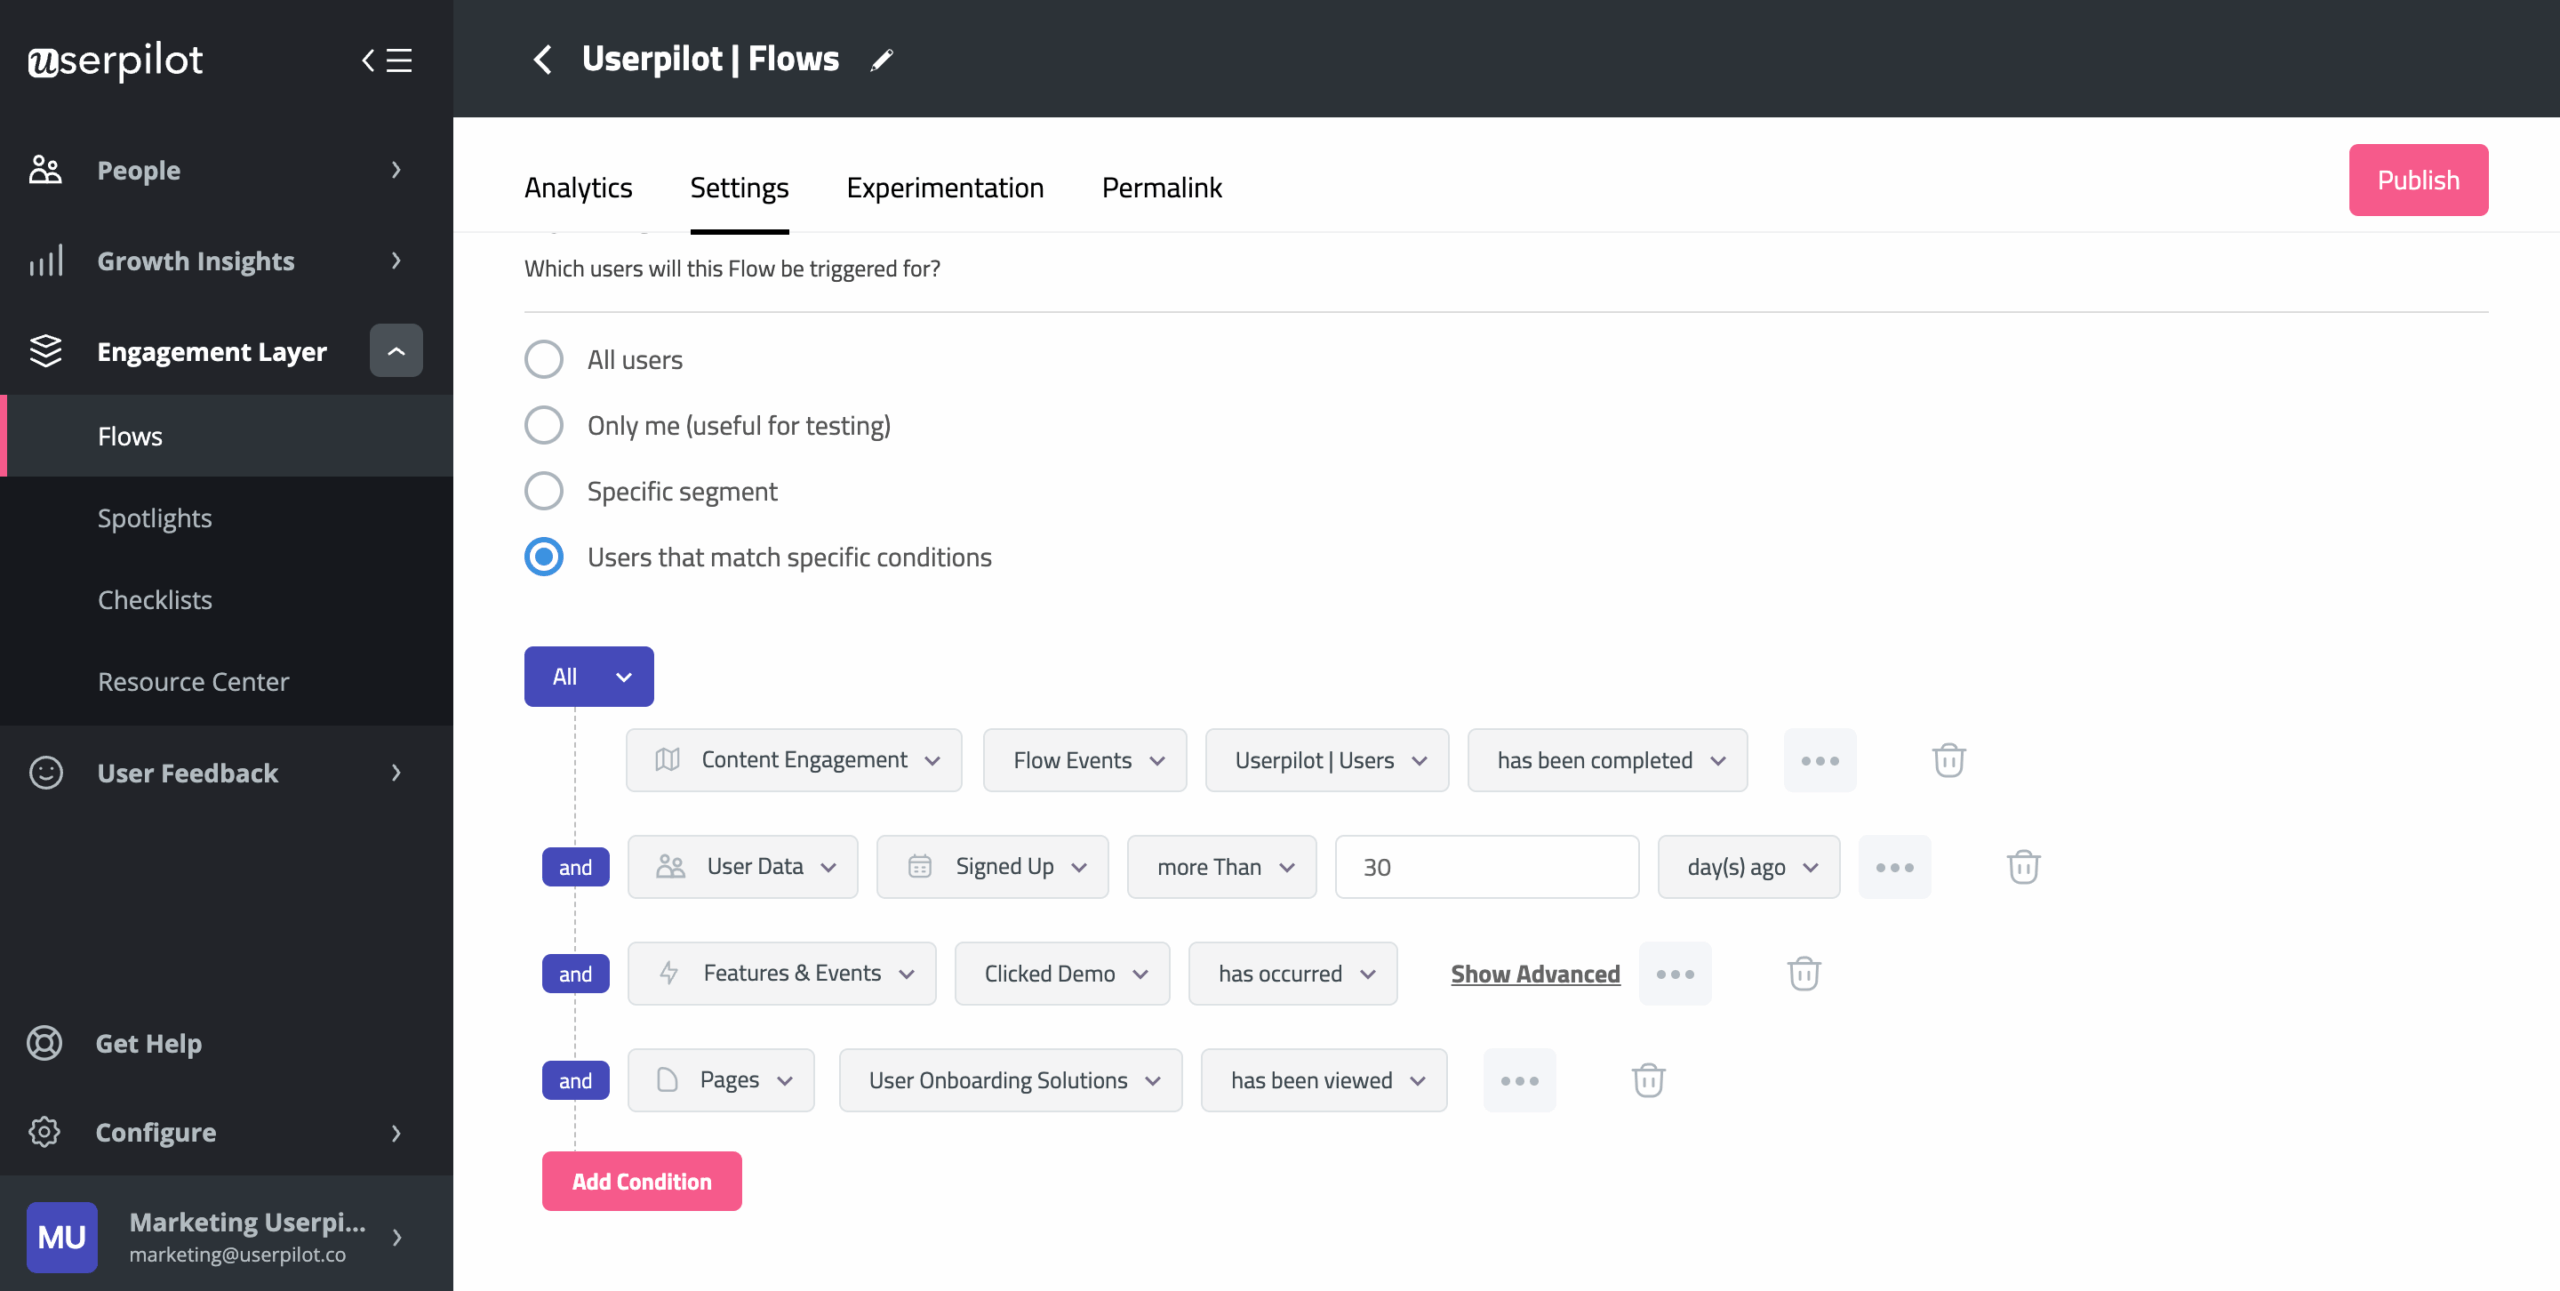
With Userpilot, you can also create flows based on custom settings and event occurrences to increase the chances of high engagement with unique users.
Userpilot pricing differentiation is based on the number of Monthly Active Users (MAUs) your company has. Here’s the detailed Userpilot pricing:
- Traction: Billed anually, this plan costs $299/ mo for up to 2000 MAUs and includes all the fundamental features related to engagement.
- Growth: Custom pricing and includes additional features like localization, in-app resource center, advanced event-based content triggering, and more.
- Enterprise: Custom pricing and usage limits. As well as unlimited team members, multiple apps, dedicated enterprise infrastructure, and so on.
Feel free to sign up for a demo if you’d like to give it a shot!
Appcues
Appcues is an onboarding software that’s mostly known for its ability to create interactive product tours using an intuitive UI. It’s best for small or mid-market companies looking to improve user engagement.
It has certain features that help improve engagement and user interaction, such as:
- User Onboarding
- Feature Adoption
- Insights
- NPS & Surveys
- Announcements
- Mobile Adoption
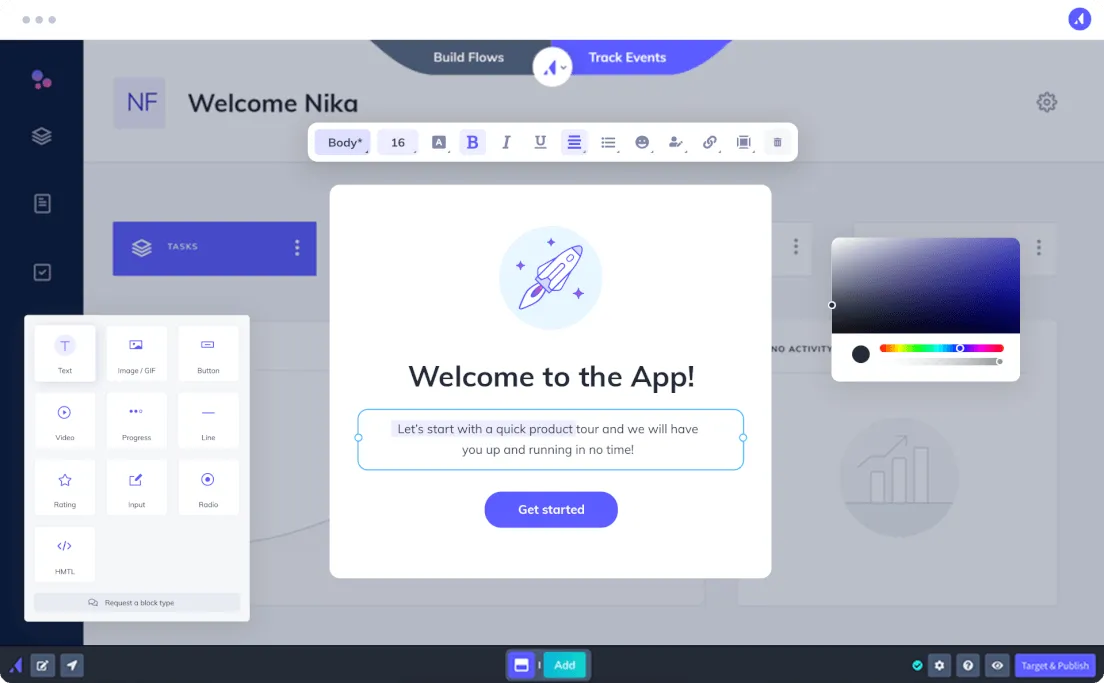
Appcues.
One drawback is their lack of an in-app help center, which Userpilot provides. Appcues is also quite expensive if you want more features than are covered in the basic plan. It offers 3 packages:
- Essentials start from $249/month
- Growth starts from $879/month
- Enterprise is a custom package that requires a demo for a price quotation
Conclusion
When you require information on product engagement, the metrics most important for you to track will depend on your tracking goals and any other user engagement riddles you want to unravel.
Want to track in-app user interactions and monitor product engagement metrics? Get a Userpilot Demo and see how you can use different customer engagement data to improve retention, reduce churn, and keep your users satisfied.
Try Userpilot to Track and Improve Product Engagement!



![What are Release Notes? Definition, Best Practices & Examples [+ Release Note Template] cover](https://blog-static.userpilot.com/blog/wp-content/uploads/2026/02/what-are-release-notes-definition-best-practices-examples-release-note-template_1b727da8d60969c39acdb09f617eb616_2000-1024x670.png)

