Adoption vs. Engagement Metrics: What the Difference Actually Means for Your Product Decisions


I’m James Mitchinson, Head of Customer Success at Userpilot, and I’ve spent years watching product teams treat adoption versus engagement metrics as interchangeable. A team sees strong DAU, the analytics dashboard looks healthy, and then churn arrives three months later that nobody saw coming. The dashboard tracked whether users were showing up, not whether those users had adopted the features that make people stay.
You can have high engagement with low adoption, and high adoption with declining engagement. Both combinations mean something completely different for your retention risk and call for completely different responses. This article covers what each set of metrics actually measures and gives you a practical framework for knowing which one to act on.

Adoption vs engagement metrics: The core distinction
Product adoption is primarily concerned with getting users to sign up, activate, and experience core value. It answers the question: are users integrating the specific features that deliver your product’s core value into their regular workflow?
Product engagement measures what happens in the customer journey after that: are users coming back, interacting frequently, going deep on the features they’ve found?
Think of it as a sequence: users sign up, then activate, then adopt, then engage. The stages are related but the signals are distinct. A user who logs in every day but only ever uses your search bar is engaged but not adopted.
The reverse is equally common. A user who ran a complete workflow last month but hasn’t logged in since is adopted but not building a habit. Both patterns look different in your data, and both require a different fix.
Engagement metrics evaluate the depth, frequency, and duration of how users interact with your product over time. Adoption metrics measure whether users are reaching the features that predict long-term retention. Both matter, and when the dashboard shows a problem, knowing which one is failing tells you exactly where to look.
Why the distinction matters for your product decisions
Most dashboards surface engagement by default. DAU, MAU, session frequency: these are the numbers that go into the weekly review. The problem is that high engagement can coexist with serious adoption gaps, and those gaps are what churn eventually traces back to.
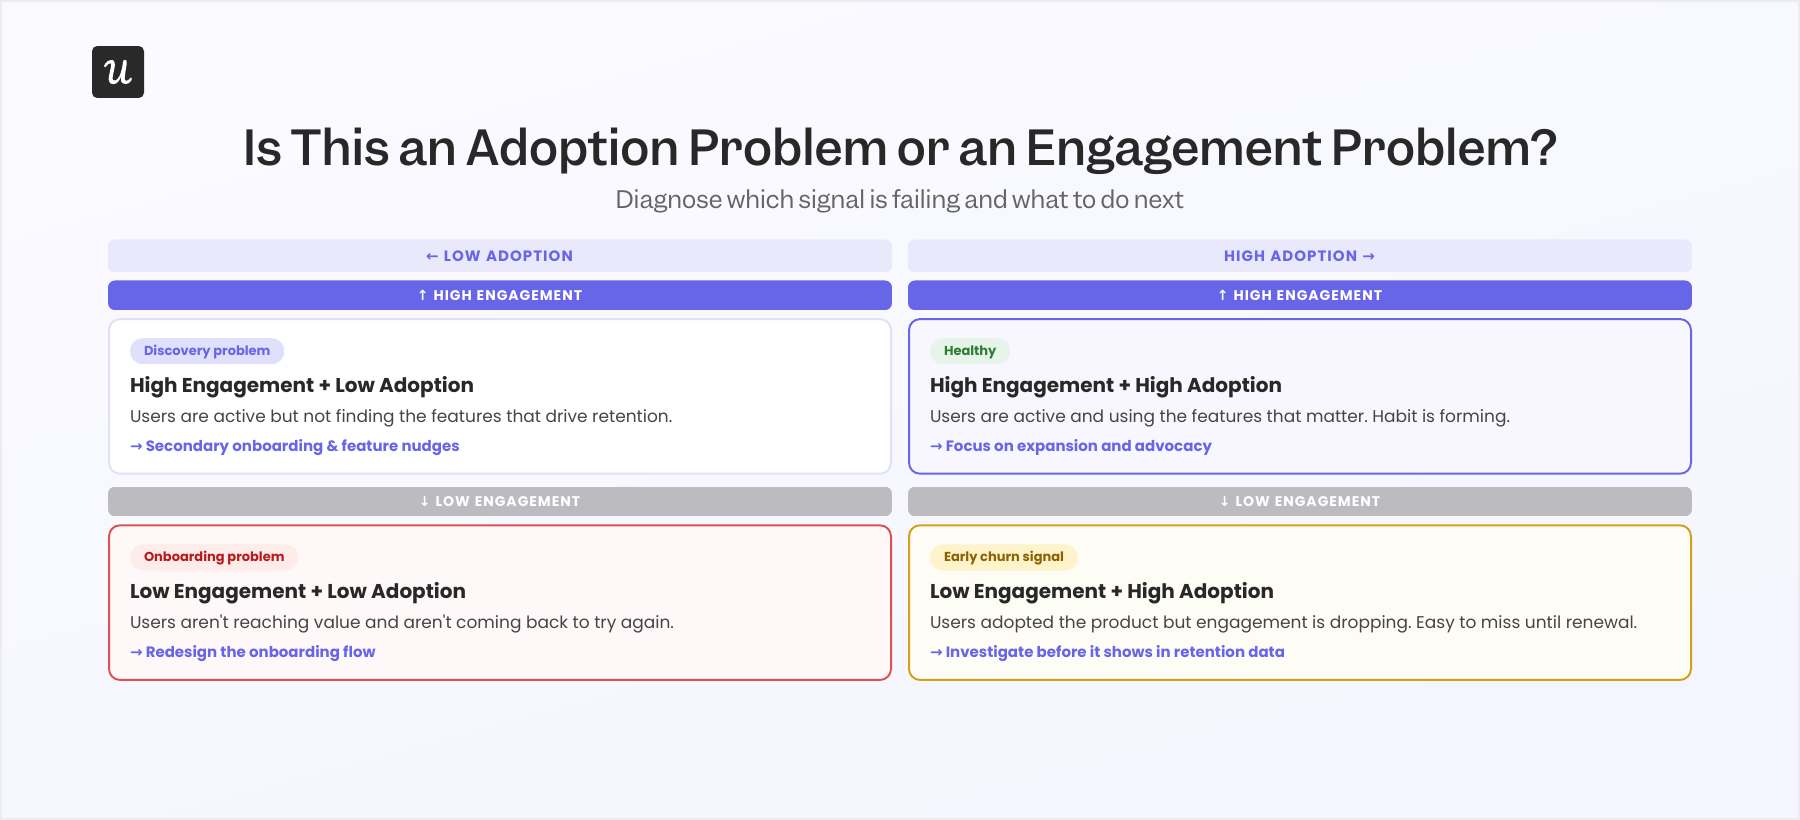
The four-quadrant matrix above is a diagnostic prompt, not a prediction model. It forces you to look at both signals together rather than defaulting to whichever one your dashboard surfaces first. I use it regularly when reviewing accounts that look fine on the surface but carry warning signs in CS data, which is what I’d describe as the high-logins-zero-outcomes pattern.
Here is what each quadrant means in practice:
- Low engagement + low adoption: Onboarding problem. Users aren’t reaching value and they’re not coming back to try again.
- High engagement + low adoption: Discovery problem. Users are active but not finding or using the right features. Secondary onboarding and feature nudges are the lever here.
- High engagement + high adoption: Healthy. Focus on expansion and advocacy.
- Low engagement + high adoption: A warning sign that’s easy to miss. Users adopted the product but engagement is dropping, which is a possible early churn signal worth investigating before it shows in retention data.
A common mistake in SaaS is to over-optimize for engagement at the expense of adoption, ending up with a core group of highly active users while most of the user base never integrates the key features that drive retention. The product usage metrics you weight most in your weekly review will determine which problem you catch first.
Key product adoption metrics and what they tell you
There are three adoption metrics worth tracking consistently across the user journey. Each one captures a different stage in the path to long-term value.
Time to Value
Time to value (TTV) is the time a user takes to reach the activation point, the moment where they first experience what makes your product worth paying for. High-performing SaaS teams deliver first value in roughly 1.5 days on average, based on Userpilot’s benchmark data. When TTV is too slow, the right response is to identify friction points in the onboarding flow and redesign those specific steps.
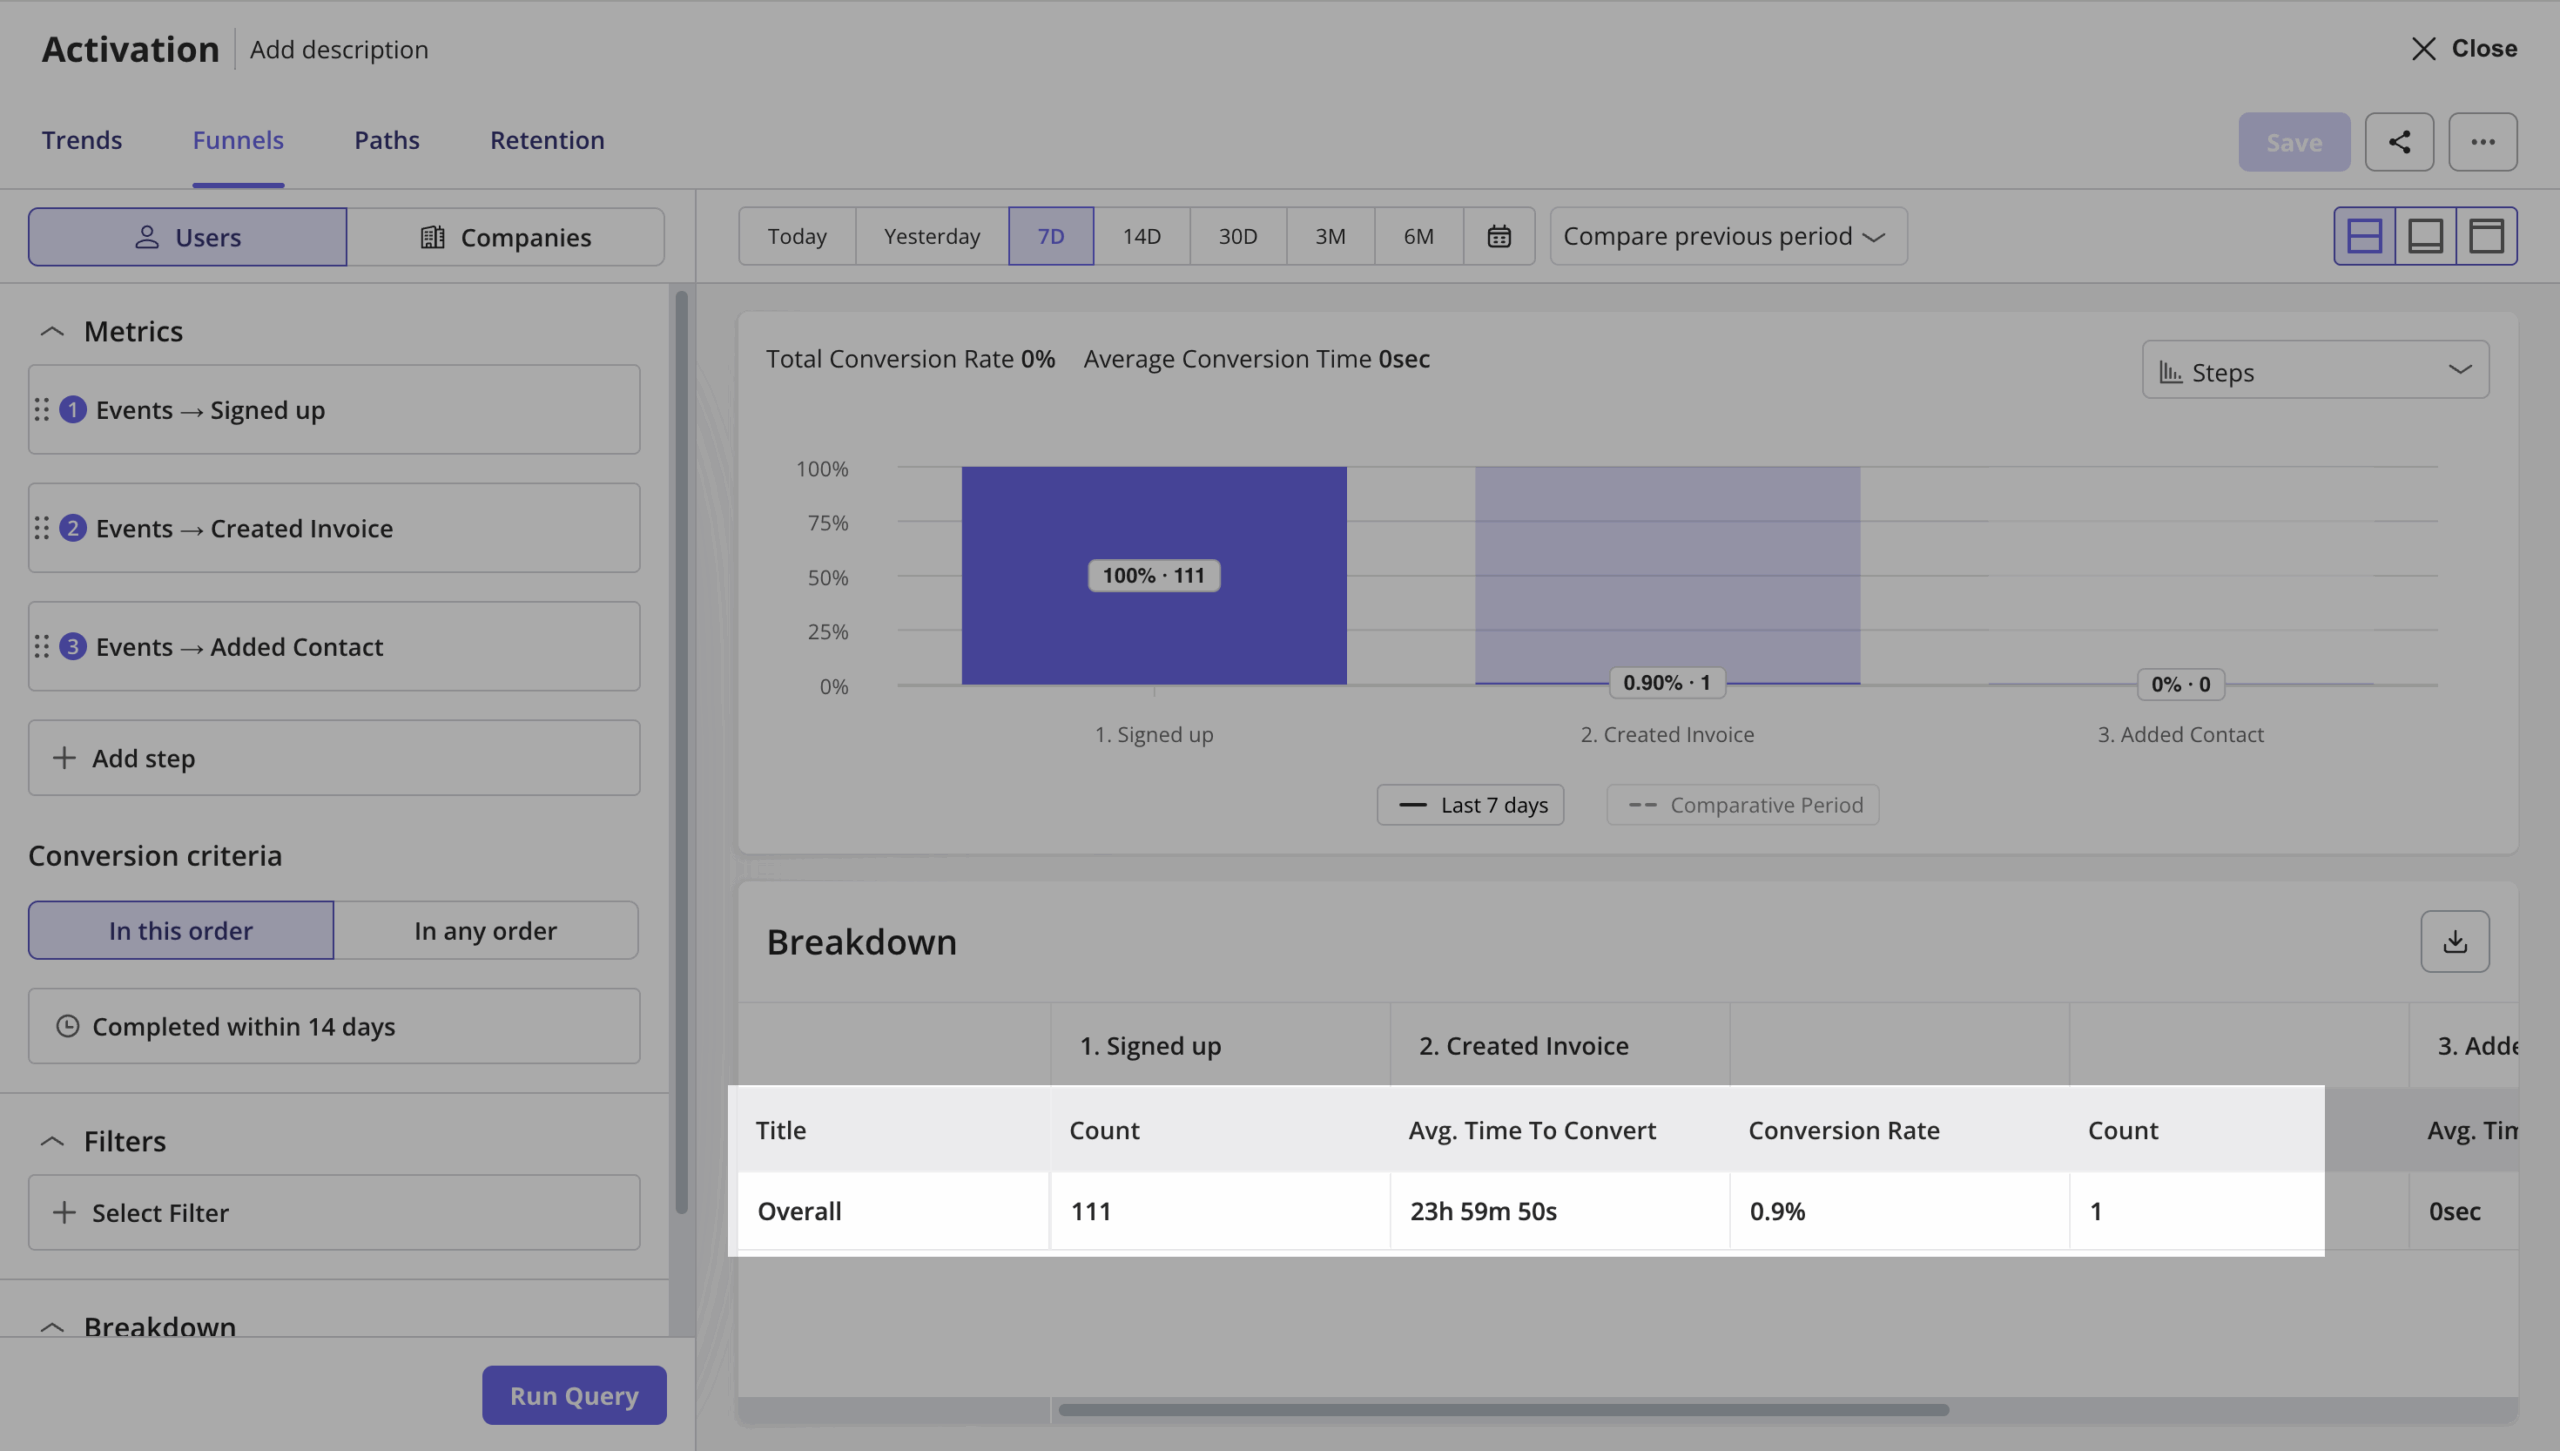
A long TTV is almost always an onboarding problem, not a product problem. The value is there; users just aren’t finding it fast enough. You can measure TTV in Userpilot by setting up an activation funnel with your key activation events as steps.
Product adoption rate
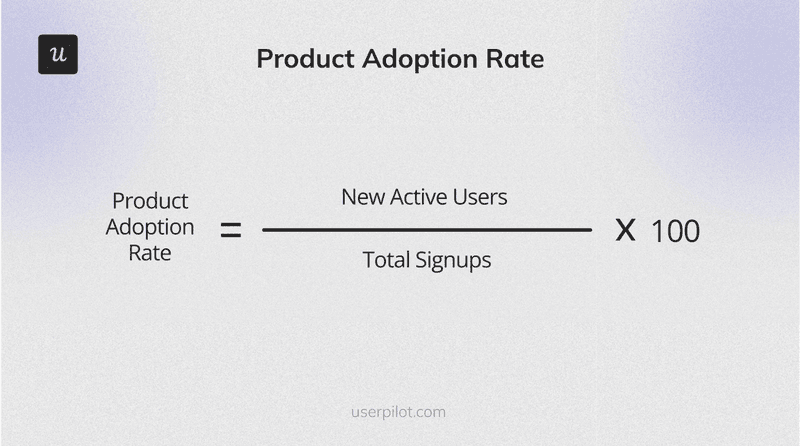
Product adoption rate is the percentage of new users who become active users of your product’s core features within a defined timeframe. It tracks whether users complete the specific in-app events that indicate real value, not just whether they’ve logged in. Adoption rate filters out passive accounts that login count doesn’t catch.
In Userpilot’s research across 547 SaaS products, the average activation rate is around 37%, meaning roughly two-thirds of new users never reach a meaningful first value moment. Adoption problems almost always start in onboarding, and tracking this metric is the fastest way to see it.
Feature adoption rate
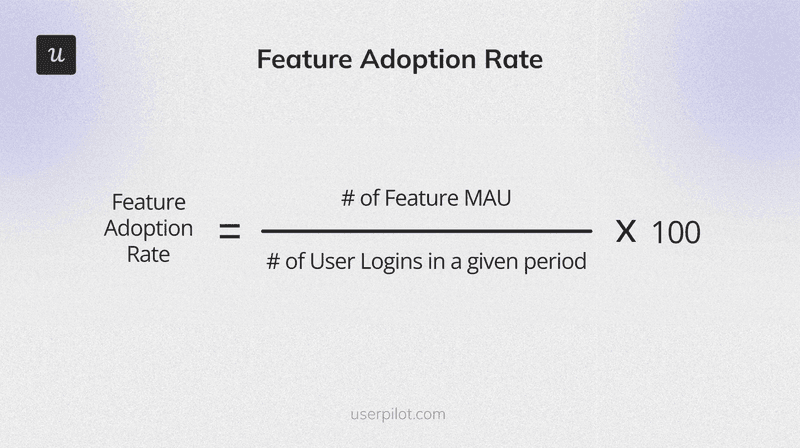
Feature adoption rate measures the percentage of active users who are using a specific feature. The formula: divide the number of monthly active users of a feature by the number of user logins in the same period, then multiply by 100. Tracking this by feature tells you which parts of your product drive retention and which existing or new features are being ignored by the majority of your user base.
This is where I see the biggest gap between what teams track and what’s actually predictive of churn. A user can have high session frequency while their feature adoption rate on your stickiest features is near zero. That combination, high engagement alongside low adoption on the features that matter, is the pattern that precedes a lot of the churn I see in CS data.
Awni Shamah, Staff Product Manager at Amplemarket, ran directly into this problem when launching new features to existing users. Using contextual nudges built in Userpilot, his team drove feature adoption increases of 5 to 10 times:
“Whenever I add a nudge to a new feature, it boosts adoption by 5x, even 10x.”
— Awni Shamah, Staff Product Manager at Amplemarket
You can read the full Amplemarket story here. Getting users to the right features at the right moment in their workflow is an active job.
Key user engagement metrics and what they tell you
Engagement metrics tell you about user behavior in the present. They show whether users are returning, interacting, and building a habit around the features they’ve found. Here are the four key user engagement metrics worth tracking, and what each one is actually measuring.
Daily and Monthly active users
DAU and MAU measure the number of active users who regularly interact with your product within a specific timeframe. They’re the most common engagement metric in SaaS and also the easiest to misread. A spike in DAU tells you something changed; it doesn’t tell you whether what changed is good or bad.
The more useful question is whether users are engaging with core actions, not just whether they’ve opened the app. A user who logs in, finds what they need isn’t there, and leaves still counts as a daily active user. Total logins overstate meaningful engagement in almost every product I’ve worked with.
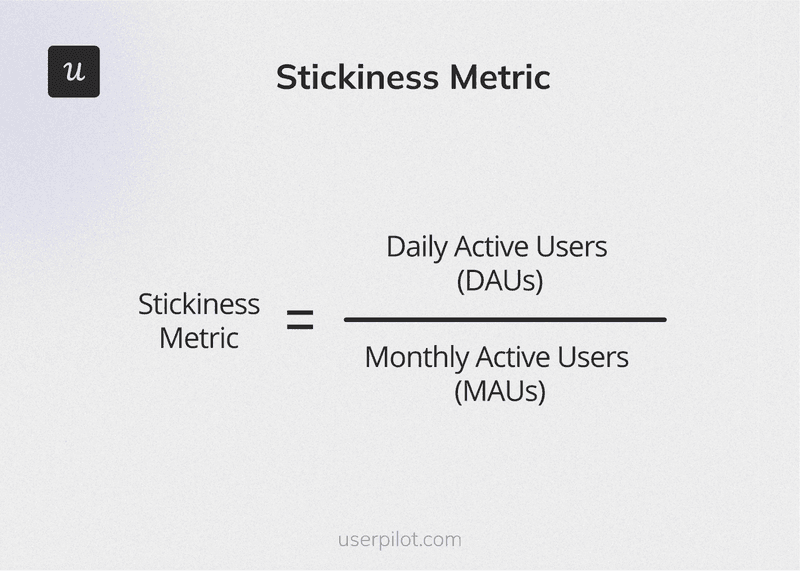
Product stickiness
Product stickiness is the DAU/MAU ratio, measuring the share of monthly active users who are active every day. A ratio of 1.0 means everyone is active daily, which is a theoretical ceiling. For complex B2B products, a ratio around 0.4 is often healthy because users won’t engage every single day.
Stickiness is more useful than raw DAU because it normalizes for user base size and shows whether habits are forming. You can have rising MAU alongside falling stickiness, which means you’re acquiring new users faster than you’re building habits with them.
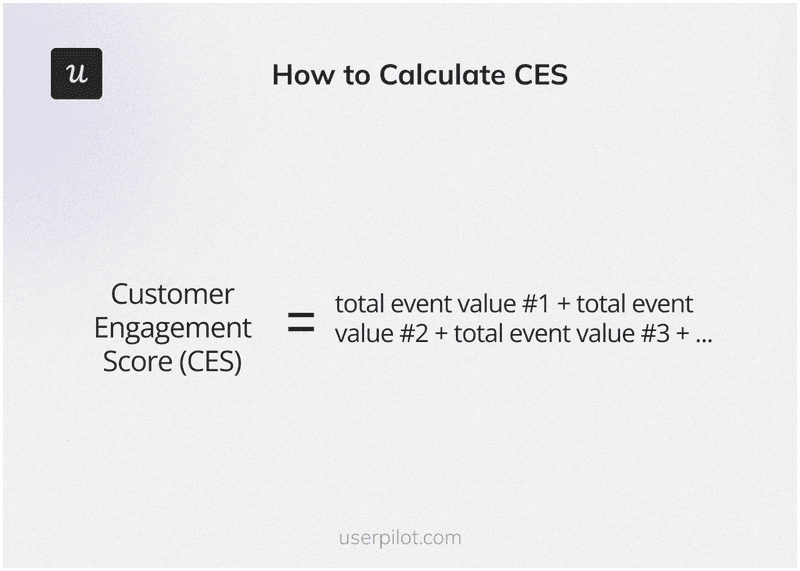
Customer engagement score
The customer engagement score (CES), sometimes called a user engagement score, is a composite metric that weights specific in-app events by their importance, then sums them into a single health number per account. It captures depth and frequency of meaningful user interactions rather than raw session counts. The key to a useful CES is selecting events that correlate with retention, not the ones that look impressive in a board review.
Quantitative engagement scores should be paired with qualitative user feedback to understand the behavior behind the number. A score trending up because users are repeatedly clicking on a broken feature looks identical to a score going up because they’re completing high-value workflows.
Feature engagement rate
Feature engagement rate sits one level below feature adoption rate in the user journey: adoption tells you whether a feature is being used at all, while engagement rate tells you how deeply and how often users engage with it. For features with high adoption but declining engagement, the problem isn’t discovery. Users found the feature; it’s just not pulling them back.
That distinction changes the response completely. Falling engagement on an adopted feature points to the feature itself, not to onboarding. Something in the habit loop that’s supposed to bring users back is broken.
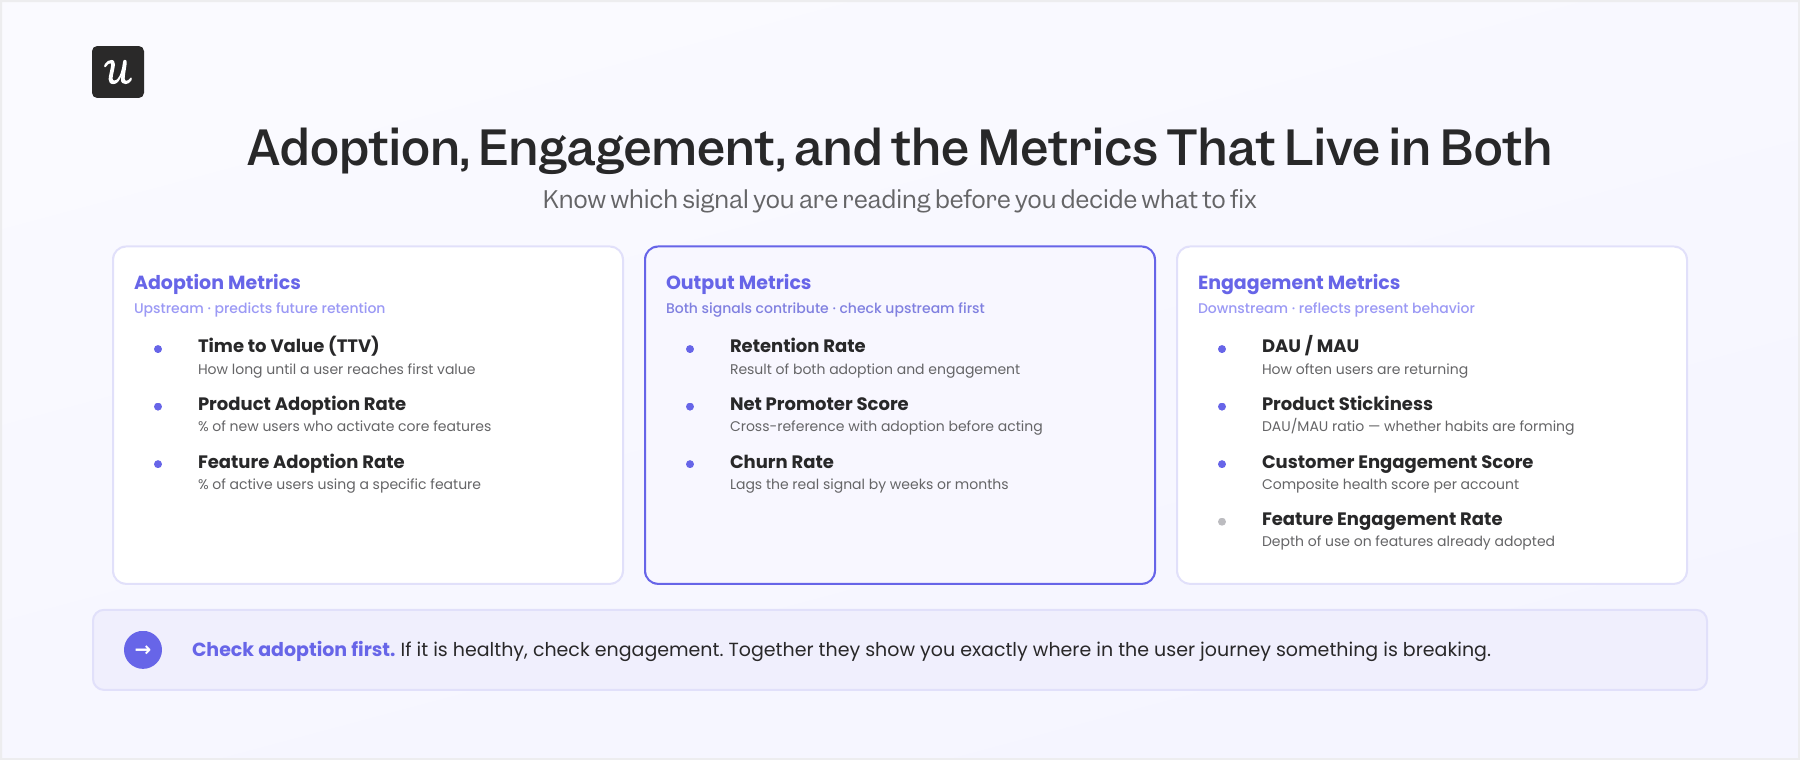
The metrics that sit in both camps
Some metrics are outputs of both adoption and engagement, which makes them harder to diagnose when they move. If one of these changes, your first job is to figure out which input is failing.
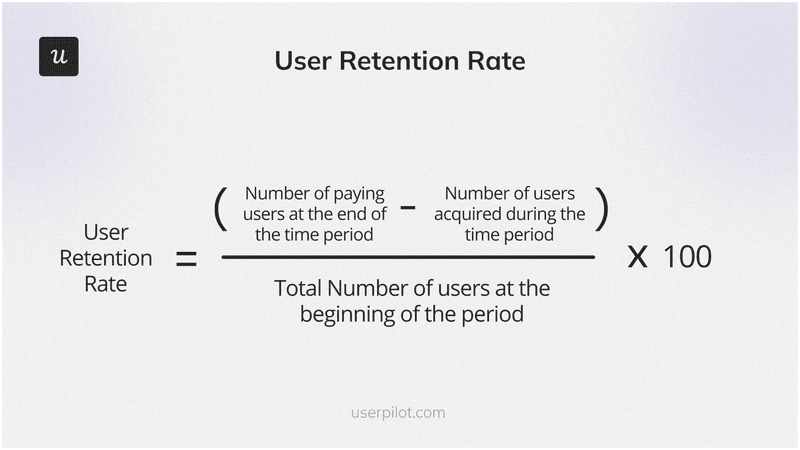
Retention rate
Retention rate is the clearest signal that both adoption and engagement are working. When it falls, you need both sets of metrics to diagnose why. Adoption often moves first, with engagement following 4 to 6 weeks later, so checking adoption metrics at the start of a retention investigation usually surfaces the root cause faster.
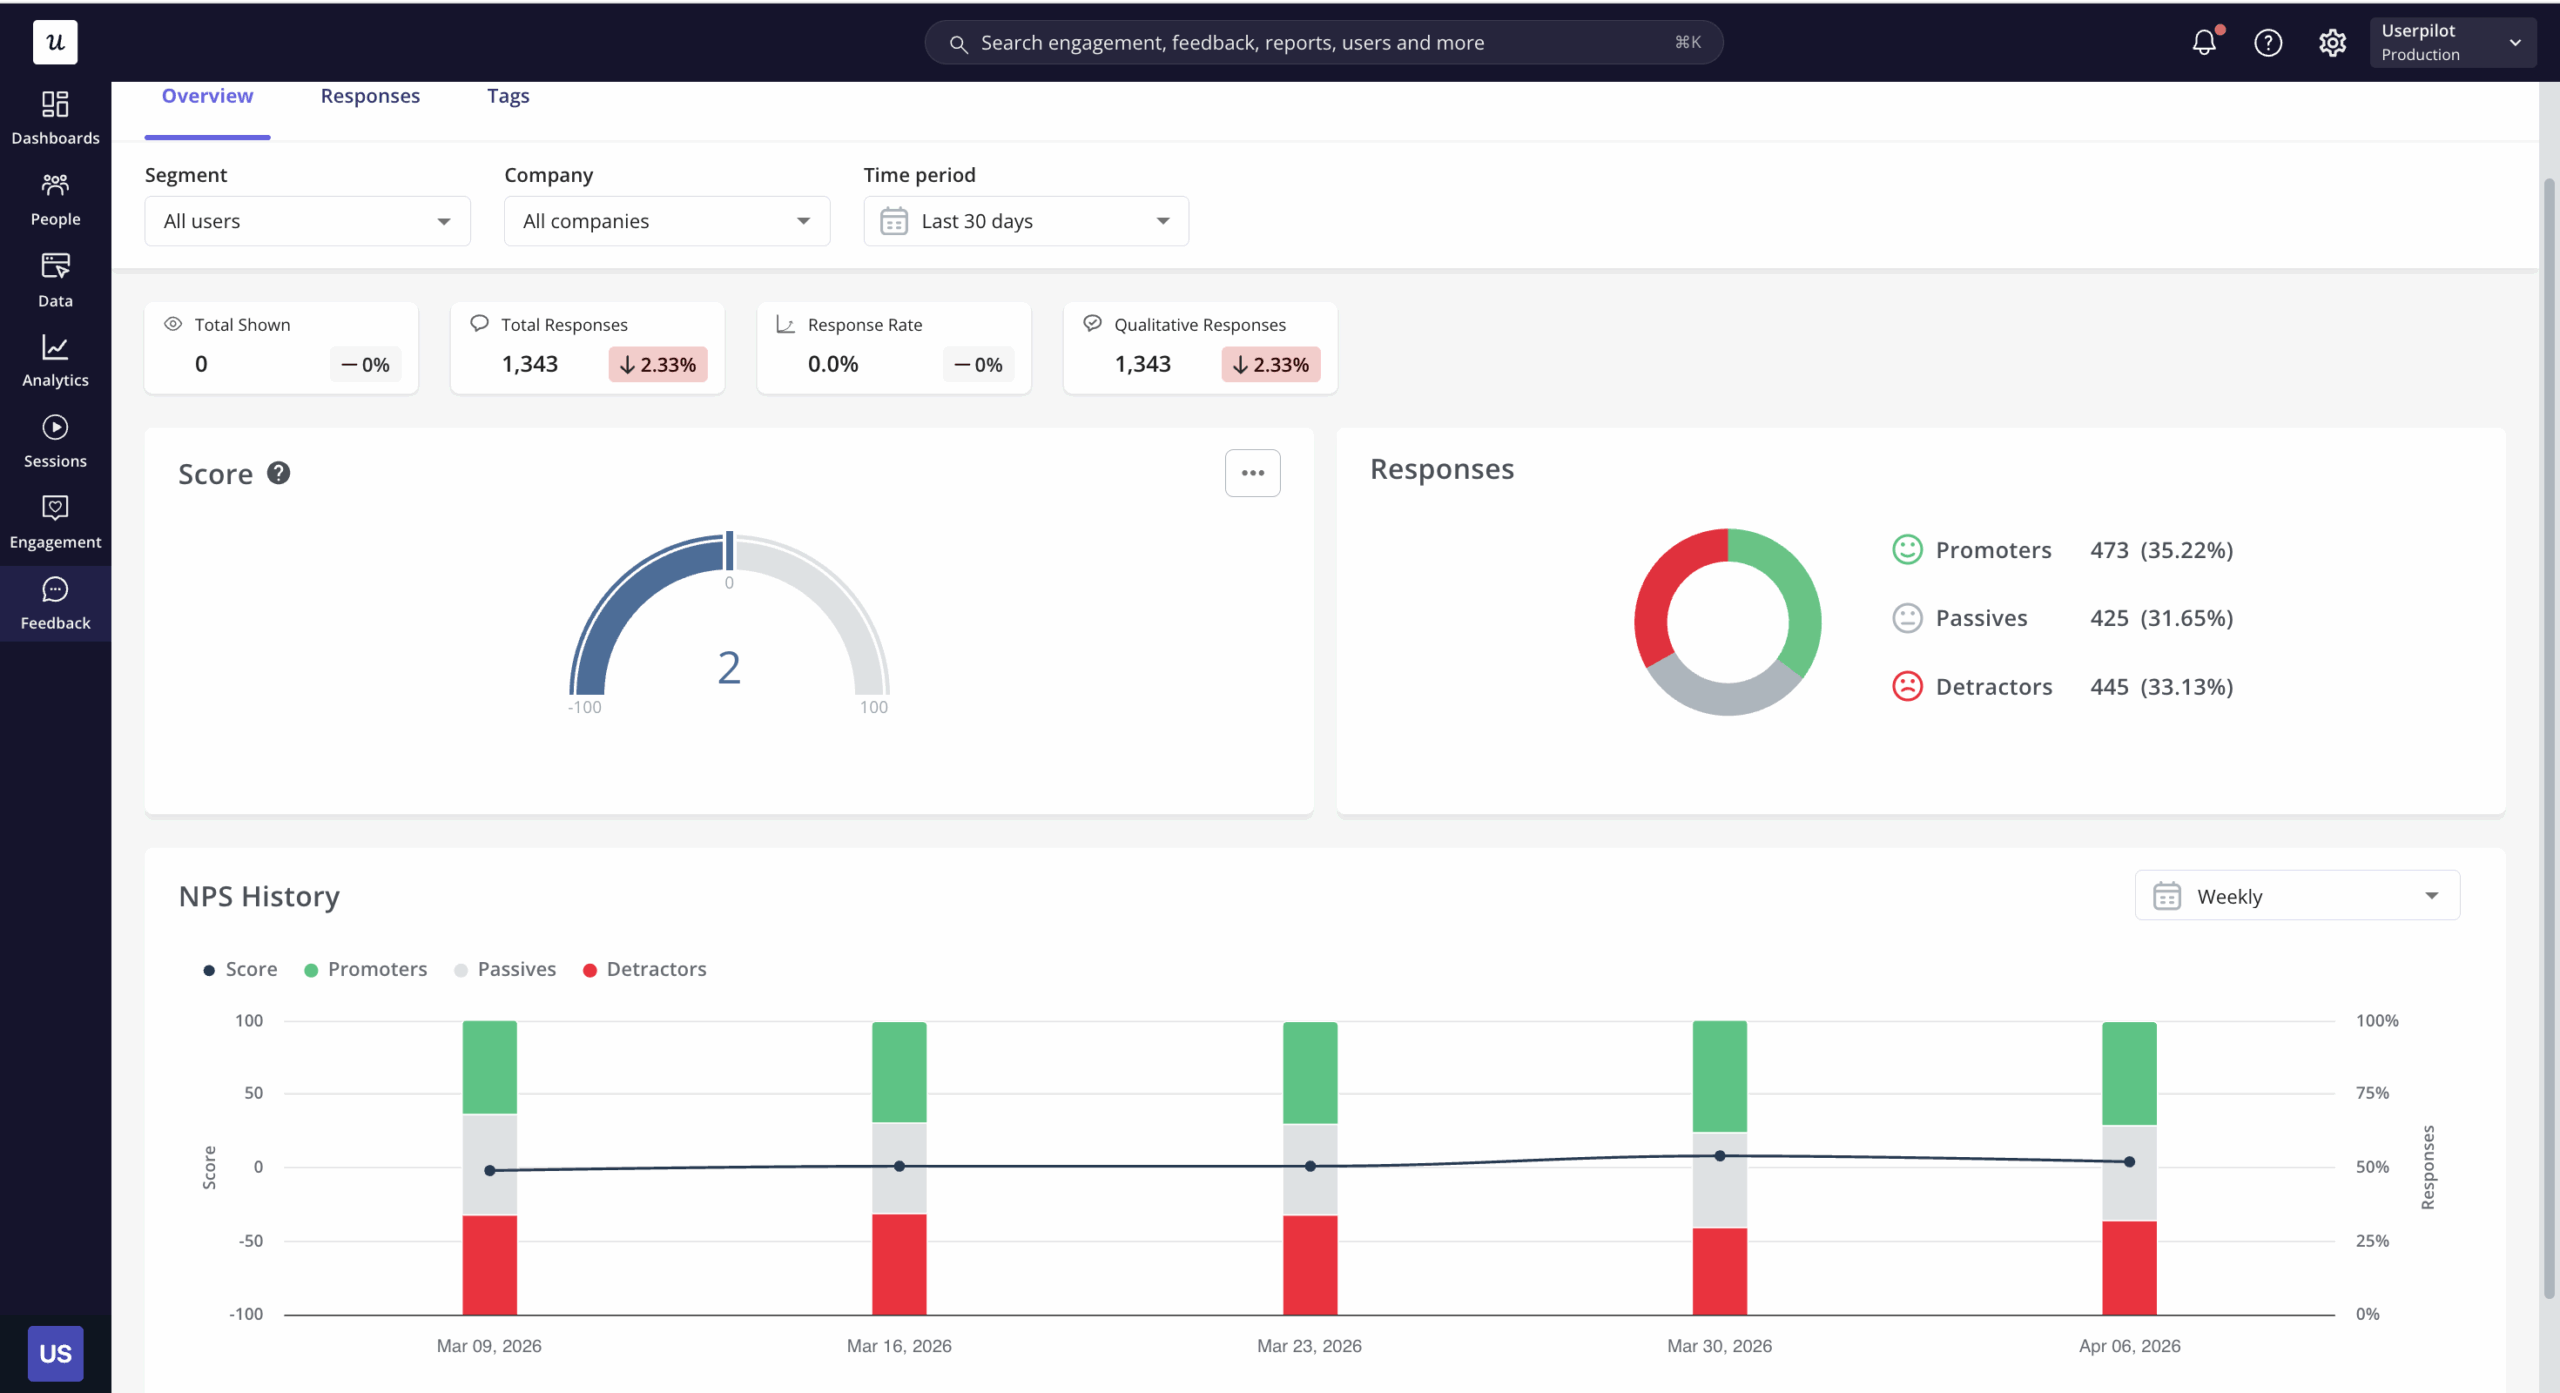
NPS
Net Promoter Score can be misleading without adoption context. A user who gives you a 9 but hasn’t adopted your core features is a churn risk with a good survey score. I’ve seen this pattern enough times to treat NPS as a data point, not a verdict.
Cross-reference NPS against feature adoption data before drawing any health conclusions. A satisfied user who only uses 20% of your product is not as retained as their user satisfaction score suggests.
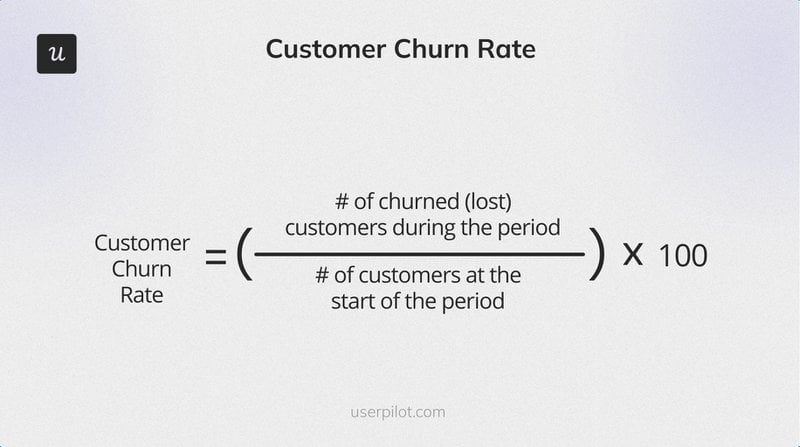
Customer churn rate
Customer churn rate is the percentage of users who leave your product over a specific period, calculated by dividing the number of customers lost by the number at the start of the period. Disengaged customers are the most likely to churn, and the lifetime value impact of improving retention compounds quickly. According to Harvard Business Review, increasing retention by just 5% can boost profitability by up to 95%.
For contract-heavy segments, churn lags the real signal by 9 to 12 months. Feature adoption rate is a better leading indicator in those accounts because a user who stops using your core features in month 3 won’t necessarily cancel until their contract renews.
How to use adoption and engagement metrics together
The diagnostic I use when reviewing account health runs in two steps. First, check adoption metrics to confirm users are reaching the features that drive long-term value. Then check engagement metrics to confirm they’re building a habit around those features.
If adoption is healthy but engagement is dropping, the feature is delivering value but not creating enough pull to bring users back. That’s a product design problem. The habit loop is broken, and the response is feature redesign, not in-app nudges.
If engagement is healthy but adoption is low, the response is secondary onboarding: targeted in-app experiences that surface the right features at the right moment in the user’s workflow. Improving user adoption at this stage means meeting users where they already are, not sending them back to onboarding.
Measuring adoption first gives you the upstream view. Engagement metrics confirm whether the downstream habit is forming. That sequence matters because engagement data alone, without the adoption check, can hide a problem that’s building quietly toward churn for months.
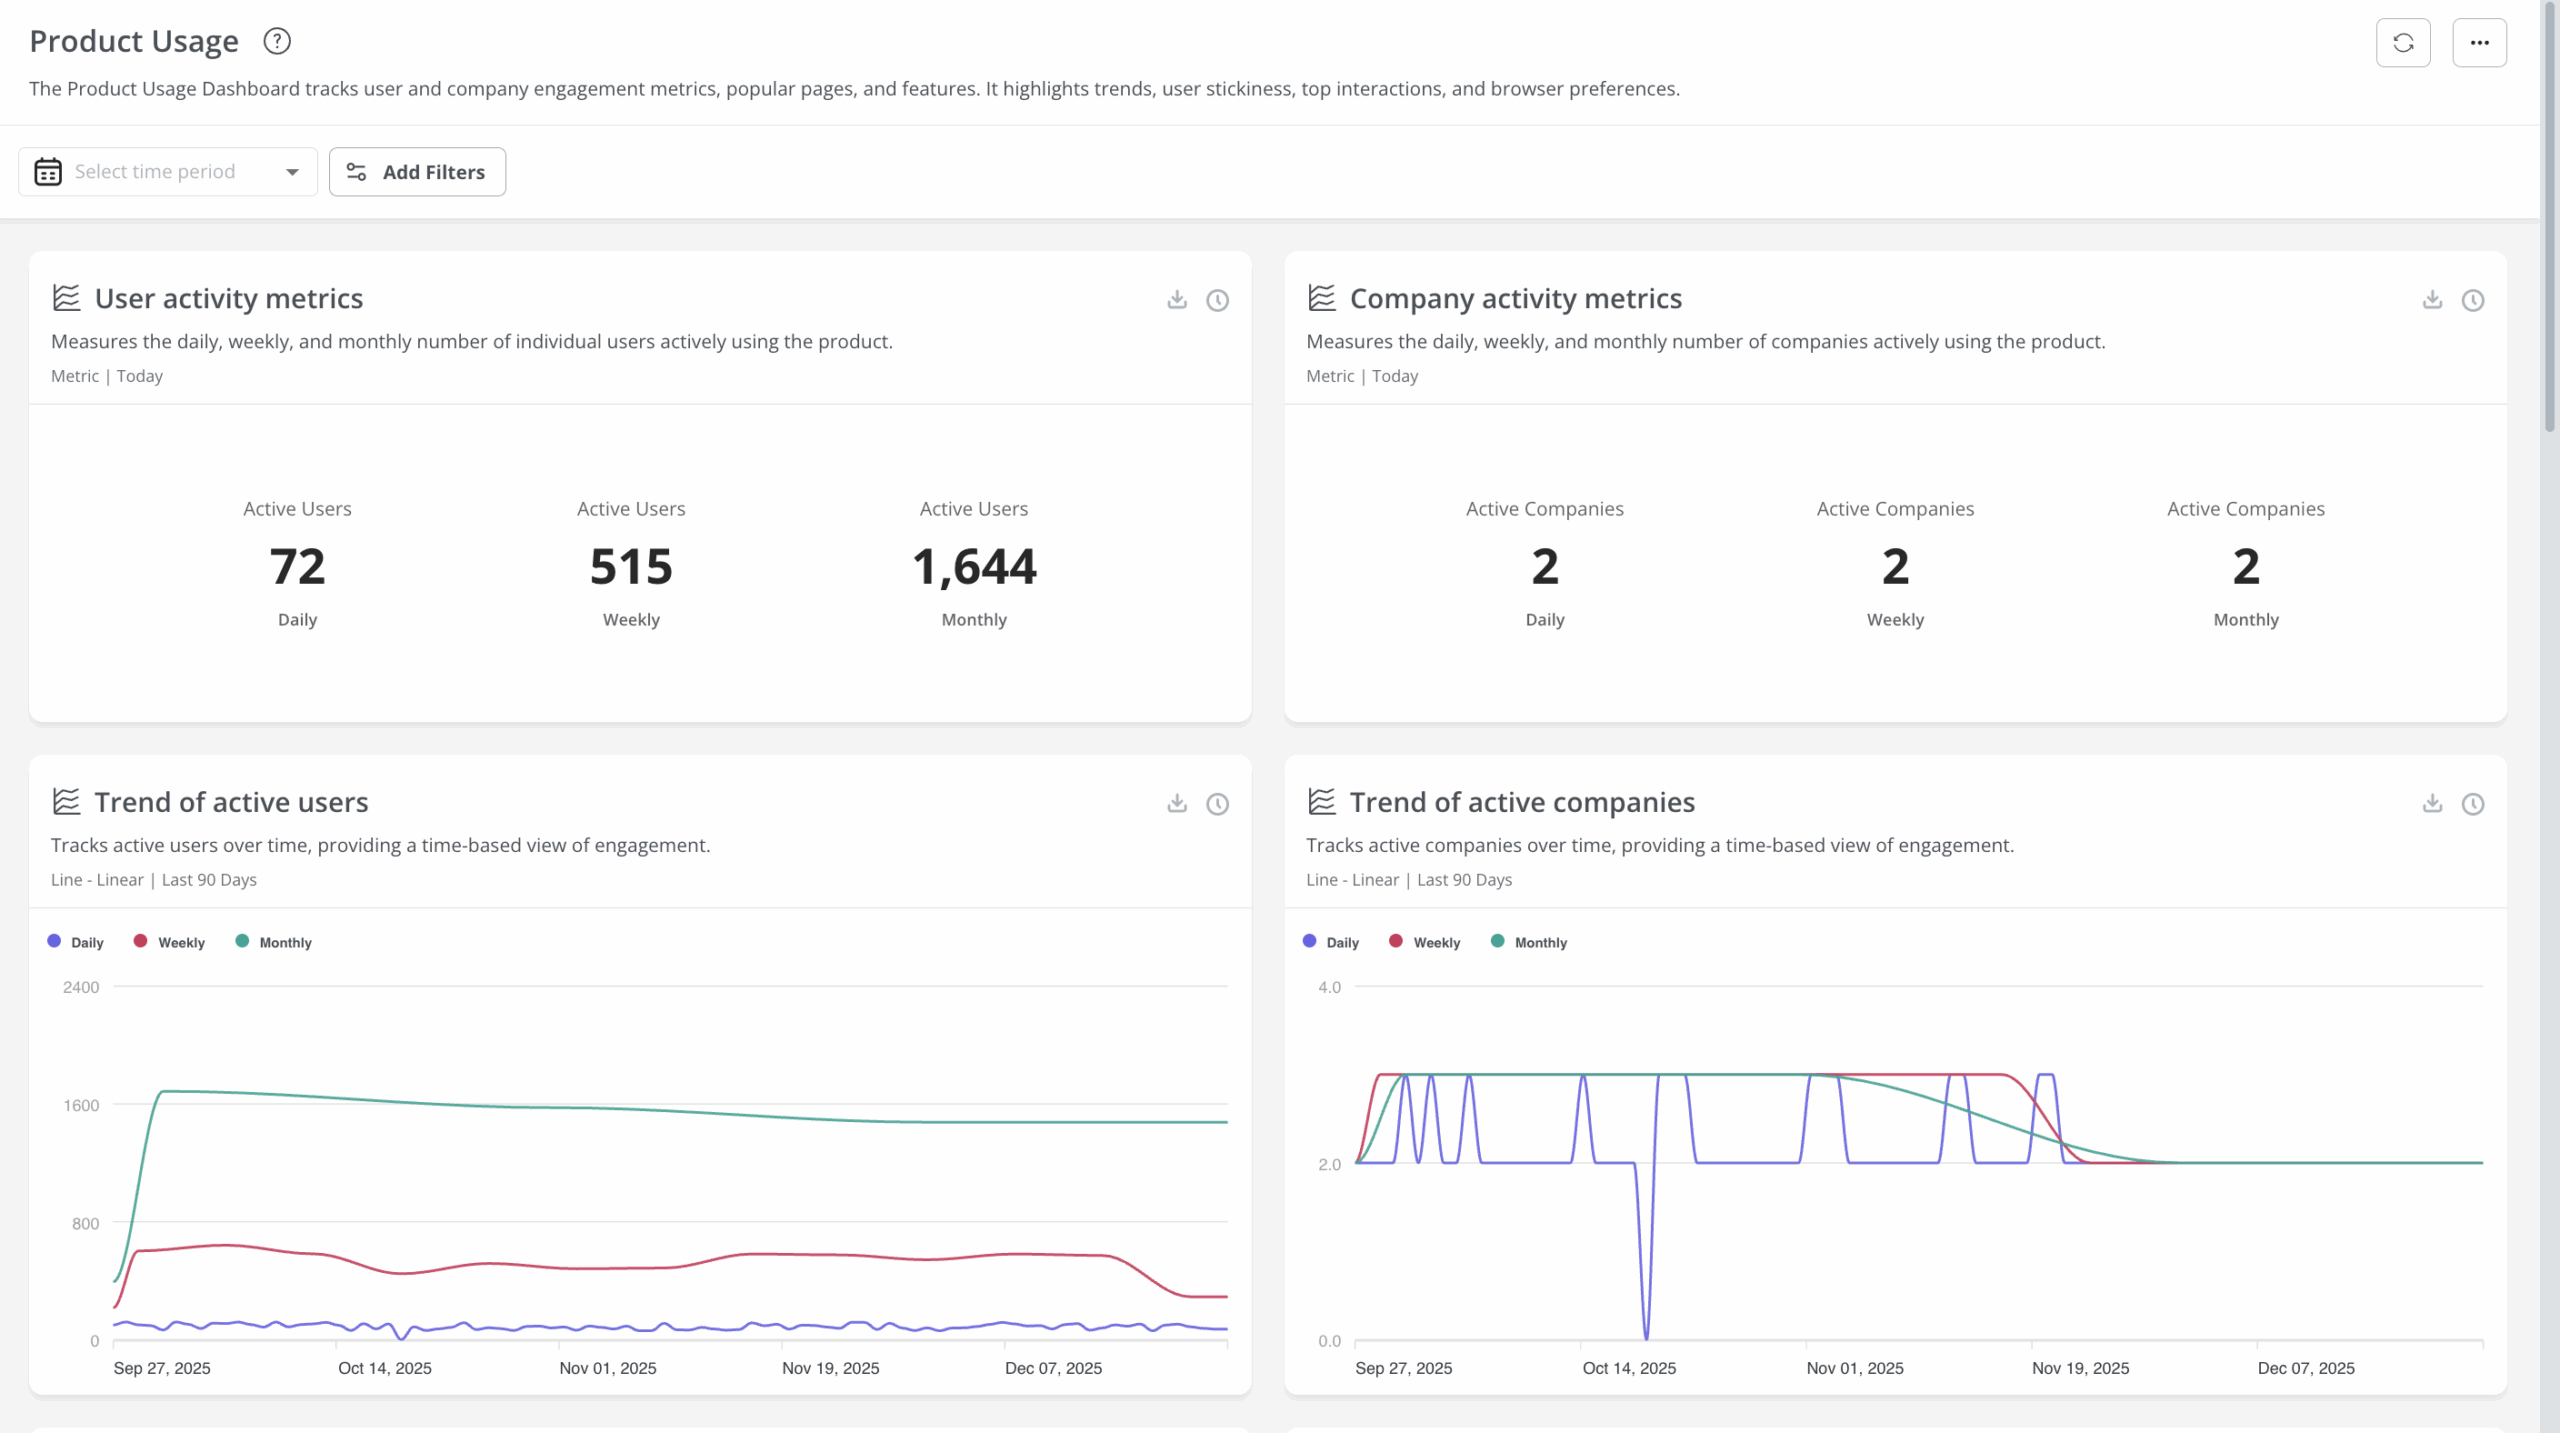
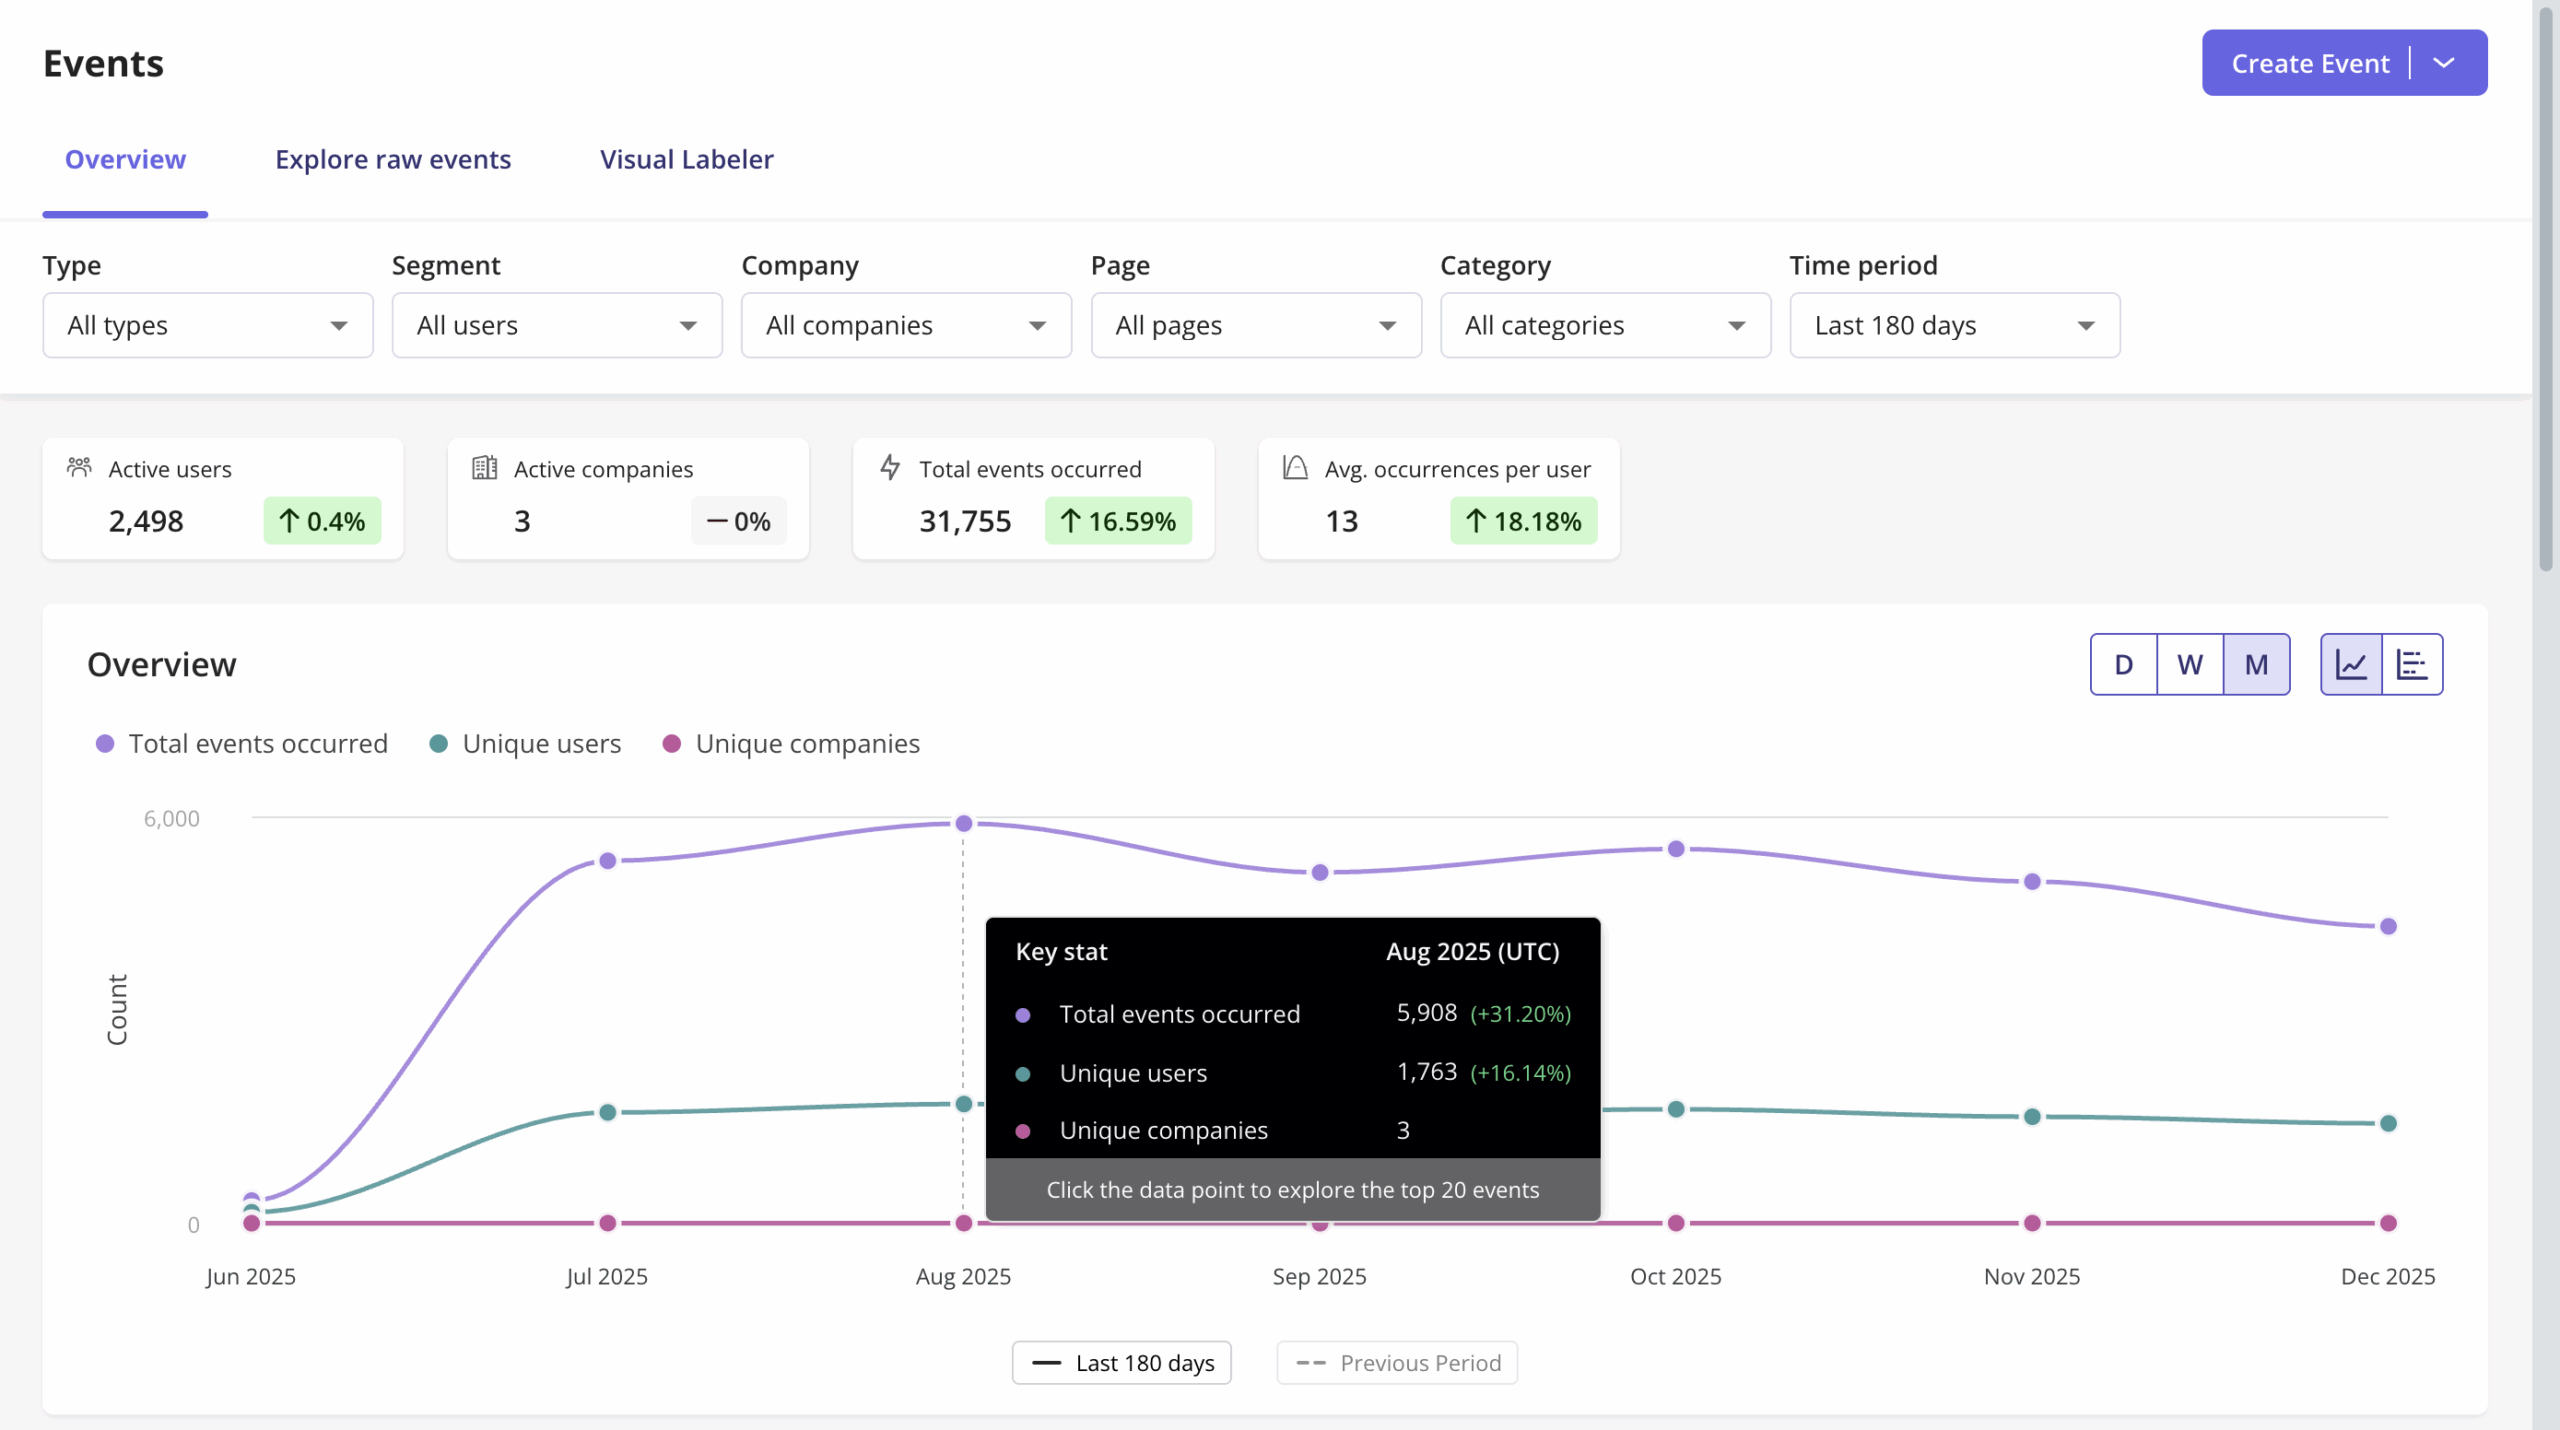
How to track adoption and engagement metrics in Userpilot
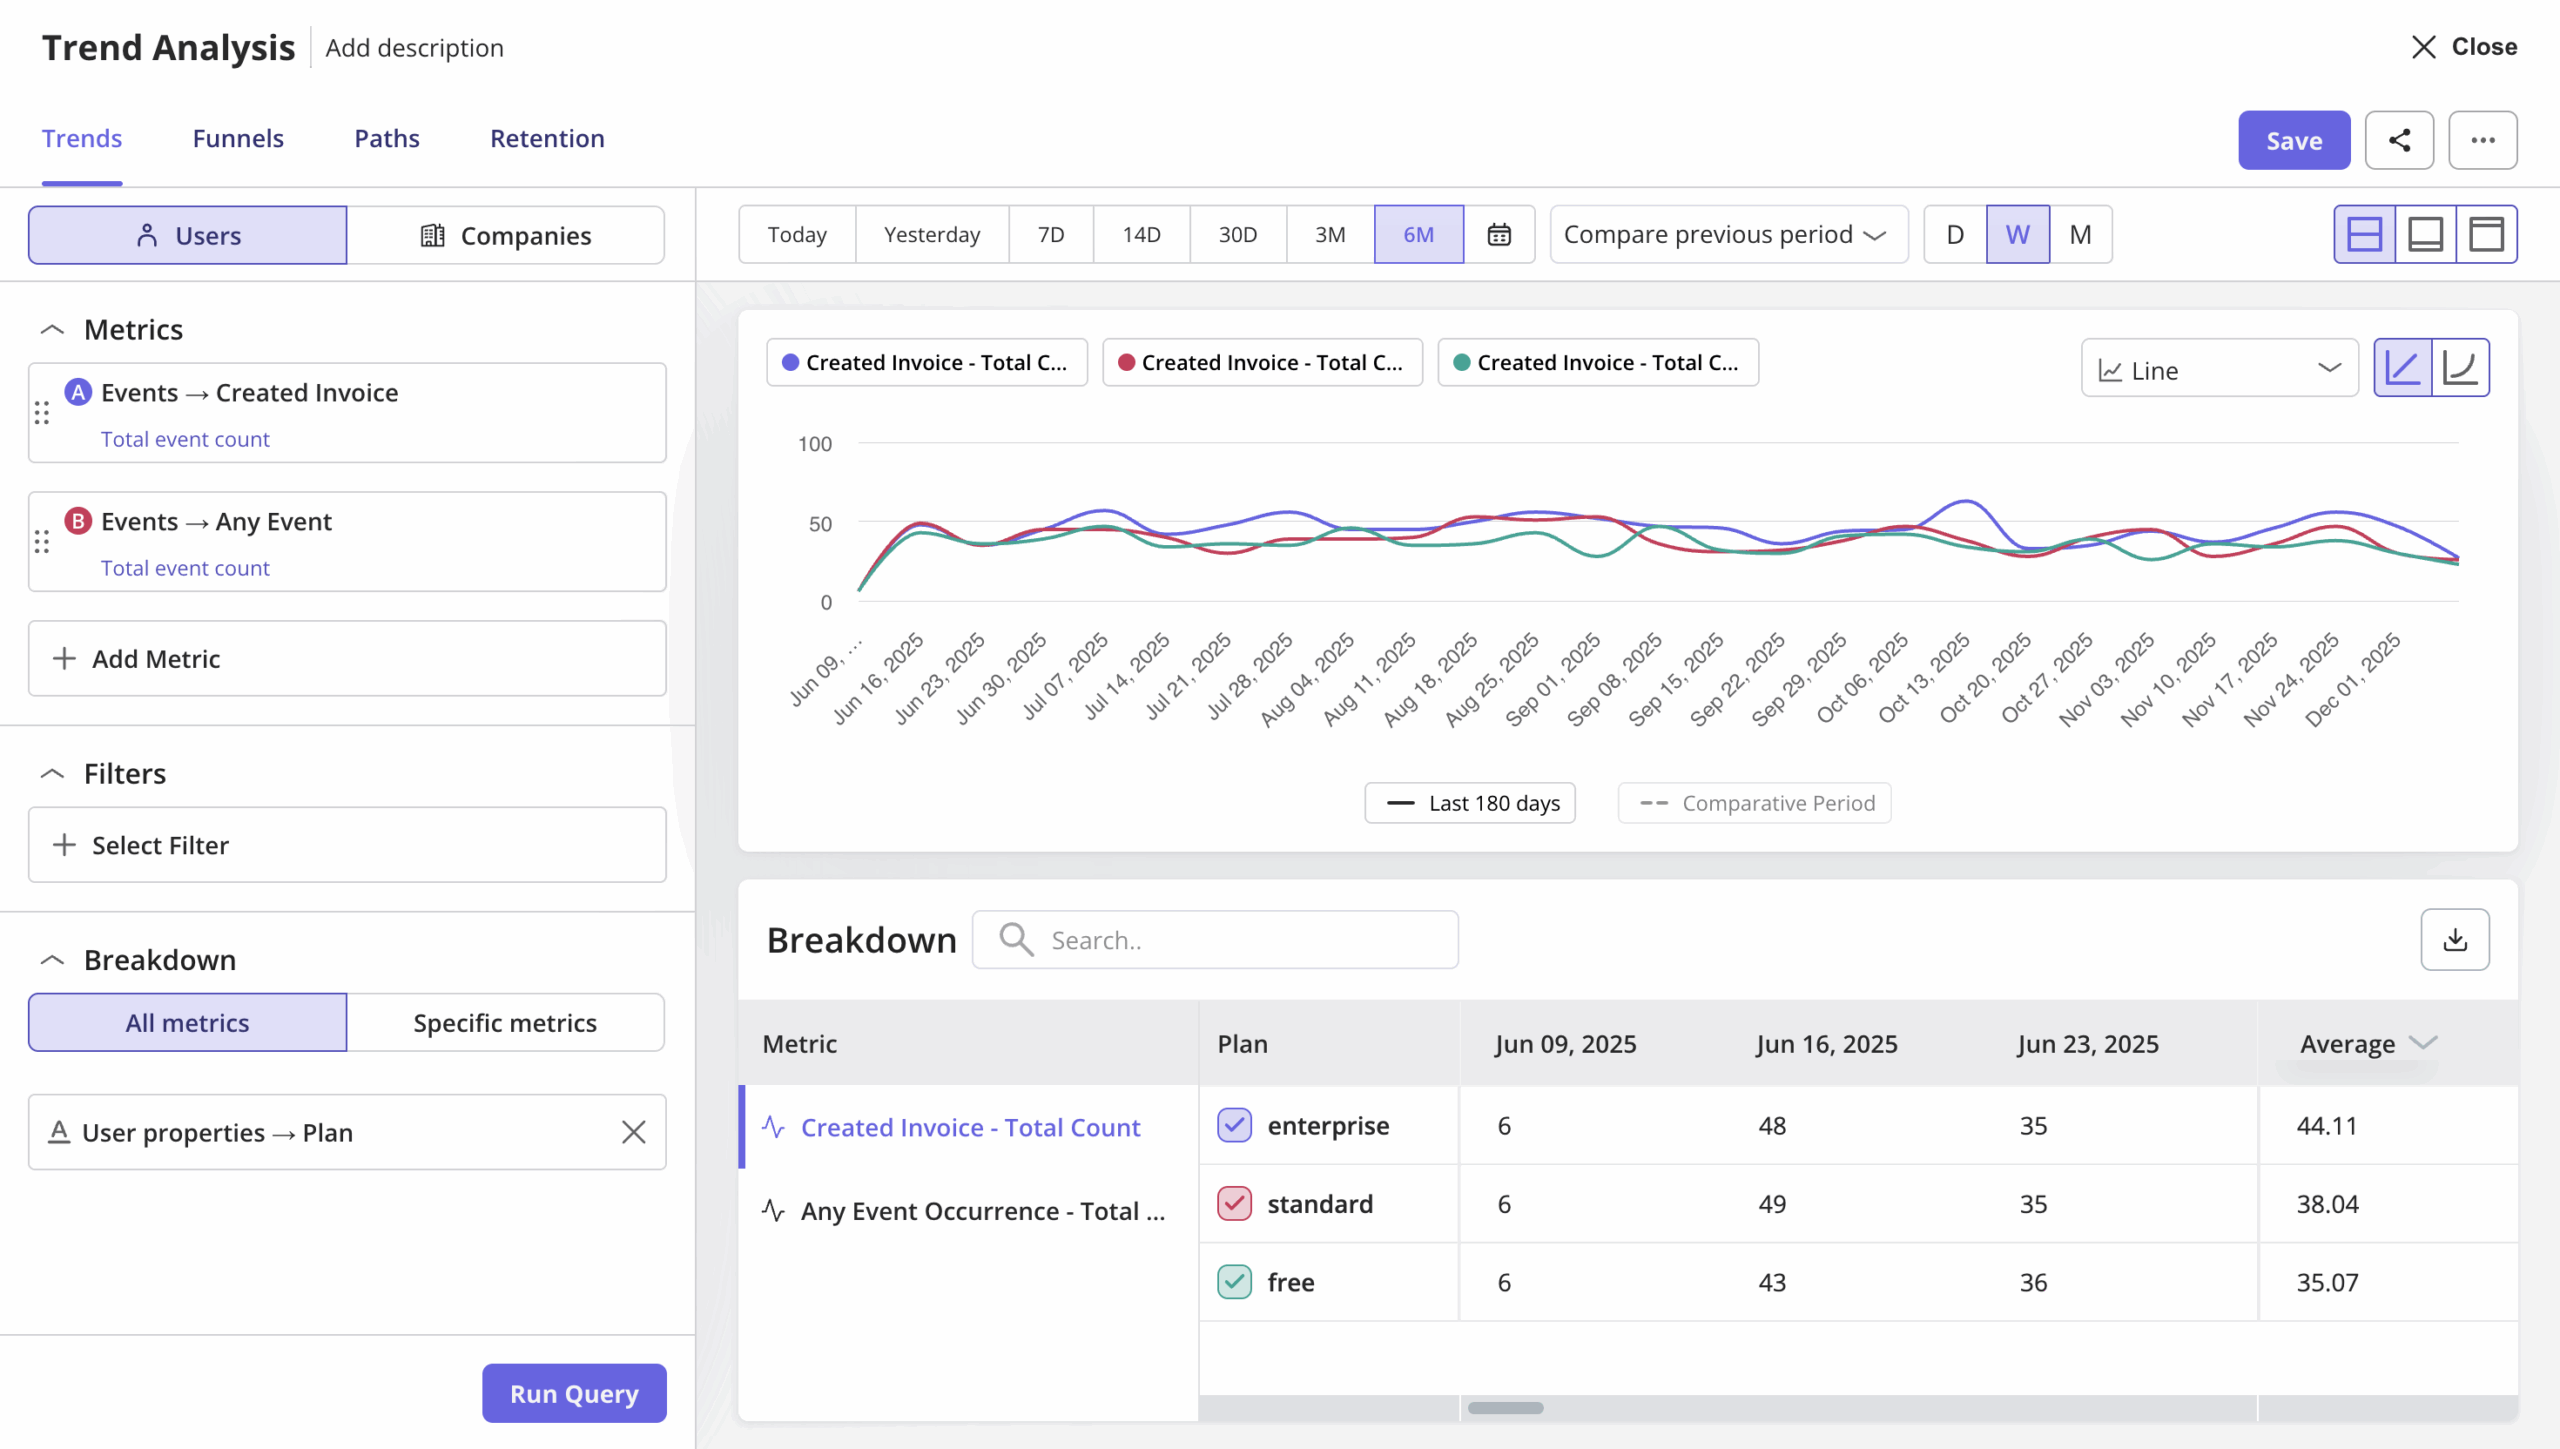
Userpilot lets you track user behavior across both adoption and engagement metrics in one place. On the adoption side: activation funnels for TTV, feature tagging for adoption rates by cohort, and funnel views that show exactly where new and existing users drop off. The analytics dashboard covers engagement, surfacing DAU, WAU, and MAU with trend lines and plan-level breakdowns.
Autocapture collects interaction data from the first day of implementation, so you can start the adoption-vs-engagement diagnostic immediately rather than waiting weeks for instrumentation to catch up. Cohort analysis then shows you which user segments show the healthy adoption-plus-engagement combination versus the ones at risk.
Lia, Userpilot’s AI agent, can query both adoption and engagement data in a single conversation. When you’re trying to diagnose a specific account or customer journey stage, Lia surfaces the relevant signals without requiring you to switch between dashboards or build custom reports from scratch.
Session replay fills in the qualitative layer that aggregate metrics leave out. When adoption or engagement numbers move unexpectedly, replay shows you exactly where individual user behavior diverges from what the numbers suggest, so you’re diagnosing from real sessions rather than guessing from averages.
Book a Userpilot demo to see how to set up activation funnels, engagement dashboards, and the cohort views that show you where adoption and engagement diverge.
About the author