Understanding Revenue Analytics: A Practical Guide


It’s become fairly common for funded startups to burn through millions in marketing, celebrate new signups, only to later discover half of them have churned. The CEO keeps asking, “Why aren’t we growing?” but no one has a clear answer because they’re tracking the wrong numbers.
Revenue analytics fixes this. At Userpilot, I’m responsible for revenue growth. And if you want to build a sustainable product growth engine to significantly increase revenue, you need to understand where your money comes from, what kills it, and how to engineer more of it.
What is revenue analytics?
Revenue analytics is the practice of using data to understand where revenue comes from, what influences it, and how to grow it. It is a core component of effective revenue management.
At a practical level, the revenue analytics process answers questions like:
- Which customers, segments, or plans drive the most revenue?
- Where do deals stall, downgrade, or churn?
- What actions or customer behavior correlate with expansion or renewals?
For a SaaS company, this means connecting the dots between product usage and dollars to see the full picture of your business revenue.
It helps you answer questions like:
- Which marketing channels bring in customers with the highest Lifetime Value (LTV)?
- Does completing the onboarding checklist correlate with higher retention?
- Are users who interact with our new AI feature more likely to upgrade?
- Where is the revenue churn coming from?
When you analyze your revenue streams and understand these correlations, you stop reacting to churn and start proactively engineering growth.
Examples of revenue analytics
Take a hypothetical mid-market SaaS company with 5,000 customers and $10M ARR. Their overall churn rate sits at 5% monthly, which seems acceptable until you dig deeper into the revenue data.
Analytics reveals that customers who integrate with their API within the first 30 days have a 2% churn rate, while those who don’t hit 12%. That’s a 6x difference.
With this insight, they switch their onboarding strategy to prioritize API integration. They build interactive walkthroughs, assign integration specialists to new accounts, and track completion rates religiously.
Six months later, their overall churn drops to 3.5%, adding $420K in retained ARR annually. The data told them exactly where to focus.
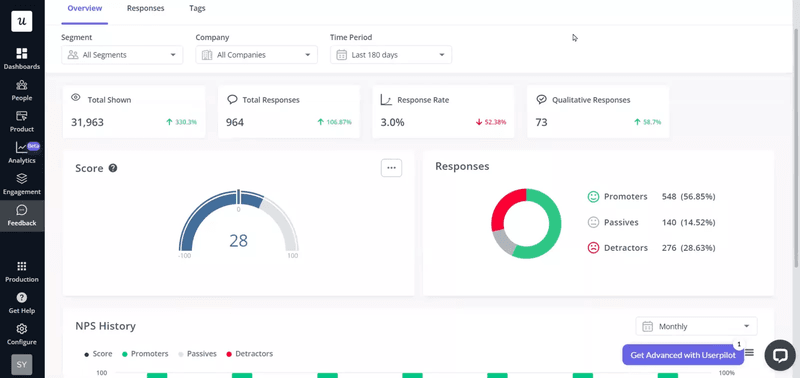
We saw this play out with Unolo, an ed-tech platform we work with. They couldn’t pinpoint why their users were churning. After implementing NPS surveys through Userpilot to gather customer data, they started collecting qualitative feedback at critical moments in the user journey. The data revealed specific pain points around course navigation and mobile experience.
As Subhash Yadav, their Product Marketer, explained
“Our average churn rate, month over month is around 3%. And after we started using NPS, I’m not sure if this is all about NPS, but we definitely reduced our churn rate by 0.5 to 1%.”
That 0.5-1% reduction might sound small on paper, but for a subscription business, it compounds. Over a year, that’s 6-12% more retained revenue without spending a dollar on customer acquisition.
What is the goal of conducting revenue analysis?
The goal of revenue analysis is to make data-driven decisions about where to invest your time and money. It tells you which customer segments are worth pursuing, which features drive upgrades, and where you’re hemorrhaging money.
So, instead of debating whether to build Feature X or Feature Y, you look at the sales data. You see that customers using Feature X have 3x higher LTV, so you double down on adoption.
It also creates accountability. When everyone from product to marketing can see how their work impacts revenue performance, priorities get clearer. The design team stops arguing about button colors and starts optimizing for activation. The content team stops chasing vanity traffic and focuses on channels that bring in qualified leads.
Most importantly, revenue analysis prevents product failure. You catch problems early, like a segment churning or a pricing tier that nobody wants, before the problems crater your growth. This gives you a significant competitive advantage.
What are the main types of revenue analysis?
Revenue analysis breaks down into multiple types based on what you’re measuring:
- Sales analytics examines your sales pipelines to understand lead and prospect behavior. Analyzing bottlenecks, standard sales cycles, and each sales rep’s performance highlights areas for refinement.
- Revenue trend analysis assesses your performance over different time frames (monthly, quarterly, annually), business segments, and product categories. This high-level view reveals where and when your company is growing or shrinking.
- Customer revenue analysis focuses on customer acquisition metrics, retention rates, lifetime value (LTV), and customer profits.
- Reach and engagement metrics help you gauge market penetration by measuring how much customers use a product or service compared to its estimated market. This includes site traffic, branded search volume, and email open rates to reveal whether revenue issues stem from low visibility rather than product-market fit.
- Product performance analysis tracks how individual products or features contribute to overall revenue, including conversion rates by product type and top-performing product combinations that reveal cross-selling opportunities.
![]()
Drive Growth Through Revenue Analytics with Userpilot

What metrics matter most in revenue analytics?
You can drown in data if you aren’t careful. I see dashboards with 50 different widgets, and nobody looks at them. To get value from revenue analytics, you need to focus on the key metrics (or key performance indicators) that indicate health and growth potential.
1. Monthly Recurring Revenue (MRR) and Annual Recurring Revenue (ARR)
This is your baseline. However, the total number hides the story. You need to break MRR down into its components:
- New MRR: Revenue from new customers.
- Expansion MRR: Revenue from existing customers upgrading or buying add-ons.
- Reactivation MRR: Revenue from churned customers coming back.
- Contraction MRR: Revenue lost from downgrades.
- Churned MRR: Revenue lost from cancellations.
If your total MRR is flat, but your Churned MRR is high, and your New MRR is high, you have a leaky bucket problem. You’re burning cash flow to replace customers who leave. You need to look at churn reasons immediately.
2. Net Revenue Retention (NRR)
If I could only pick one metric to judge a SaaS business, it would be Net Revenue Retention (NRR).
This metric measures what percentage of recurring revenue is retained from existing customers over a specific period, including expansion revenue, downgrades, and cancellations.
If your NRR is over 100%, you can stop acquiring new customers today and still grow. That’s the holy grail. It means your account expansion strategies are working.
3. Customer Lifetime Value (CLV)
How much is a customer worth to you? This dictates how much you can spend to acquire them. If you don’t know your CLV, your marketing budget is a guess.
The basic formula is:
CLV = (Average Revenue Per Account × Gross Profit Margin %) / Revenue Churn Rate
For example, if your average customer pays $100/month, you have a 70% gross margin, and a 5% monthly revenue churn rate, your CLV is ($100 × 0.70) / 0.05 = $1,400. That means you can afford to spend up to $466 to acquire that customer and maintain a healthy 3:1 LTV:CAC ratio.
We wrote a deep dive on SaaS Metrics 101: Lifetime Value that breaks down the math and different calculation methods depending on your business model.
4. Customer Acquisition Cost (CAC)
This is the total cost of sales and marketing efforts needed to acquire a new customer. The golden rule in SaaS is to keep your LTV:CAC ratio at 3:1 or higher.
Revenue analytics allows you to break down CAC by channel.
For example, you might find that LinkedIn ads bring in customers at a high cost, but those customers have a terrible retention rate. Meanwhile, your SEO efforts might bring in slower leads that stay for years.
5. ARPU (Average Revenue Per User)
This metric tells you if you’re extracting enough value from your user base. While transaction-based businesses might track average order value or average deal size, SaaS focuses on ARPU.
If your user count is growing but your revenue isn’t, your ARPU is dropping. You might be attracting the wrong type of customer, or your pricing strategy is off.
The formula is straightforward:
ARPU = Total Revenue / Total Number of Users
For instance, if you have $50,000 in monthly revenue from 500 users, your ARPU is $100. Track this monthly to spot revenue trends. If it starts declining, you’re either discounting too aggressively, attracting lower-value customers, or failing to drive upgrades from existing users.
6. Churn Rate
Churn is the silent killer. You need to track both customer churn (logos lost) and revenue churn (dollars lost).
Sometimes you lose a lot of small customers, which looks bad on a logo basis but barely impacts revenue. Other times, you lose one enterprise client, and it tanks your quarter.
I always look for leading indicators of churn. For example, if a user stops using a core feature, they’re likely to cancel. By setting up churn analytics, you can intervene before it’s too late.
How to implement revenue analytics
Knowing the metrics is easy. Setting up a system to track them and act on them is the hard part. Here’s how I approach it.
Step 1: Centralize your data
You need to bring your revenue data streams together, which involves integrating your payment processor (like Stripe), your CRM (like Salesforce or HubSpot), and your product analytics tool.
At Userpilot, we make this easier through webhooks, APIs, and native integrations with common analytics and CRM tools. Our goal is to help you create a single source of truth where you can see both what users do in your product and how much they pay.
Here’s a practical example of how to set this up:
- Integrate Stripe to pass plan type, MRR, and billing status into your analytics platform.
- Connect HubSpot or Salesforce to pass account tier, lifecycle stage, and company size.
- Then, use Userpilot to track feature usage and key activation events across plans.
At this point, you’re not “doing revenue analytics” yet. You’re creating the conditions for it. Even before you run deeper analysis, centralized data lets you act on revenue context inside the product.
That’s how Amplemarket prevents involuntary churn. Their RevOps team needed better visibility into upcoming renewals and a way to make that information actionable for end users.
They pulled renewal data from Salesforce and used Userpilot to show in-app banners to users with renewals due in one or three months.
As Awni Shamah, their Staff Product Manager, explained:
“RevOps wanted to ensure everyone is aware of upcoming renewals. So they pulled data from Salesforce and used Userpilot to show a banner to users with renewals due in one or three months.”
But it doesn’t stop there. Once you’ve done setting up all the integrations, you’re no longer limited to one-off actions like renewal reminders. The same centralized dataset can help you answer questions, such as:
- Which features are most commonly adopted by accounts that upgrade from Starter to Growth?
- Where do high-ARR accounts stall before renewal?
- Are churned accounts failing to reach a specific activation milestone?
Step 2: Segment your customers
If you look at your average revenue per user, you might miss the fact that you have two distinct groups: a large group of low-paying hobbyists and a small group of high-paying enterprises.
I use customer segmentation to group users by plan type, industry, company size, or signup date. This allows me to see patterns.
For instance, I might discover that customers from the healthcare industry have a 20% higher retention rate than those in retail. That insight immediately informs our marketing strategy.
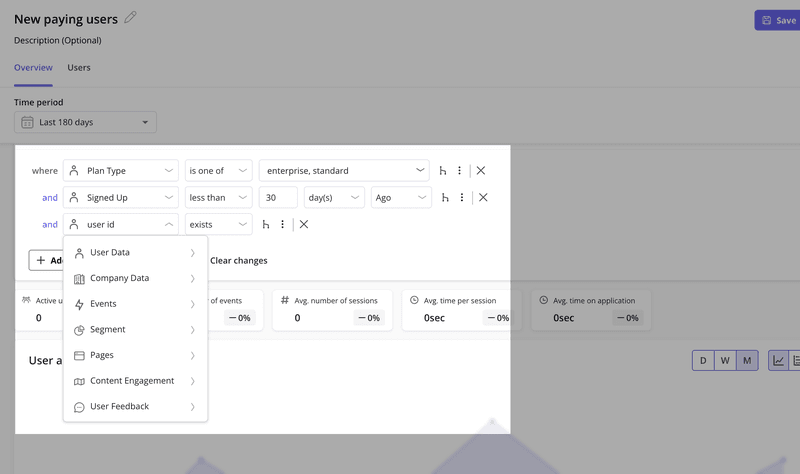
With Userpilot, you can create segments based on dozens of conditions, including user properties, company data, feature usage, and behavioral patterns. Then you can analyze revenue metrics for each segment separately to find underserved market segments.
Step 3: Analyze the customer journey
Revenue doesn’t happen in a vacuum. It’s the result of a user journey. You need to map out the path users take from signup to payment to expansion across the entire customer lifecycle.
I use funnel analysis to see where users drop off. Are they getting stuck during the free trial? Are they failing to convert from monthly to annual plans? By visualizing the conversion path, you can spot the friction points that are costing you money.
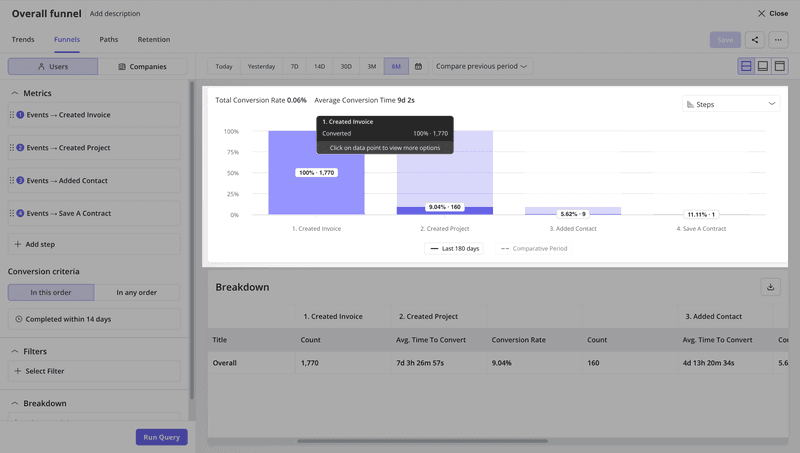
For example, you might discover that 60% of trial users complete onboarding, but only 30% activate a key feature. That gap represents lost revenue growth opportunities. You can then A/B test different onboarding flows to see which one drives better activation.
Step 4: Connect usage to revenue
This is the most critical step for product teams. You need to know which features drive revenue. We call this feature adoption analysis.
If you find that users who engage with your Reporting feature have a 3x higher LTV than those who don’t, your goal becomes clear: get more users to use Reporting. You can build interactive walkthroughs or tooltips to guide users to that feature, directly influencing your future revenue.
We saw this with Kommunicate, a customer support platform.
“When we first launched our onboarding experiments in Userpilot – the percentage of signup-to-chatbot-integration was lingering on 40-45%; after about 7 months it’s at 55-60% now. That can be attributed to both Userpilot and our customer support team’s contribution. An increase of over 15 percentage points is very substantial for us since chatbot integration is a highly scored metric as a strong conversion cue.”
How revenue analytics drives growth
Data analysis without action is just overhead. Once you have your revenue management analytics running, you need to use it to drive decisions. Here are three ways I apply these insights.
Optimizing pricing strategy
By analyzing willingness to pay across different segments, you can adjust your packaging for better price optimization.
For example, if you see that small businesses barely use your advanced security features but enterprise clients use them heavily, you can move those features to a higher tier.
This protects your entry-level pricing while capturing more value from those who can afford it.
Driving account expansion
Your existing customers are your best source of revenue. Revenue analytics helps you identify upsell opportunities. If a customer is hitting 90% of their usage limit, that’s a trigger for your sales team to reach out.
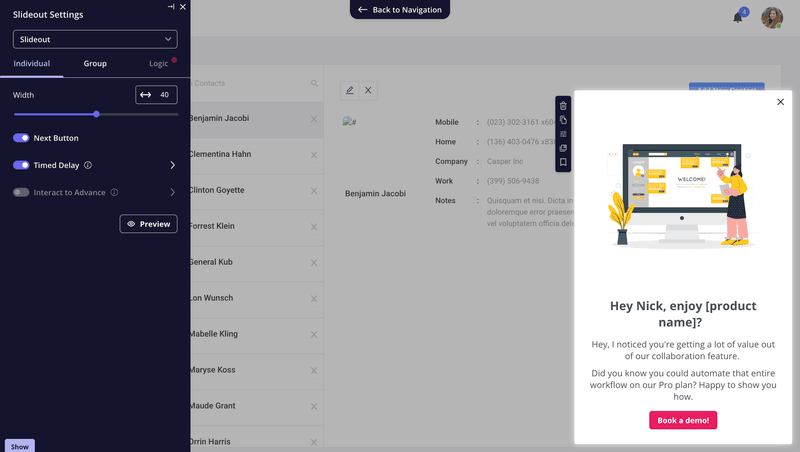
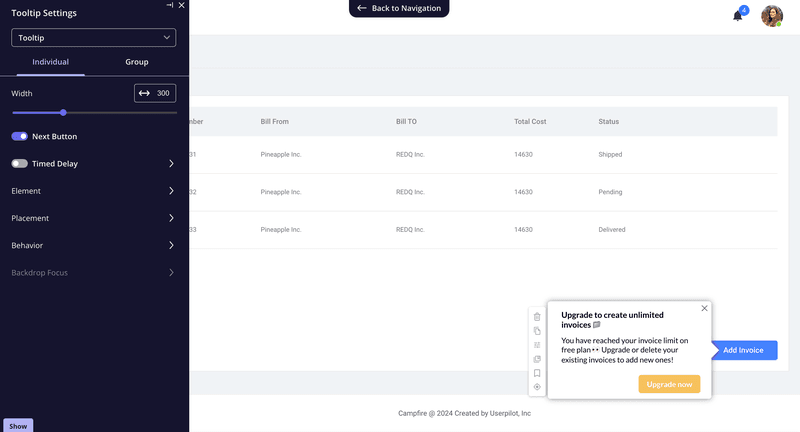
You can also automate this in certain cases. For example, we use in-app contextual messaging to prompt users to upgrade when they attempt to access a gated feature.
This is a classic product-led growth tactic that relies on knowing exactly when a user is ready to pay more.
The timing matters too. If you show upgrade prompts too early, you annoy users. Too late, and they’ve already found a workaround. Revenue analytics tells you the exact moment when upgrade intent is highest, refining your sales tactics.
Reducing churn proactively
Most companies try to save customers after they’ve already hit the cancel button. That’s too late. With revenue analytics, you can build a churn prediction model.
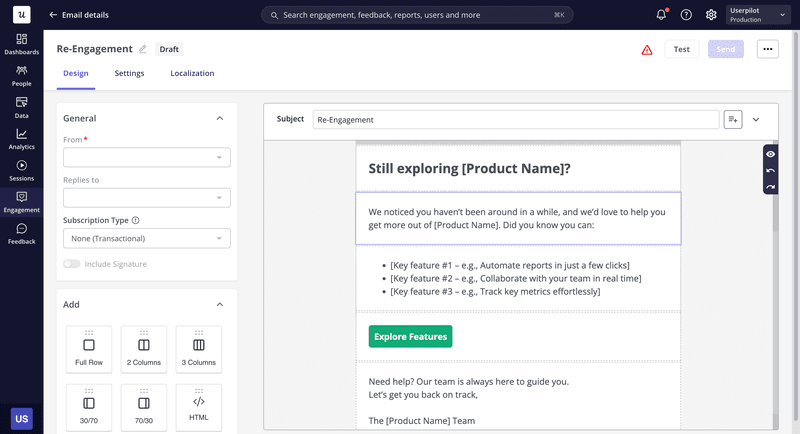
If you know that users who haven’t logged in for 14 days are 50% likely to churn, you can trigger an automated re-engagement email sequence or a push notification on day 10.
You can identify at-risk customers based on their usage patterns and intervene before they decide to leave.
This shifts you from reactive firefighting to proactive customer retention. You stop losing customers and start saving them.
Common pitfalls to avoid
I’ve made plenty of mistakes implementing revenue analytics. Here are a few to watch out for.
Focusing on vanity metrics
Total registered users is a vanity metric. It always goes up (unless you delete accounts), but it doesn’t pay the bills. Active users and valuable customers are what count. So, be ruthless about cutting vanity metrics from your dashboards.
If a metric doesn’t influence a business decision or help you reach your revenue goals, remove it. Your dashboard should tell a story about revenue health, not stroke your ego.
Ignoring the “silent” majority
It’s easy to focus on the loud customers who complain or the most valuable customers (power users) who love you. But revenue analytics often reveal a silent majority of users who are slowly disengaging. They don’t submit support tickets to express their frustration. They just leave.
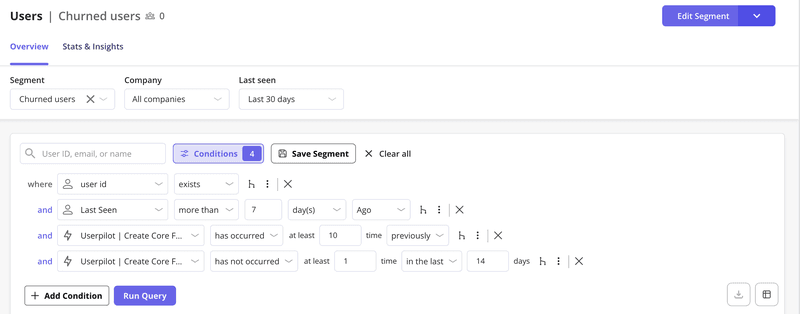
You can segment inactive users based on engagement metrics like last login date, feature usage decline, or engagement drop-off.
Then use session replays to watch how these customers respond to your UI and fix their issues before they churn.
Our upcoming AI agent will soon make it easier for you to surface churning users based on behavioral signals. Join the beta program to get early access to Lia, our product growth agent.

Analysis paralysis
You can spend months building custom dashboards and never make a decision. Instead, start small, pick one metric, like improving activation rate for new signups, and use data to improve it. Then move to the next.
Get visibility into what grows revenue with Userpilot
Revenue analytics means understanding the handful of metrics that predict whether your business will grow or die.
The companies that win are the ones that can answer questions like:
- Which customers are about to churn?
- What features drive upgrades?
- Where should we invest our product roadmap?
At Userpilot, we help product, customer success, and growth teams connect usage data to revenue outcomes to identify opportunities.
You can track which features drive expansion, identify churn risk before it impacts your bottom line, and build in-app experiences that guide users toward higher-value behaviors.
Book a free demo with Userpilot and see how we help teams turn product data into predictable revenue growth and gain insights you can actually use.
![]()
Predict Revenue Using Revenue Analytics within Userpilot
About the author