The Product Adoption Curve in the AI Era: How to Improve Adoption at Every Stage


The product adoption curve has always shown us that different users adopt new technology at different times and for entirely different reasons. That same dynamic is now playing out across SaaS products when it comes to AI-powered features, which changes how every team needs to think about their user base. 88% of organizations are either exploring or piloting AI agents, meaning some of your customers are already building custom agentic pipelines while others get uncomfortable at the mere mention of AI.
This guide will map out the five stages of the product adoption curve, cover what each segment wants from AI features in SaaS products, and provide eight actionable strategies to improve adoption across every group.

Five stages of the product adoption curve
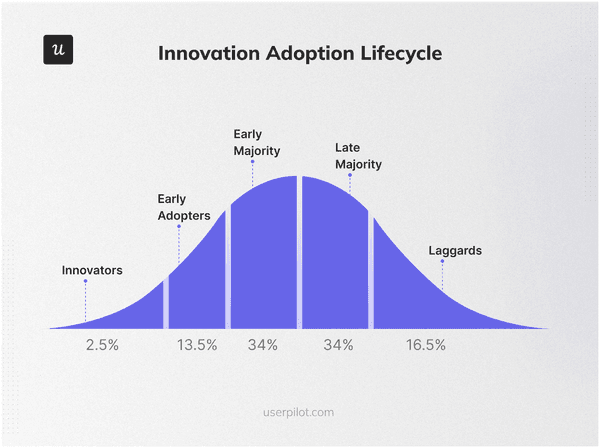
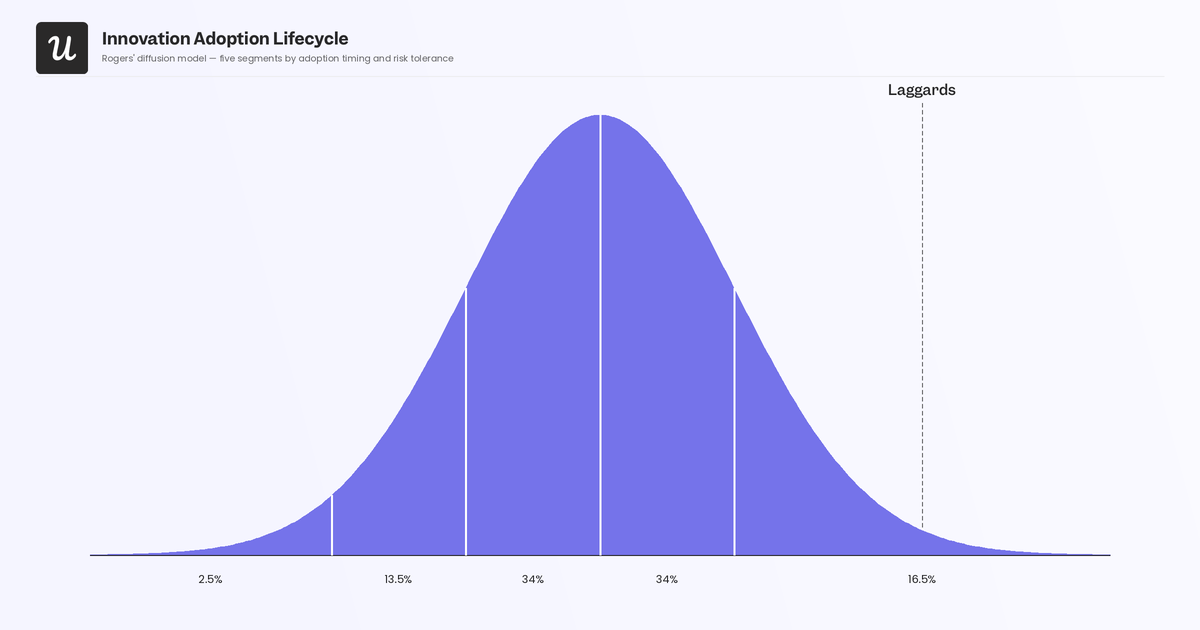
The product adoption curve maps how five distinct customer segments adopt new products at different rates, visualized as a bell curve. It’s shaped that way because markets adopt new products starting with a small group of innovators, accelerating from early adopters to late majorities, and then decelerating as laggards are the last to come aboard.
Stage 1: Innovators
Innovators are the first to adopt and make up just 2.5% of the market. They’re technology enthusiasts who pride themselves on being among the first to try unproven products. They value products based entirely on potential over polish and flexibility over reliability.

These risk-takers are looking to explore what’s possible with new technology before anyone else. As such, they’re far more resistant to bugs, missing features, and rough edges than anyone downstream on the product curve.
The trade-off is that innovators are often more price sensitive and harder to retain because they like to pilot multiple products and identify the most promising candidates that are worth focusing on further. They also respond very well to exclusivity (e.g., invite-only access, early-release programs, or closed betas) as it gives them a sense of being part of a small group with privileged access to cutting-edge technology. Their enthusiasm can provide early and detailed feedback that must be captured immediately before they’re distracted by the next shiny object.
In the AI era, innovators are the segment most willing to take on the full legwork of building out a custom agentic setup. They want raw agent frameworks to build with, direct API access, and MCP server connectivity to assemble pipelines on their own. This makes innovators valuable well beyond their direct revenue because the outcomes they achieve at the frontier of your AI functionality can be turned into case studies that serve as the social proof early adopters are waiting to see before trying things out for themselves.
How to improve product adoption among innovators
Release an early version of your product to innovators before it’s fully polished, and use what you learn from them to improve it. Focus your value proposition around what’s unique about your product then offer free trials, introductory discounts, and invite-only exclusivity. Creating genuine scarcity works for this group in a way that an open beta program simply couldn’t. For AI features, that could look like adding agent framework documentation, allowing raw API access, and ensuring MCP server connectivity to your early access offering. The innovator segment will push your AI to its ceiling.
Be sure to instrument their usage carefully, interview them on the outcomes they achieve, and ask for reviews on G2 or Capterra. These early data points will become your primary proof assets for later segments.
Stage 2: Early adopters
Early adopters represent 13.5% of the market. Unlike innovators, they have the budget to invest in technology that solves the problems they’re currently facing, but want to see proof before piloting new tools. They’re often thought leaders in their space, highlighting disruptive tools if they’re able to produce real results.
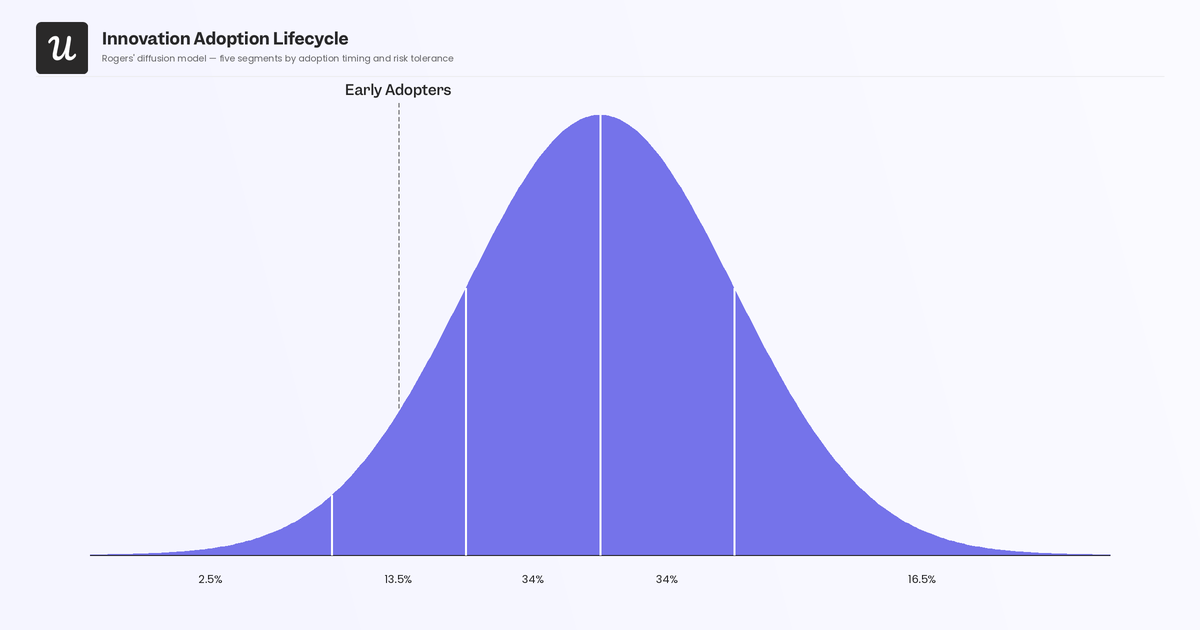
User adoption among this segment is substantially easier to win than with the early majority, but only if you’ve already collected credible evidence from innovators who pioneered your product. Without that proof, early adopters are just as immobile as the more pragmatic segments that follow. They’re the segment that reads case studies, checks reviews, attends webinars, and does anything else they can to ensure products are mature enough to meet their risk tolerance before moving forward.
Early adopters won’t usually build custom agent frameworks from scratch either, but they’ll gladly pilot AI features that offer meaningful value without requiring manual infrastructure setup. Features that use Retrieval-Augmented Generation (RAG) to pull from existing databases and respond to natural language queries are highly appealing to this group due to the immediate insights that require zero setup to extract. Lia, Userpilot’s AI agent, is a prime example of a feature that would get early adopters excited because the idea of being able to ask a question and get relevant metrics to answer it is the exact type of concrete use case they’re looking for.
The same applies to AI-powered chatbots that can reduce support ticket volume by answering frequently asked questions and routing customers to the right human agent for complex cases, because these too are outcome-based value propositions. What early adopters have less tolerance for is technical issues or missing features that block them from experiencing the value they expected. They need end-user support and expect a greater degree of customization than later segments.
How to improve product adoption among early adopters
Use feedback from your innovator cohort to improve the product meaningfully before early adopters arrive and focus relentlessly on reducing-time-to-value. Early adopters are attracted to value propositions that emphasize customization and support. Show them the inner workings of the product and give them clear evidence that previous users have already gotten the same outcomes they’re looking for. For AI features, position both RAG and MCP capabilities as “ask questions, get answers from your data” rather than framing them as a way for early adopters to build something from scratch.
Stage 3: Early majority
The early majority comprises 34% of the market, making this the largest and most commercially significant crossing point on the product adoption curve. Unlike innovators and early adopters, they value business continuity and have no interest in pioneering new technology. They’re slow to decide and prefer to let others thoroughly test new products before committing, often relying on peer references over vendor claims.
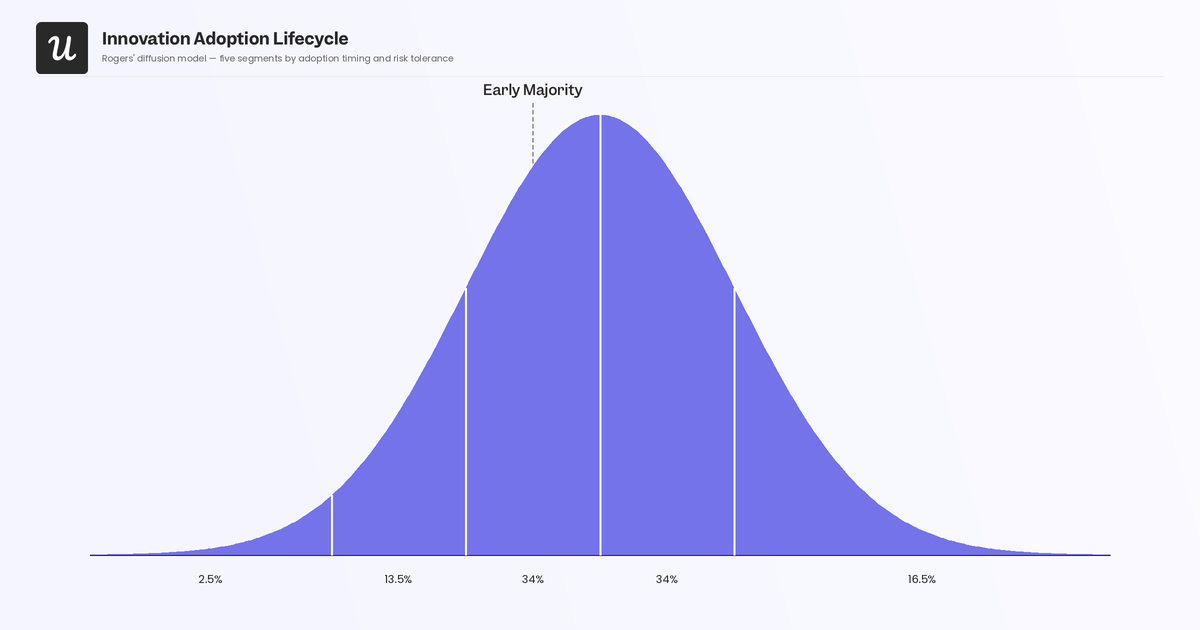
The gap between early adopters and the early majority can be incredibly frustrating to close. These two segments don’t talk to each other as much as the innovators and adopters do, which makes “bridging the chasm” difficult. Instead, the early majority mainly communicates with peers at the same adoption stage. Crossing this gap to achieve meaningful product adoption at scale is where many product innovations fail, but once you do cross it, the rewards are proportionate to the effort required. The early majority contains loyal customers with strong product-market fit and the highest growth potential.
For AI features, the early majority wants to see proven value and packaged functionality. Pre-built native integrations with AI vendors or models appeal to this segment precisely because they list existing workflows rather than leaving open-ended potential to the imagination. Vague AI capability claims are a red flag because the early majority wants to know exactly what the integration can do today rather than what it might achieve tomorrow. If they encounter friction that implies promised AI benefits haven’t fully materialized yet, they’ll likely churn before ever reaching the activation point that would retain them long-term.
How to improve product adoption among the early majority
Consolidate all prior feedback to identify the specific pain points this segment cares most about like long installation times, complex workflows, and unclear ROI. Prioritize product updates that directly address the early majority’s documented pain points instead of expanding the scope to accommodate every demand from the early adopter segment. The early majority cares more about how popular the product is, who else is using it successfully, and what they achieved rather than feature velocity.
Stage 4: Late majority
The late majority is roughly equal in size to the early majority at around 34% of the market. This is where the bell curve peaks before it begins to decline. Users in the late majority are conservative and adopt out of necessity rather than curiosity. Disruption to established workflows carries real operational risk for this group, so they’d rather arrive late to innovations if it means taking on less risk.
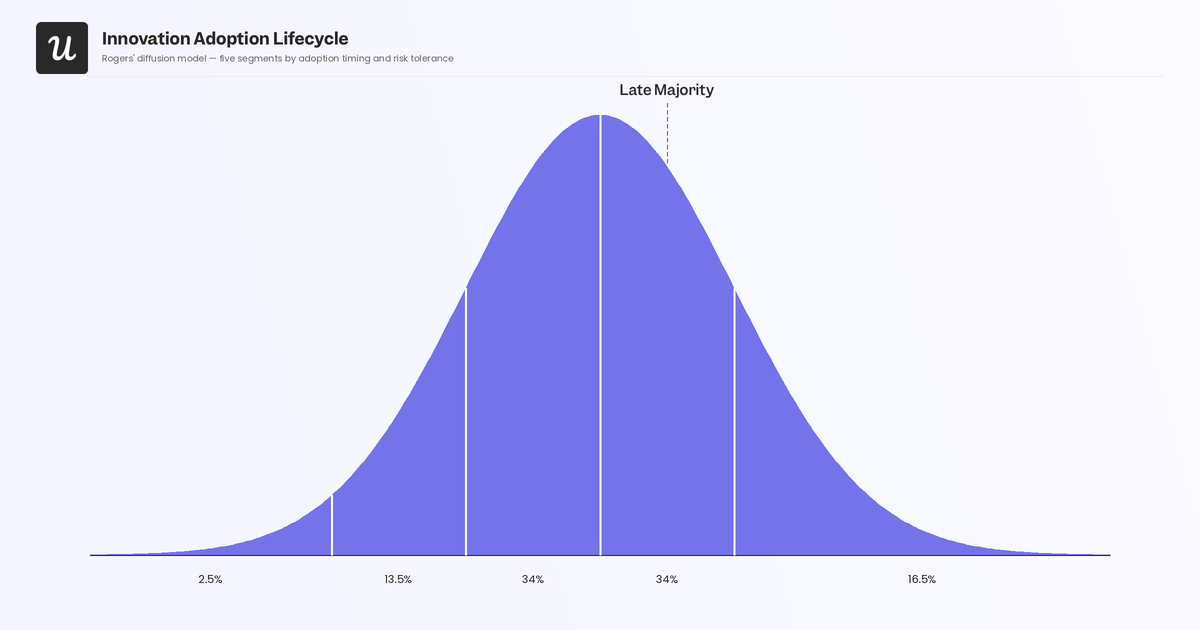
Because the late majority make their risk calculation based on avoiding failure rather than capturing gain, they can be more cost-sensitive when testing new products and have less of a tolerance for long implementation timelines. This group recognizes that failing to adopt a widely accepted product puts them at a competitive disadvantage and that recognition (rather than genuine enthusiasm for the technology itself) is what eventually drives adoption. For AI features, the late majority will encounter them after the technology is barely advertised as AI-powered anymore. By then, AI will just be part of how the product works, like how cloud hosting is now standard.
How to improve product adoption among the late majority
Combat late majority skepticism by making the transition to your product as frictionless as possible. Show them which of their industry peers and competitors are already successfully using your product, framed around the competitive disadvantage of not adopting rather than the benefits of adopting early. At this stage, market awareness and objection-handling matter more than feature innovation. For AI specifically, strip AI terminology from all messaging targeting late majority user segments and replace it with outcome-led copy. “Automatically identifies your three highest-friction onboarding steps” will land better with this group than “AI-powered analytics.”
Stage 5: Laggards
Laggards are the final adopting segment, making up the remaining 16% of the market. They’re skeptical of change, less comfortable with new technology, and tend to value traditional ways of doing things. They’ll eventually adopt, but only when their existing tech stack is no longer an option and similar alternatives have been exhausted.
For SaaS products with AI features, laggards should still be able to reach their activation milestones and complete their jobs to be done without configuring any AI themselves. Where AI should be used is under-the-hood infrastructure (direct API calls that the product handles invisibly) that the laggard never sees or configures. If interacting with AI directly is the only way for laggards to accomplish a workflow they came to the product for, they’re likely to churn and find a competitor that still offers more traditional paths.
How to improve product adoption among laggards
Laggards need more direct guidance than any other segment, which makes in-app onboarding flows that walk them through the product step by step incredibly valuable. Use in-app messaging to reduce friction at the points where this group is most likely to drop off. Continue to maintain non-AI paths to every core activation milestone alongside new AI-powered options. When AI runs as invisible infrastructure, don’t surface it as a user-facing configuration step that could be off-putting to this segment. Audit all sales messaging targeting laggard-profile accounts and remove AI jargon entirely, focusing instead on operational outcomes and reliability claims.
Crossing the chasm
For B2B and enterprise SaaS companies, crossing the chasm is where most product innovations either succeed or die. The gap between early adopters and the early majority reflects a fundamental difference in what each group wants. Early adopters are visionaries who can tolerate ambiguity and bet on potential. The early majority are pragmatists who want proof, reliability, and a concrete list of already-working outcomes before they commit.
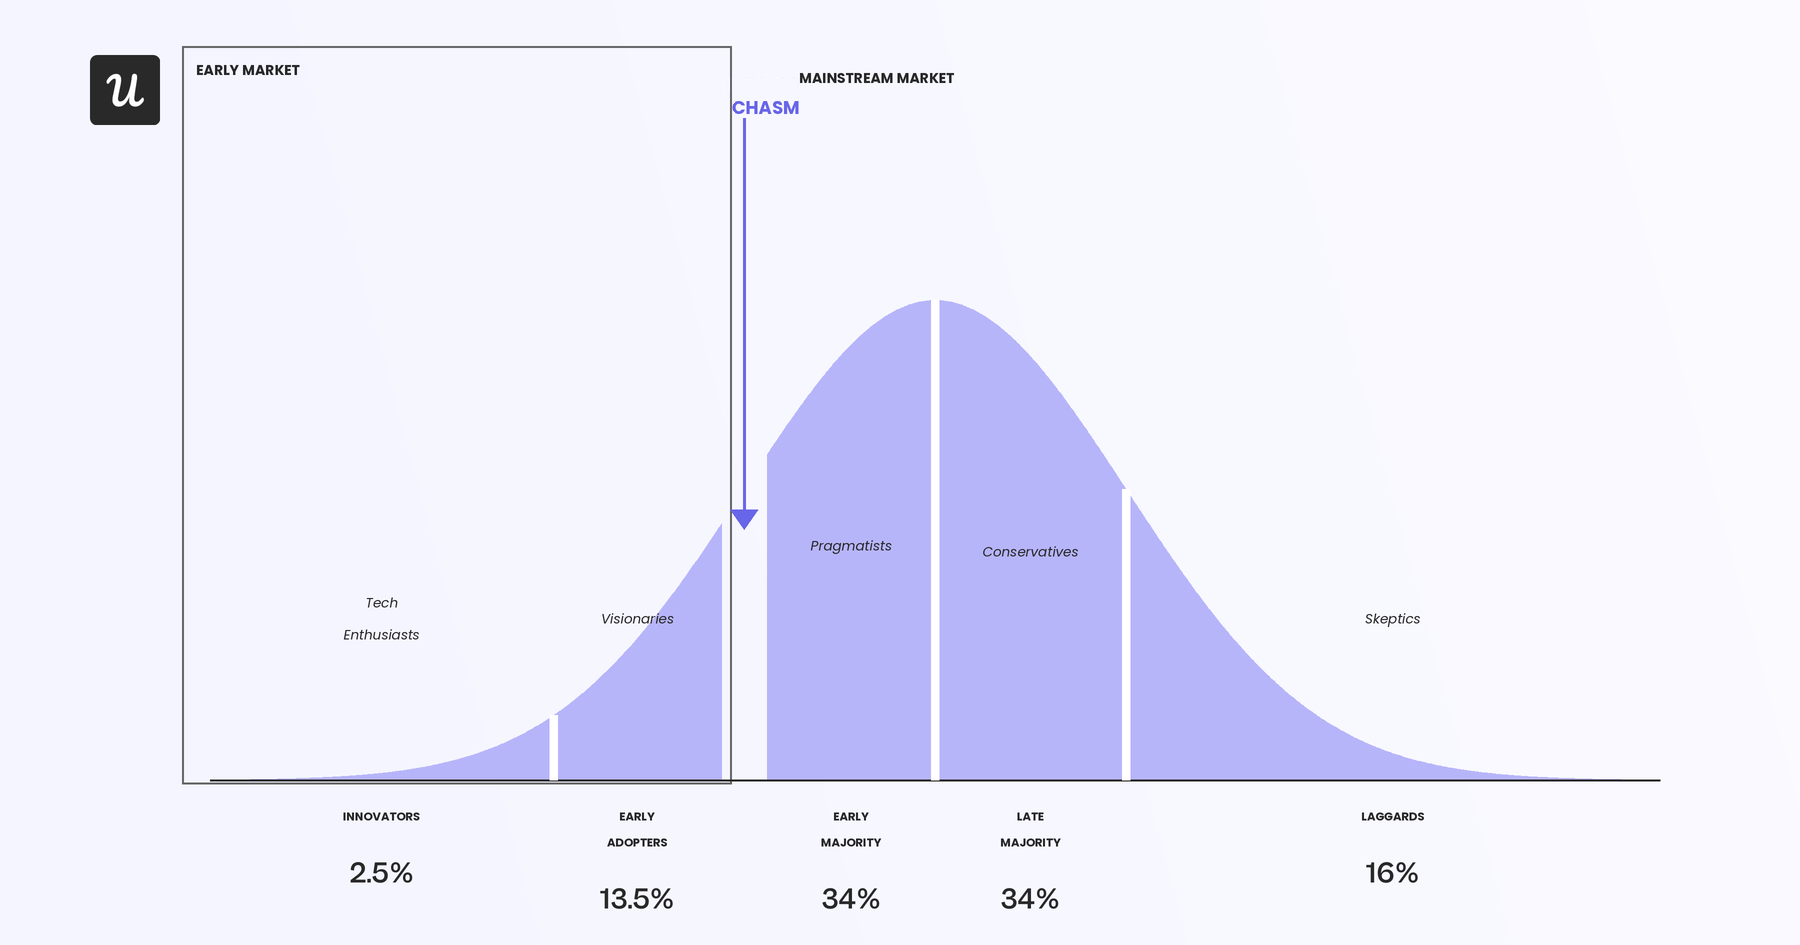
The best way to cross the chasm is to focus your entire narrative on solving a single well-defined pain point within a single target market, use all available evidence of momentum, and ensure your single most important feature works flawlessly at scale. Fragmented positioning and a feature-first narrative are what keep products stuck on the early adopter side of the chasm, appealing only to visionaries while confusing pragmatists and alienating laggards. Your innovators may be actively building custom agent frameworks within your SaaS product while your early majority is waiting for a pre-built AI integration that proves its value in a specific workflow.
Put simply, crossing this internal chasm requires a messaging shift from “look at the potential” to “here are the specific workflows that this already handles today” in order to appeal to pragmatists.
8 Ways to use the product adoption curve to acquire and retain SaaS users
The stages above describe how different customer segments behave but the strategies below will show you how product management, product marketing, and customer success translate that understanding into action. Each strategy targets a specific lever from your AI feature roadmap decisions to your onboarding flows and even the messaging copy your sales team uses for laggard-profile ICPs. Increasing user acquisition and product adoption within one segment of the product curve also makes it easier to appeal to the next, using social proof from their outcomes and creating a flywheel that carries momentum from innovators all the way to the late majority.
1. Apply Rogers’ five subfactors when evaluating new AI features
Everett M. Rogers’ Diffusion of Innovations identifies five characteristics that determine how fast and widely a product gets adopted:
- Relative advantage: Does it improve on the existing solution?
- Compatibility: Does it fit into users’ existing workflows?
- Complexity: How hard is it to get value from it?
- Trialability: Can users try it before committing?
- Observability: Can users see others getting value from it?
Any thoughtful product manager will recognize these as the same five questions they ask when deciding what to build next.
For AI features, complexity is often the most decision-relevant subfactor. Any AI feature that requires users to configure LLMs, write prompts, or understand agentic infrastructure is high-complexity by definition. This is fine for innovators and even workable for early adopters, but can be a churn driver for the early majority (or anyone who comes after). Trialability maps to your AI feature access tiers while observability is why publishing innovator outcomes compounds so hard into acquiring early adopters.
Geoffrey Moore’s Crossing the Chasm warns that you shouldn’t try to satisfy every innovator’s demand or you’ll end up with a product built for one small team’s specific setup and can’t be adopted by any segment that follows.
2. Use innovators as your AI feature beta cohort and capture case study outcomes systematically
Innovators are the only segment willing to tolerate an unpolished AI feature while still giving you meaningful feedback on what it’s able to achieve when working as intended. Most teams use innovators informally with a few power users who test new things and send the occasional support tickets, leaving the most valuable part of the relationship on the table. The better approach is to structure the relationship deliberately by giving innovators early API or MCP access with minimal UX polish and instrumenting their usage carefully with event tracking and user segmentation then scheduling interviews specifically around outcomes achieved.
Because AI makes it so much cheaper and faster to ship features, many product teams are releasing 6-7 features per quarter, which makes it even harder to manually track adoption and understand what’s actually working.
Building a structured innovator cohort solves two problems at once because you get usable feedback fast and generate the case study material that nudges early adopters across the line. The case studies that result from this process become your primary proof asset for attracting early adopters who need documented evidence of real-world potential before they pilot. Without them, you’re asking early adopters to take a bet on marketing copy instead of proven outcomes.
3. Generate word-of-mouth from early adopters with high NPS scores
Early adopters are thought leaders in their industries. Their public endorsements carry more weight with the early majority than any brand marketing you could produce because the early majority primarily trusts peer references over vendor claims. Identify early adopters who score a 9 or 10 on their post-adoption NPS survey, then trigger an in-app prompt asking them to share their experience on G2, Capterra, or even LinkedIn. This is the fastest organic path to bridging the communication gap between early adopters and the early majority.
Early adopters who have successfully piloted an AI feature are also more willing to participate in case studies, co-marketing, and reference calls, which compounds the relationship value across multiple acquisition stages.
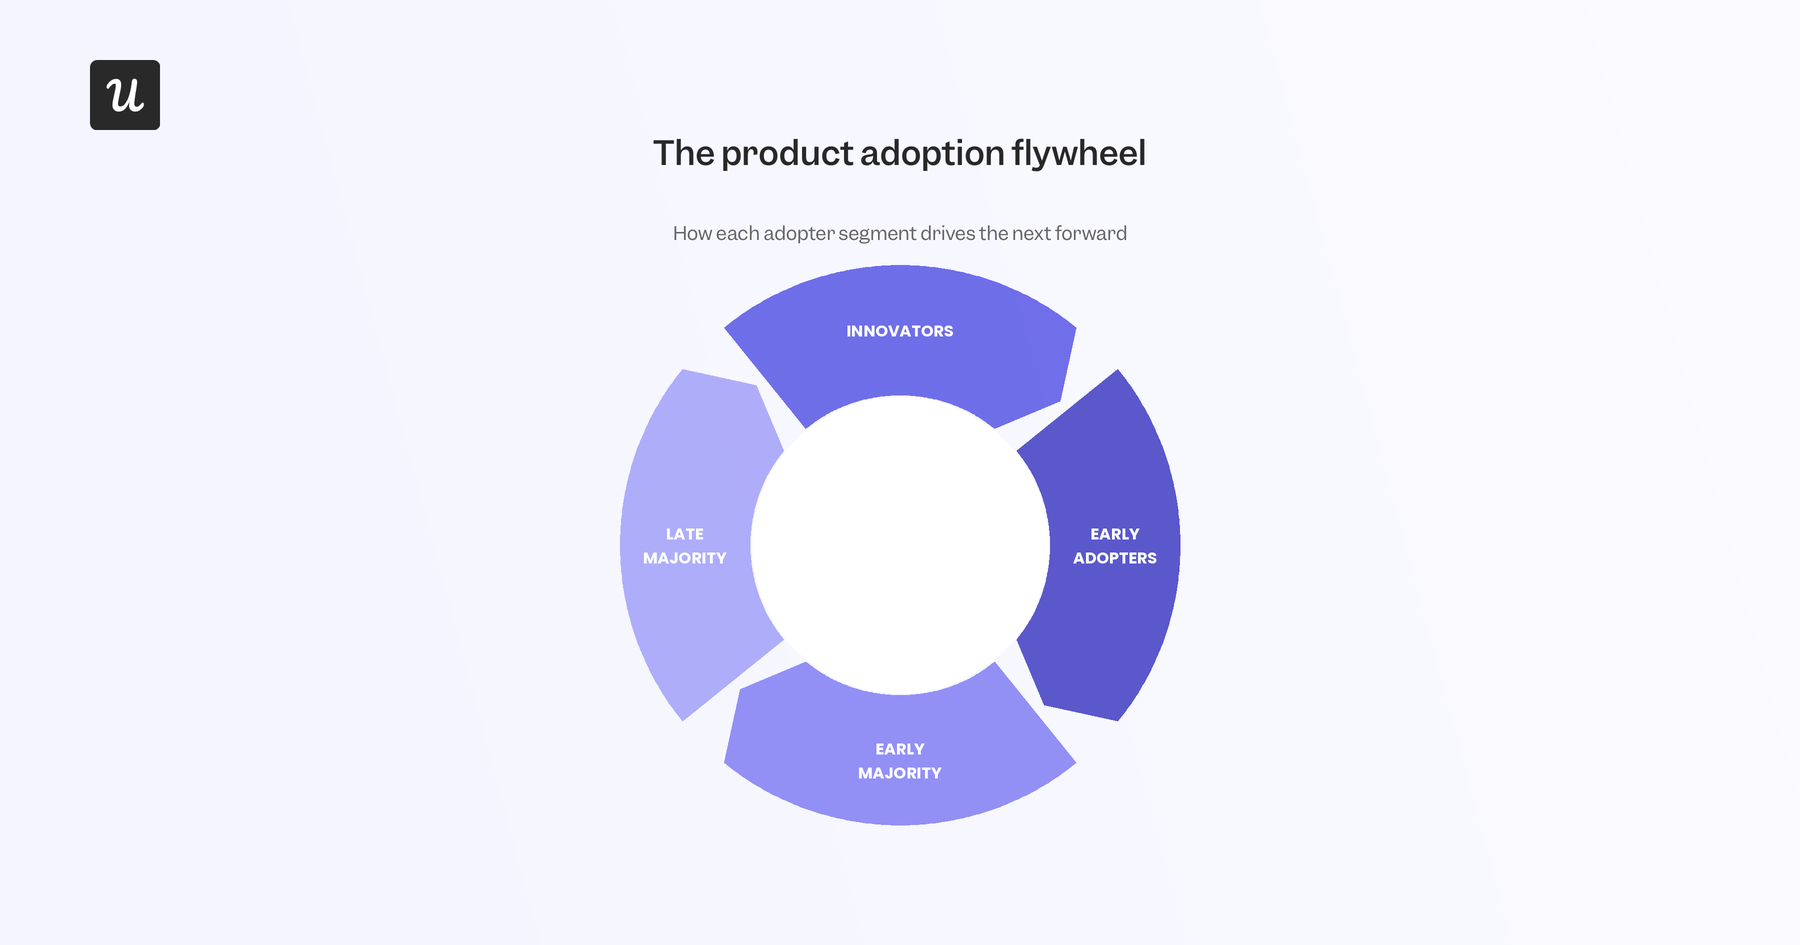
4. Structure your GTM motion around the adoption flywheel
The five adoption stages don’t just describe individual user behavior but a compounding sequence. Innovators prove what’s possible with your product, early adopters realize genuine potential, the early majority adopts at scale once they have peer validation, and the late majority follows once the product is the de facto standard in their industry. Each stage’s adoption is the engine for the next. Laggards don’t move on the same flywheel dynamic because they adopt once alternatives disappear rather than due to social proof from earlier segments.
Customer success and sales should still be resourced to handle laggards given their market share, but GTM resources are better concentrated on the first four stages that actually feed into each other.
5. Cross the chasm by shifting AI messaging from “build your own” to “here’s what it already does”
Moore correctly identified that the early adopter framing is aspirational (“you can reshape how your team works”) while the early majority framing is concrete (“here’s exactly what you get on day one”). These are not the same message, and trying to use early adopter copy to attract early majority buyers is one of the most common reasons product growth stalls upon reaching the chasm. The equivalent shift for SaaS products with AI features is going from “you can build custom agent workflows on top of this” to “this integration supports these specific workflows out of the box.”
One speaks to visionaries who want to experiment while the other speaks to pragmatists who want to know what they’re getting.
Building separate messaging tracks for each side of the chasm is the practical implication: not different products, but different narratives about the same product capability. Userpilot’s in-app messaging tools let you segment by adoption stage so that innovator-facing copy and early-majority-facing messaging never land in front of the wrong audience. A/B testing copy variants for the same feature across different user segments can also show you which framing actually drives adoption, rather than which one the marketing team simply prefers.
6. Segment in-app onboarding experiences by adoption stage
Every customer segment needs a different onboarding experience built around their risk profile and AI readiness. Innovators are ready to be served with advanced capabilities and developer documentation immediately, so give them a path to raw API or MCP access from day one. Early adopters need guided onboarding toward AI features, with clear value framing and social proof surfaced at the activation point. The early majority needs proof-forward onboarding that shows the AI feature working before asking for any configuration engagement. The late majority need simplicity-first flows with no configuration steps and AI running in the background.
Lastly, laggards need a traditional activation path with no AI requirements at any step.
The mechanism for delivering these differentiated experiences is a welcome survey that identifies the user’s segment at the start of the onboarding process, followed by branching onboarding flows triggered by the segment tag. Our product manager, Abrar Abutouq, used this approach directly at Userpilot. When funnel data showed a sharp drop-off at domain verification in our email feature, she built a targeted checklist and tooltip inside Userpilot within a few hours. Drop-off closed within days, without an engineering ticket. It’s all about identifying where each adoption profile drops off, building a targeted in-app response, and measuring the result.
7. Lead with outcomes, not AI branding, for late majority and laggard-profile ICPs
AI terminology is a positive signal for innovators and early adopters because it tells them the product is on the frontier. For the late majority and laggards, it reads as complexity and risk. Sales enablement materials, onboarding copy, and in-app messaging targeting these segments should describe what the product helps users accomplish instead of getting into the nitty-gritty of how it accomplishes it. This isn’t just a copywriting tip; it’s a product design and positioning decision that needs to be made deliberately.
When you review your ICP-specific messaging assets, you’re likely to find that the default copy skews toward early-adopter framing because that’s what sounds most impressive internally. Creating outcome-led variants for late majority and laggard-profile segments requires a deliberate audit rather than quick rewrites. Customer success teams working with accounts in the late majority or laggard segments should be running separate conversation tracks that are outcome-led, reference-heavy, and jargon-free.
8. Maintain non-AI activation paths for laggard-profile users
If the only path to a core activation milestone runs through an AI configuration step, laggards will switch to a competitor that doesn’t require it. This is the direct consequence of designing AI features as the primary workflow rather than as additive enhancements. Auditing each activation milestone in your product for the presence of a traditional non-AI path should be a standing item on every product review cycle, not a one-time exercise. Use Userpilot’s funnel analysis to identify where laggard-profile users are dropping off in your current flows.
Session recording then uncovers the specific friction points like an AI configuration prompt mid-flow, a modal explaining an agentic feature they didn’t ask for, or a workflow that assumes familiarity with LLM terminology. Each of those is a fixable handoff point where AI can run invisibly as infrastructure (with the product calling an API on its own) so the experience can remain AI-powered without being AI-visible. Keeping this distinction between AI-powered versus AI-visible explicit in your product design decisions is a practical framework to ensure you never accidentally exclude a 16% market segment that adopts slowly but doesn’t disappear.
The product adoption curve holds true, it just applies to more than ever before
The product adoption curve has always been most valuable as a reminder that your user base is never one audience. Treating your user base as a monolith is how you repel the segments you haven’t converted yet. The same product now needs to speak five different languages with raw infrastructure for innovators, documented proof for early adopters, pre-packaged integrations for the early majority, outcome-led copy for the late majority, and a traditional activation path for laggards who aren’t comfortable peeking under the hood.
An innovator who finds your pre-packaged AI too constrained will move on quickly while a laggard who can’t reach an activation milestone without configuring an LLM will leave for a competitor that doesn’t make that a requirement. Every segment in between has its own set of needs, likes, and dislikes that must be accounted for when designing products (not just when the marketing copy is being written). The eight strategies in this guide covered the user journey of each segment, including the flywheel that connects the first four and the separate motion required for the fifth.
If you want to see how Userpilot can help you build differentiated onboarding flows, identify which adoption stage users are in, and trigger the right in-app experience for their segment, book a demo today!
About the author