![What is User Behavior Analytics? [+ How to Track and Analyze] cover](https://blog-static.userpilot.com/blog/wp-content/uploads/2021/06/what-is-user-behaviour-analytics_2885e81777c23bafb496bbfd8e3338c3_2000-450x295.png)
Try Userpilot Now
See Why 1,000+ Teams Choose Userpilot

What is user behavior analytics?
User behavior analytics or entity behavior analytics is the process of collecting and analyzing data about how users interact with your product or service.
It helps you understand how users use the product, what they value or find frustrating, and areas for enhancement. This understanding, in turn, empowers you to make data-driven and informed decisions to improve the overall user experience.
Why should you track user behavior?
Tracking user behavior unlocks valuable insights about your customers and what they do with your product. With this insight, you can then –
- Enhance the customer experience by analyzing user behavior, identifying where users face difficulties, and then improving these areas.
- Gather insights for product improvement and development using user behavior data, i.e. by determining popular and underused features. For example, if you notice that users rarely engage with a particular feature, you should revamp it or provide more guidance to encourage engagement.
- Drive retention and growth by implementing strategies based on user behavior insights to keep users engaged and coming back regularly.
Different types of user behavior data
The 4 main types of user behavior data that you should track to understand your users better are:
- Engagement: It includes several micro-interactions like clicks, hovers, text inputs, scrolls, etc., and shows how users interact with your product on a micro-level.
- Usage: This data tracks how users use your product over time, how often and long they spend using it, and what features they use the most.
- User journey data: It tracks users’ steps as they interact with your product to help you understand user progression and where they get stuck.
- Feedback: It includes both qualitative and quantitative feedback from users. Quantitative feedback offers insights into user sentiment, while qualitative feedback sheds light on the reasons behind the sentiment.
How to track user behavior?
Let’s go through 5 proven ways to track user behavior data.
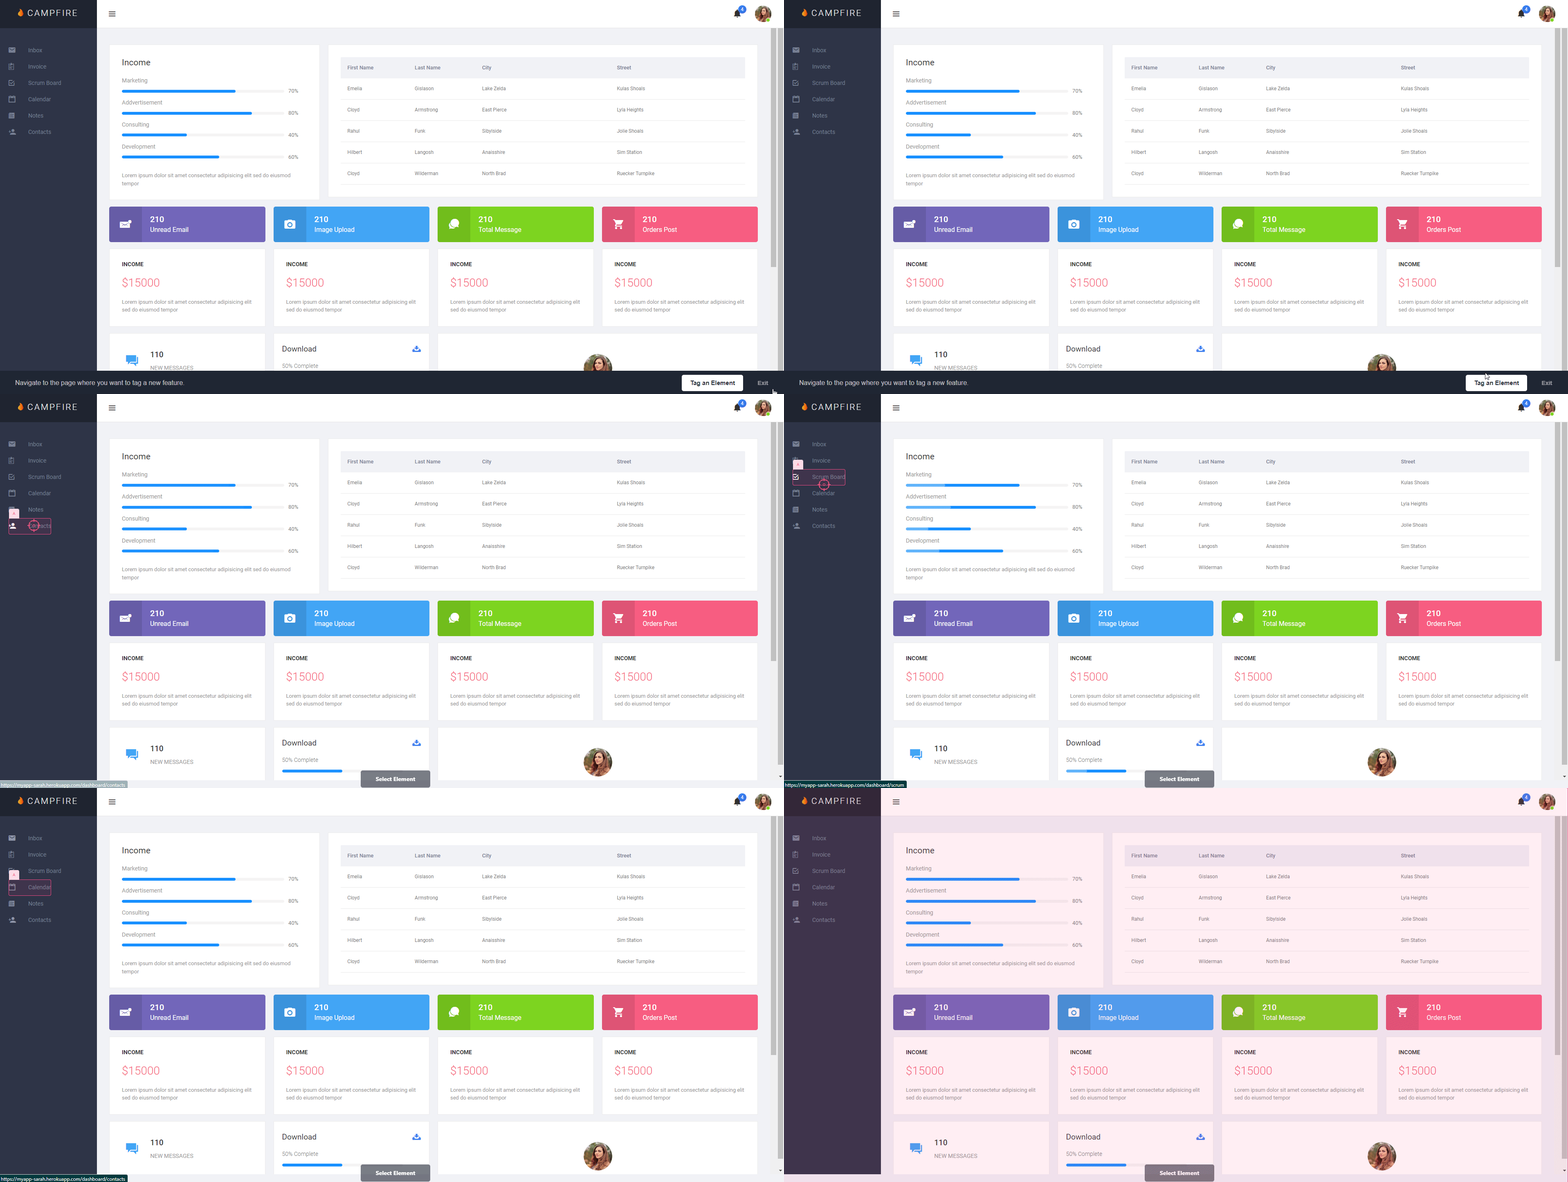
Tag feature to collect product usage data
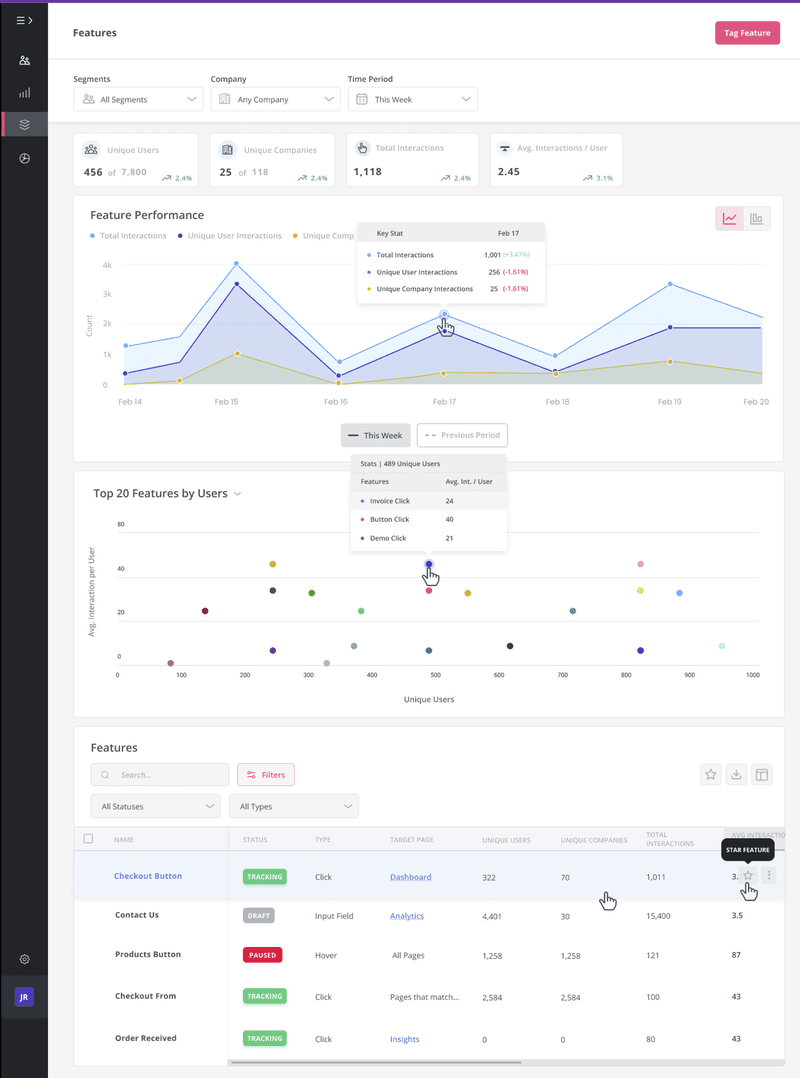
Product usage data provides insights into which aspects of your products are the most engaging for your users. You can collect this product usage data by tagging features in your product.
You first need to identify the core features you want to track. Then by using a UI element selector like Userpilot’s, you can capture feature usage and track interactions such as user clicks, hovers, or text input.
Set up events to track how users interact
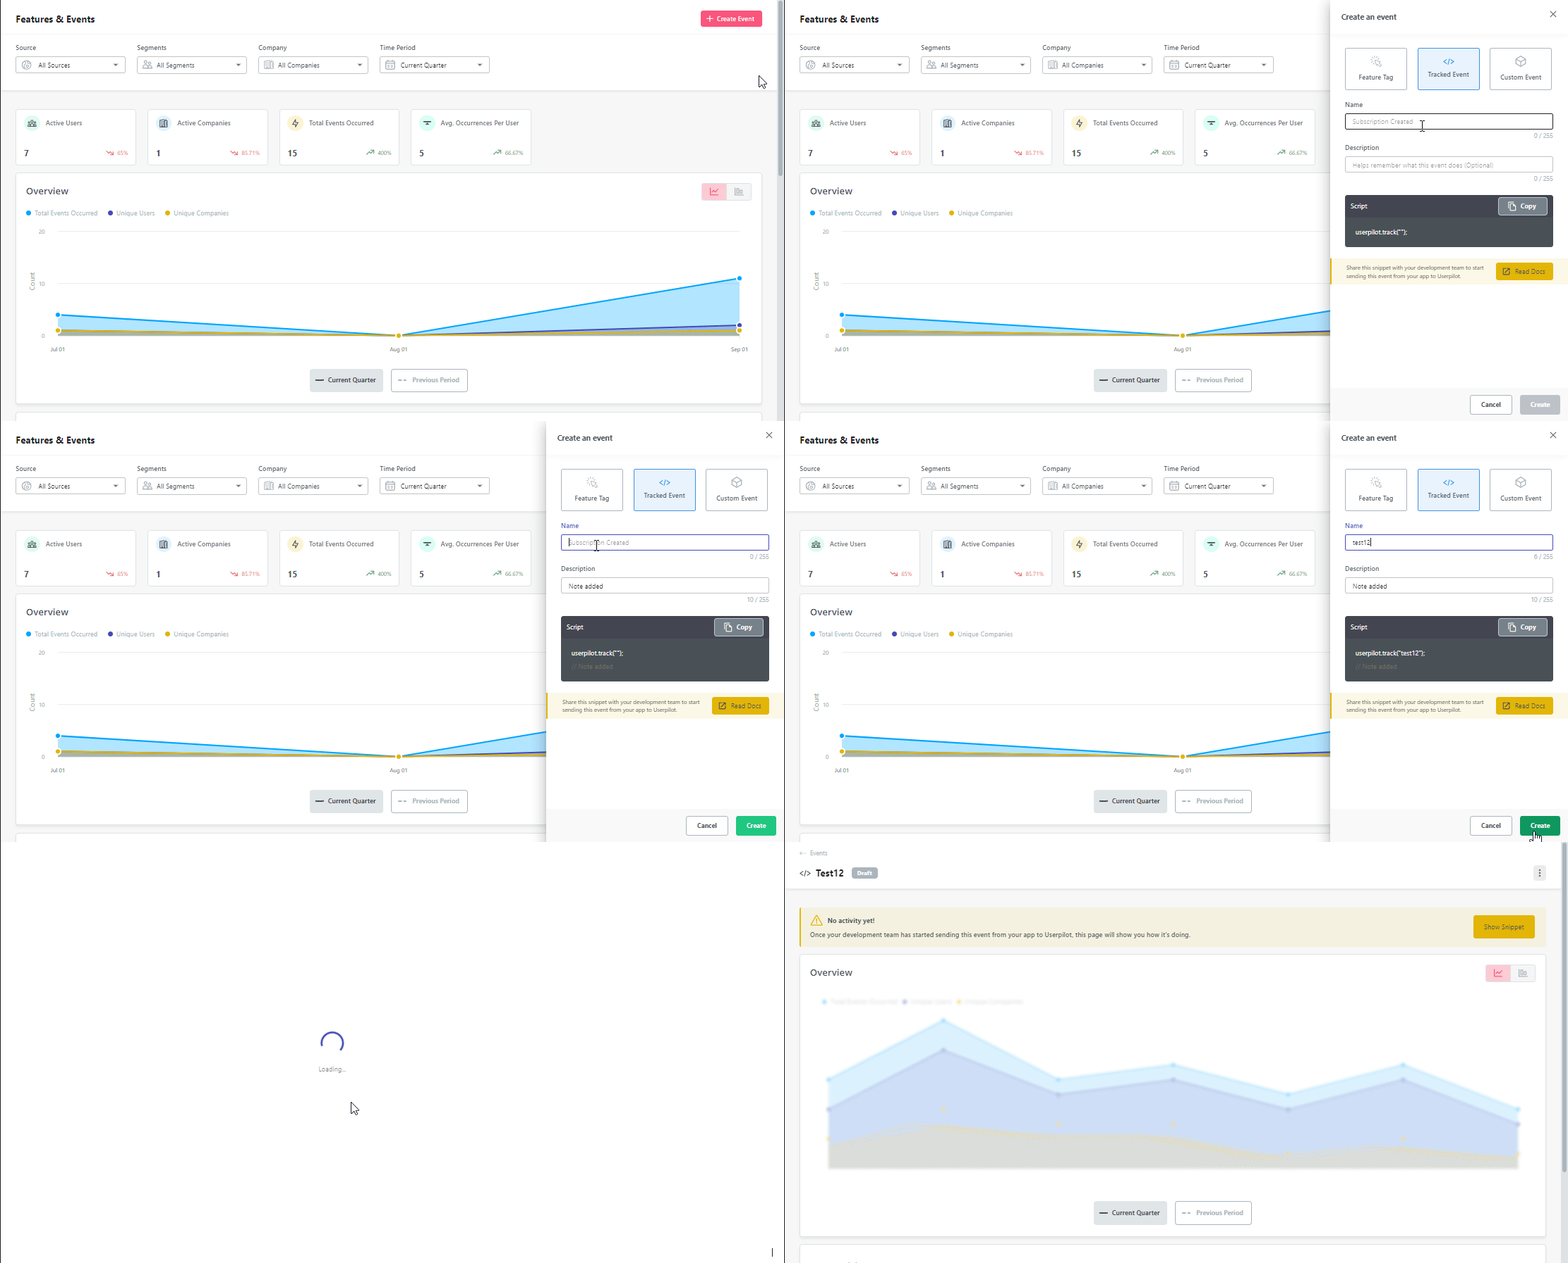
Creating and tracking events lets you monitor how your users interact with and take important actions in your product. You can set both tracked and custom events to track user interactions effectively.
Tracked and customer events are both server-side events, which you can only reach by your server. They include events like email confirmations, tracked data of high-volume events such as marketing campaigns, etc.
- Tracked Events: These represent a single event regarding specific actions or occurrences in your product. You can use it to monitor individual actions within your app, like tracking when a user makes a purchase or initiates a flow.
- Custom Events: On the other hand, custom events group multiple events together so you can monitor a set of related actions, i.e. for tracking product adoption.
Send in-app surveys to collect user feedback
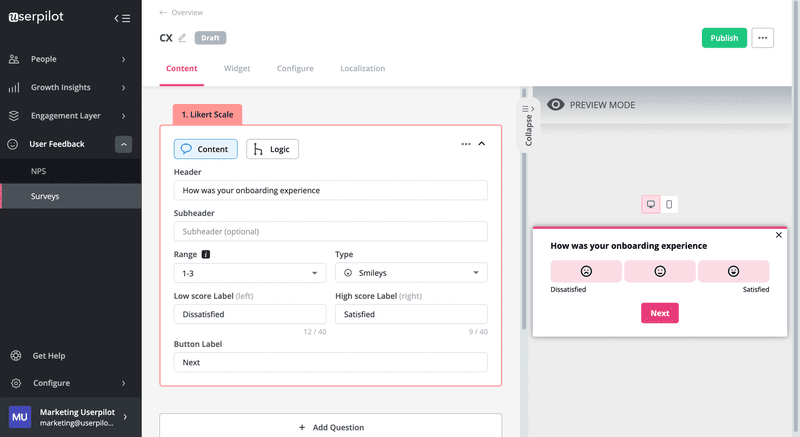
What could be better than listening to the users themselves about how they feel about your product? Sending in-app surveys and collecting user feedback can help you gain contextual insights into user behavior.
You can trigger relational or interaction-based surveys to collect feedback from your customers.
- Relational Surveys: These surveys collect feedback on customer relationships and loyalty to your product. They include questions like “How was your overall experience with us?”
- Interaction-based Surveys: These surveys are contextual and collect information regarding specific user actions. For instance, you can trigger an interaction-based survey to a customer who has just finished onboarding with the question, “How was your onboarding experience?”
Set goals to monitor how users progress
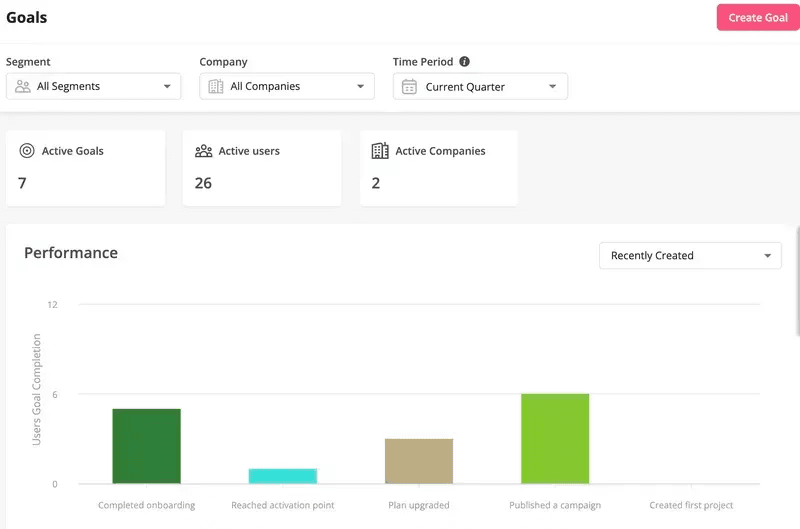
Goals give you insights into how users progress toward achieving a milestone in their user journey.
To track goal completion, the first thing in this process is to decide your goals. They should represent the actions you need your users to perform within your product. It can be onboarding completion, reaching the activation point, plan upgrade, etc.
Once the goals are set, you can see how many of your users have reached them, the goal completion trend among different segments, the most completed goals, etc. With a tool like Userpilot, you can also use goals to track the impact of your flow in encouraging users to take the desired action.
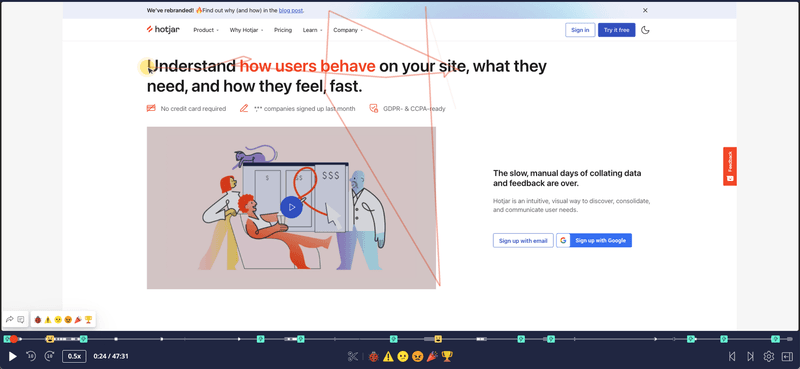
Use session recording to track user engagement
Session recording captures the essence of your user engagement by visualizing their activities within your product. It’s like sitting alongside your users to see how they navigate, where they click, and even their moments of frustration with rage clicks.
You can use a session recording tool with features that let you record navigation, clicks, hovers, rage clicks, etc. You’ll first need to decide what you want to capture to understand your user engagement. It includes the specific features, pages, or user segments you need to capture.
How to analyze user behavior?
Tracking user behavior is half the work of the user behavior analytics systems. We’ll now see how you should analyze the collected user behavior data.
Segment users to understand success drivers
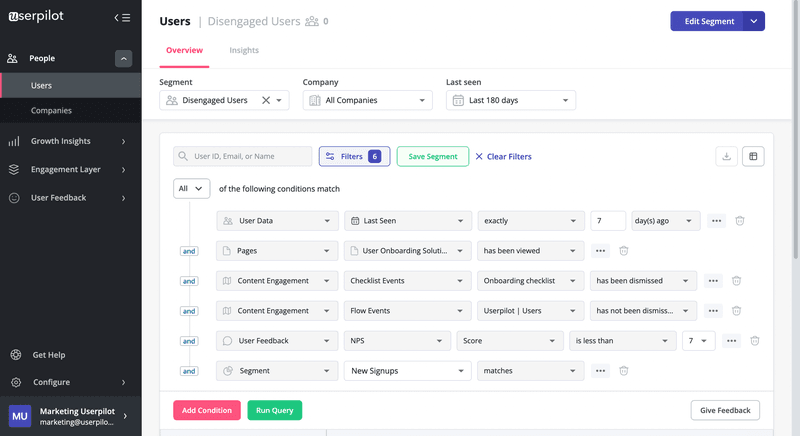
Segmenting your users based on their behavior, psychographics, etc., separates them by their similar needs. It helps you understand the differences in user behavior patterns between different segments. For instance, you can differentiate between inactive and engaged users by comparing the user behavior.
By studying the engagement drivers within the engaged segment, you can identify patterns in how they interact with the platform. Then you can use such information to guide disengaged users along a similar path by implementing in-app guidance such as tooltips, walkthroughs, modals, and more.
Conduct path analysis to study user journey
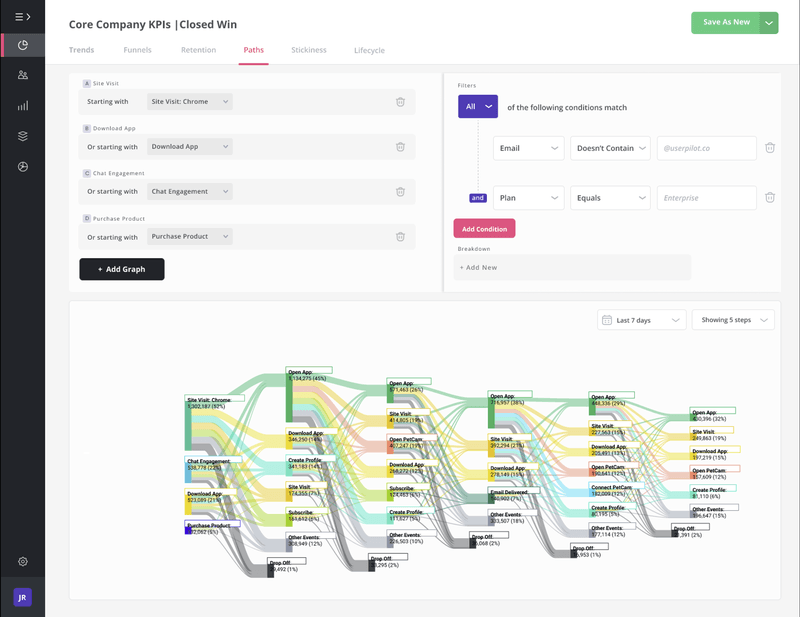
You can perform path analysis by defining the starting and ending events of the user journey. For example, the starting event might be a user opting for a free trial, and the ending event could be a successful purchase.
You can analyze all the paths users take to identify the most common path your successful users take, which is also known as the happy path. As it represents the smoothest and most efficient user journey, you can take it as an example to optimize your overall user experience and help other users reach the set goals.
Use funnels to spot friction and drop-offs
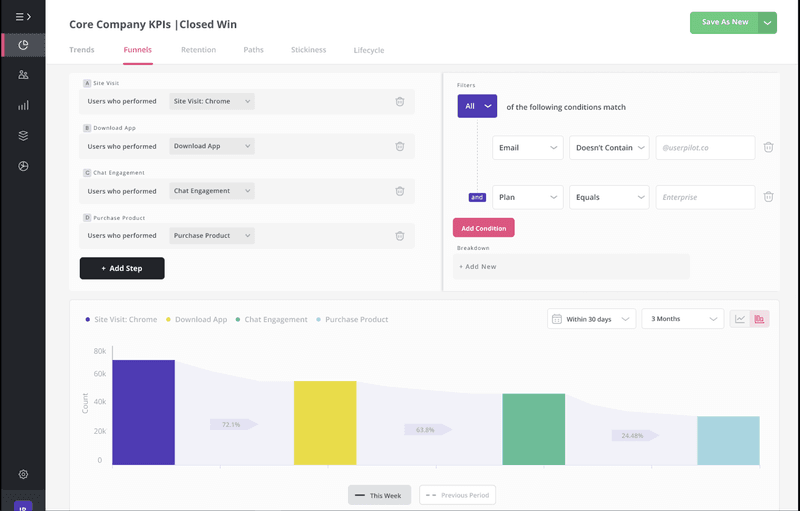
You should define the key steps users take within your product to understand their progression throughout their journey. For instance, if you want to convert visitors into buyers, the conversion funnel’s key steps can include site visits, app downloads, chat engagements, and product purchases.
After setting the key steps, you need to analyze the funnel to track the percentage of users progressing from one step to another. You should pay close attention to the spot where the highest percentage of users drop off. These drop-off points indicate possible friction points, which you should eliminate by taking prompt action.
Analyze user behavior patterns to identify trends
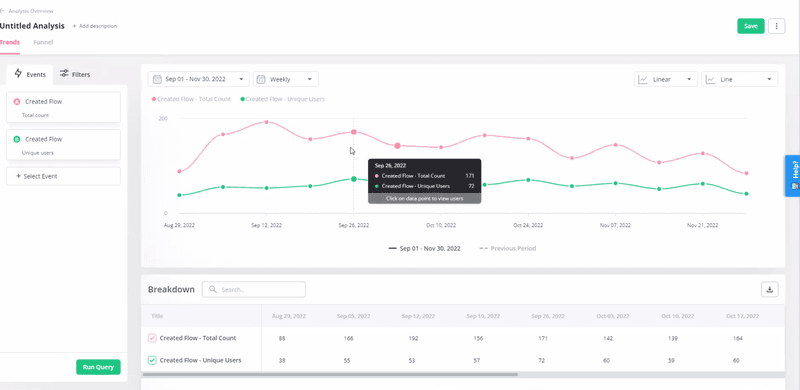
Trends can serve a broad spectrum of purposes, including understanding user patterns, tracking changes, and observing developments over time.
For example, you can perform a trend analysis to check the product usage correlation between the total number of events and unique users over time. It lets you identify if there’s a growth in feature usage due to more users or users becoming more active.
Interpret feedback data for improvement opportunities
You should monitor the score change in surveys like Customer Satisfaction (CSAT), Customer Effort Score (CES), or Net Promoter Score (NPS).
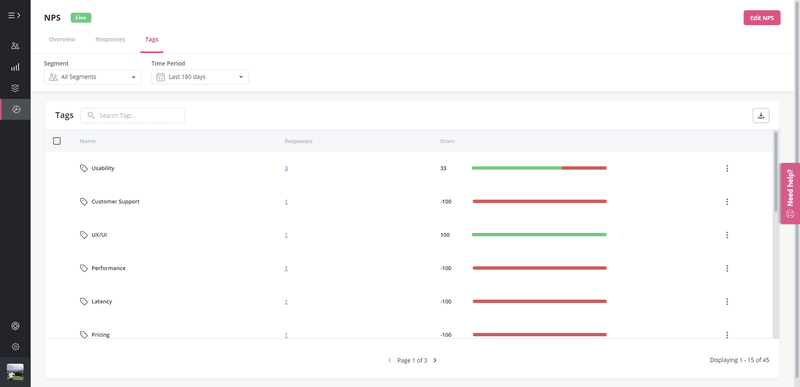
You can use the analytics dashboard to see the overall condition of your feedback score. It also lets you compare the score with earlier ones to track trends – whether it improves, deteriorates, or remains stable over time.
For example, you can use the NPS dashboard to see changes in Net Promoter Score (NPS) while uncovering reasons behind the score by tagging the responses. With scores assigned to different aspects, like usability, customer support, etc., you’ll know which aspects cause the most common issues and require prompt improvement.
Important metrics for behavioral analytics
Tracking behavioral analytics metrics is critical to understanding customers on a deeper level. You should track:
- Product usage refers to how often and long users use your product. It serves as a foundation for understanding user behavior patterns and preferences.
- Active users are users who have engaged with your product within a specific timeframe. Tracking active users allows you to assess the vitality of your user base and determine if your efforts are retaining and attracting users.
- Stickiness reveals how effectively your product retains users over time by measuring the likelihood of users returning after their initial interaction. It offers you actionable user behavior analytics by telling you where your engagement strategy works and where it doesn’t.
- Feature adoption rate is the percentage of users who have used a particular feature. It helps you gauge the success of new feature rollouts and identify opportunities to engage users with underused features.
- Customer retention rate is the percentage of users who continue to use your product over time. It is a critical indicator of whether your product consistently delivers value and meets user needs to satisfy users.
- Churn rate represents the percentage of users who discontinue using your product over time. Analyzing churn patterns helps you pinpoint pain points in the user journey and implement strategies to reduce attrition.
Best user behavior analytics tools for actionable insights
Selecting the right analytics tool streamlines the processes in your user behavior analytics system.
Some of the best user behavior analytics tools are:
Userpilot – Best for monitoring and analyzing user interactions
Userpilot is a product analytics tool that helps you track and analyze user behavior analytics data without any coding required.
Let’s look at its tracking features:
- Tracking no-code and server-side events to get insights into user interaction from the front end or behind the scenes.
- Goal-based tracking lets you associate goals with an event for tracking user milestone
- Sending in-app surveys, like NPS, CSAT, etc., surveys, to collect customer feedback data.
This tool also has advanced analytics capabilities to help you analyze the collected data for actionable insights into user behavior. Here are some of its analytics features:
- Survey analytics with a dashboard for statistics on the survey, with completion rate, trends, scores, etc. The dashboard also lets you do the qualitative analysis by tagging NPS responses to find the common issues easily.
- Data analytics with funnel analysis, path analysis, trend analysis, product usage analytics, etc.
Hotjar – Best for tracking user experience activity
It’s a user behavior analytics software that enables you to track user experience activity effortlessly.
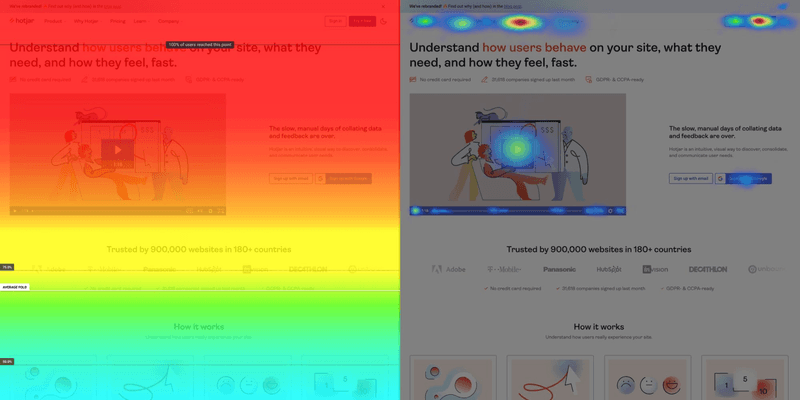
Hotjar offers heat map analysis to see where users precisely click, hover, or stay longer. Coupling it with the session recording feature lets you step into the user experience from the users’ perspective and understand how they navigate your product.
Amplitude – Best for analyzing user behavior across customer journey
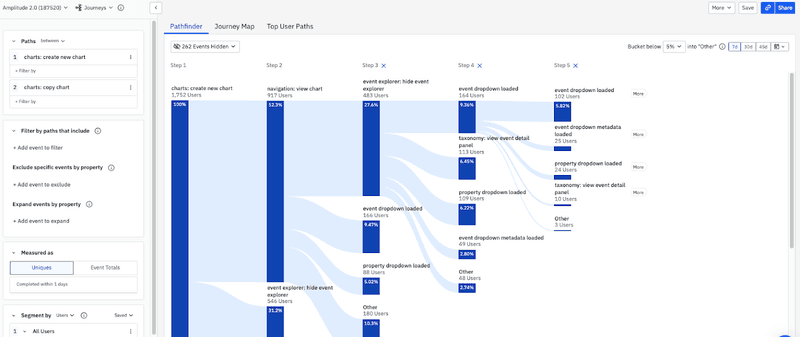
Amplitude is a user behavior analytics tool that enables you to analyze user behavior based on their whole customer journey.
Amplitude’s event tracking feature allows you to monitor and record every user action within your product. You can then use its user journey visualization to gain visibility into all your user journeys and examine the paths.
Google Analytics – Best for tracking user activity for conversion funnel optimization
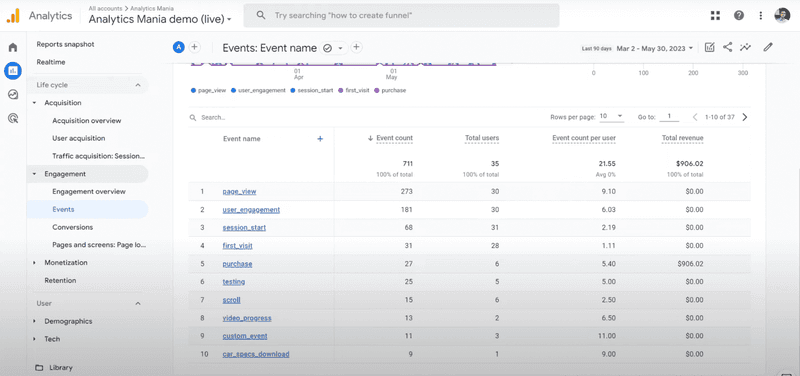
It is a robust web analytics service from Google that helps you track user activity to optimize your conversion funnel.
Google Analytics automatically tracks specific events and actions for marketing and conversion purposes and streamlines your monitoring process. It also offers a default setup that gives you a comprehensive view of the user’s purchase journey. You can follow each step of the user’s path to understand the conversion funnel and know where to optimize it.
Conclusion
User behaviour analytics is like a compass that can guide you toward crafting better user experiences and driving sustainable growth. It can provide actionable insights to empower you with data-driven decisions to satisfy your users.
Want to get started with user behaviour analytics? Get a Userpilot Demo and see how you can improve your overall user behavior analytics system.


