
Try Userpilot Now
See Why 1,000+ Teams Choose Userpilot

What is Mixpanel?
Mixpanel is a powerful analytics platform that helps companies understand how users interact with their web and mobile applications.
More than simply tracking website traffic, Mixpanel tracks user behavior and engagement to identify trends and optimize the user experience.
What are Mixpanel Boards?
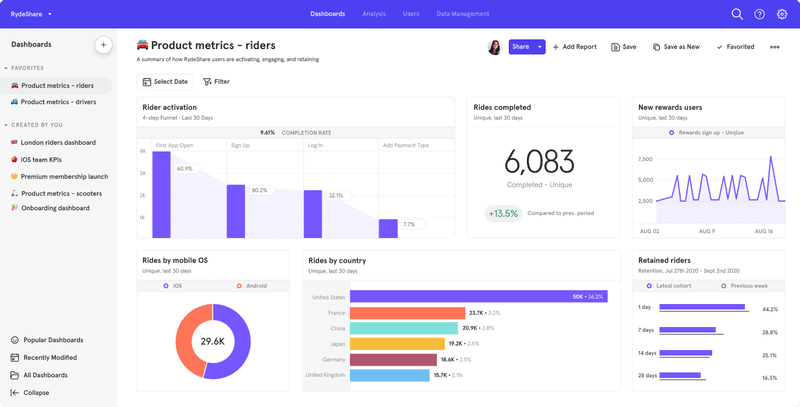
Mixpanel Boards are flexible and collaborative workspaces that hold a collection of reports, texts, videos, and images that enable you to view key metrics at a glance and make data-driven decisions.
Mixpanel Boards can be made available to the whole team to enable members to collaborate and discuss findings. You can also add text to provide context or integrate visual aids for a more comprehensive report.
What can Mixpanel Boards be used for?
Mixpanel Boards are versatile tools that help you keep all relevant stakeholders on top of your KPIs. Some of its use cases include:
Track key product usage metrics at a glance
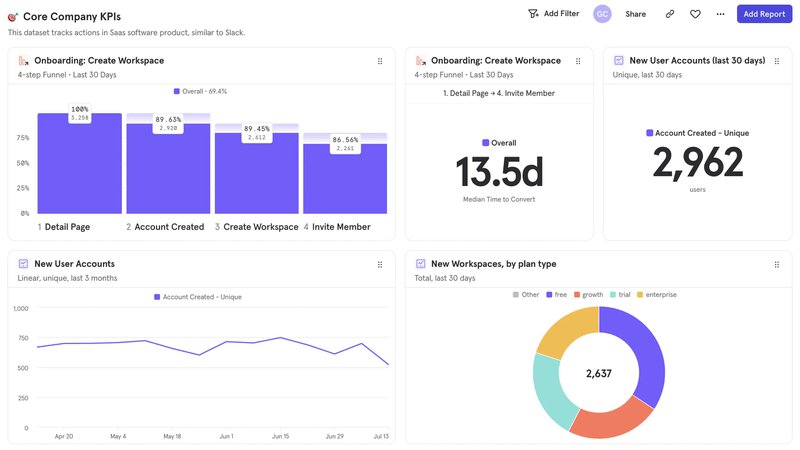
Whether you’re creating a board from scratch or using an existing board template, you’ll be able to track various key product metrics at a glance.
This may include engagement (clicks, shares, etc.), retention, growth (daily active users, weekly active users, etc.), adoption, and other product impact metrics.
After you create a new board, you can resize, group, and rearrange the charts and visualizations to highlight key metrics and draw attention to important data.
Measure the success of a new feature
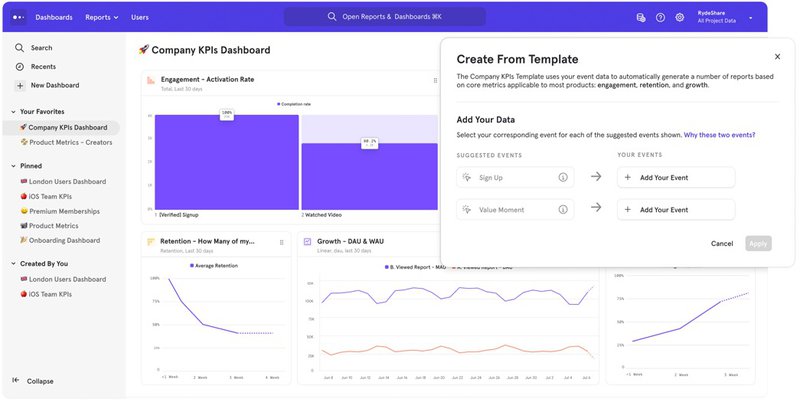
Thanks to the extensive customization options of Mixpanel Boards, you can create detailed reports for your newly launched feature.
For example, you can create sections with headers (think “feature adoption,” “feature retention,” etc.) and place visualizations and reports in the appropriate sections.
You can also use text cards to explain your results, provide launch hypotheses, and more. You can even include screenshots or a video walkthrough of the feature to provide better context.
Quickly share the reports with internal teams and shareholders
Whether or not team members have a Mixpanel account, you can create a public link that grants them access to the board.
You can also embed these boards into your Notion, Coda, etc. docs. This makes it easy to collaborate seamlessly and share your findings with relevant shareholders more easily.
Pros of Mixpanel Boards
Some of the pros of using Mixpanel Boards include:
- Customization: You can customize every part of a Mixpanel Board. This means you can add a project logo, increase or decrease chart sizes, add text and media files, etc.
- Improved communication: The collaboration features foster better communication between product managers, designers, developers, and other stakeholders.
- Faster decision-making: By fostering improved communication and collaboration, Boards help you identify opportunities quicker and iterate faster.
Cons of Mixpanel Boards
Although Mixpanel Boards offer a compelling set of features for collaborative analysis, it also has a few drawbacks, including:
- Learning curve: With more features comes more complexity. As a result, boards still require some learning curve despite being designed to be more user-friendly than traditional dashboards.
- Complexity of simple needs: If you only require a fairly basic data visualization, a Mixpanel Board may be more elaborate than needed.
How to create Mixpanel Boards step-by-step
To create a new board, navigate to the Boards page. On the directory by the left, you’ll find your already existing boards, including your “Favorites” and “Pinned” boards.
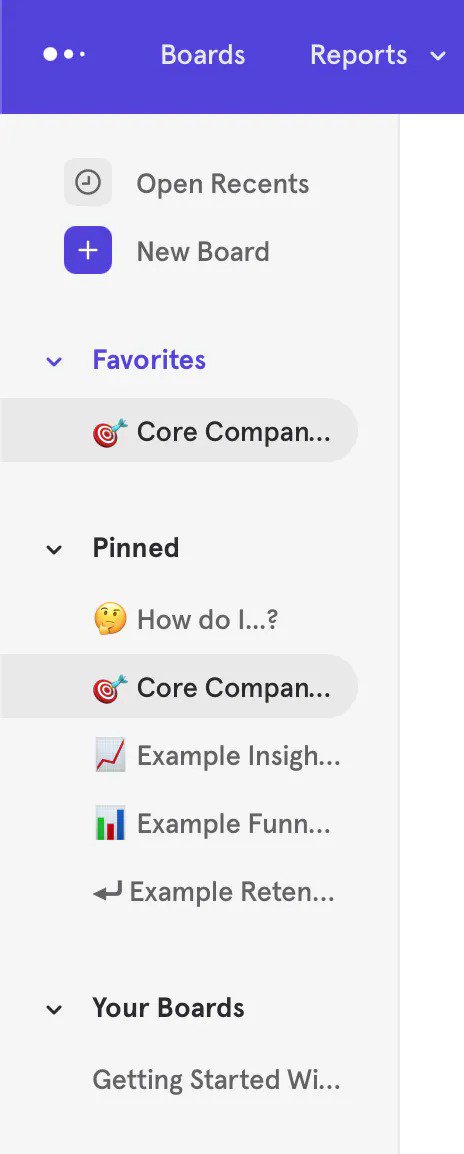
To create a new board, click “+ New Board” at the top of the directory. This will create an empty new board with the name “Untitled”. You can change the name by clicking on it.
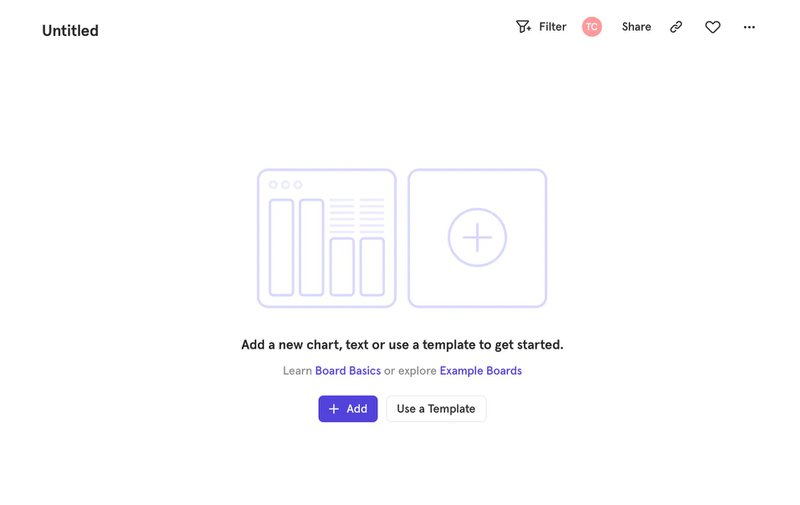
Now, you can select an existing board template by clicking “Use a Template,” or click the “+Add” button to add content to the board. When you click the “+Add” button, you’ll see several options.
You can create a report from scratch here by selecting the type of report you want to add and customizing it to your needs.
If you wish to add an existing report, clicking the “Existing Report” option will open a popup from which you can select one. You can also add an existing report directly from the report, by clicking the dropdown at the top left of the report and selecting “Add to another Board”.
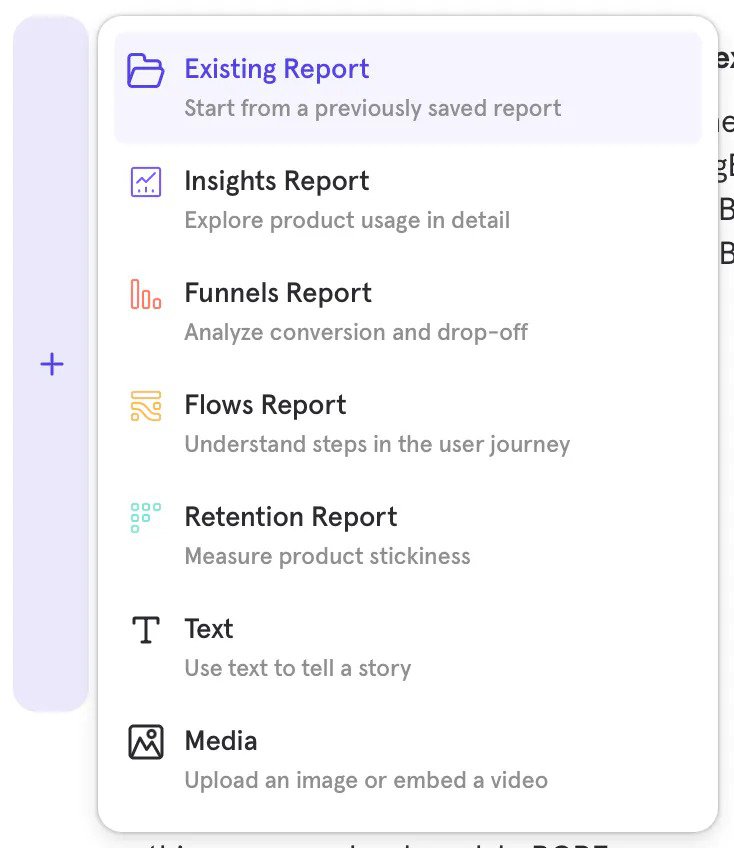
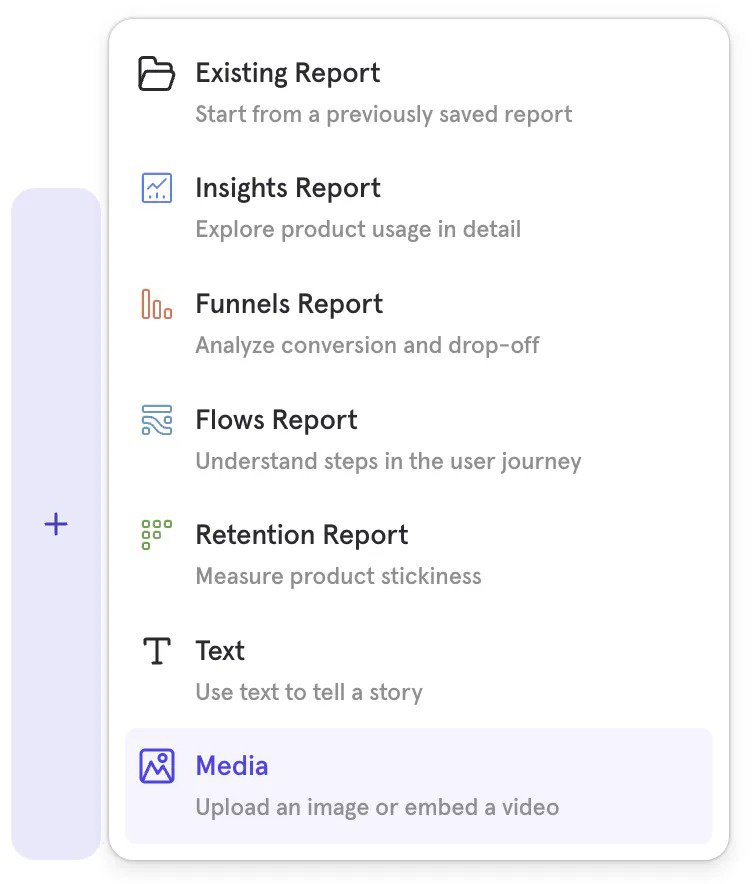
To add text, select the “Text” option to include a text card on your board. The cards support rich text formatting, including font size (title, subtitle, & text), list type, quote block, hyperlinks, bold, etc.
You can also add media files by selecting the “Media” option. These media cards support embedded videos (YouTube, Vimeo, & Loom) and local images (PNG, JPG, & GIF). Like Report cards, you can resize each media card horizontally or vertically.
Mixpanel boards pricing
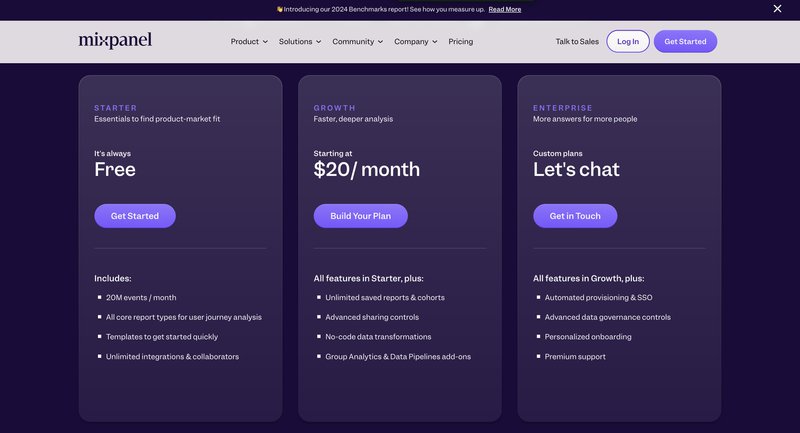
You can create and access Mixpanel Boards with a standard Mixpanel subscription plan. This means you can select one of three options:
- Free: This plan supports essential analytics features for up to 20 million monthly events.
- Growth: Starts at $28 per month for up to 10 thousand events. It supports advanced analytics features, API access, etc.
- Enterprise: Custom pricing for up to 1 trillion monthly events. In addition to the Growth features, it also supports data warehouse ingestion, automated provisioning, data governance, etc.
Userpilot boards: A Better Alternative to Mixpanel boards
Mixpanel boards are great, but Userpilot is even better. A versatile code-free product analytics and growth tool, Userpilot dashboards offer even more customization and personalization options.
Some key features include:
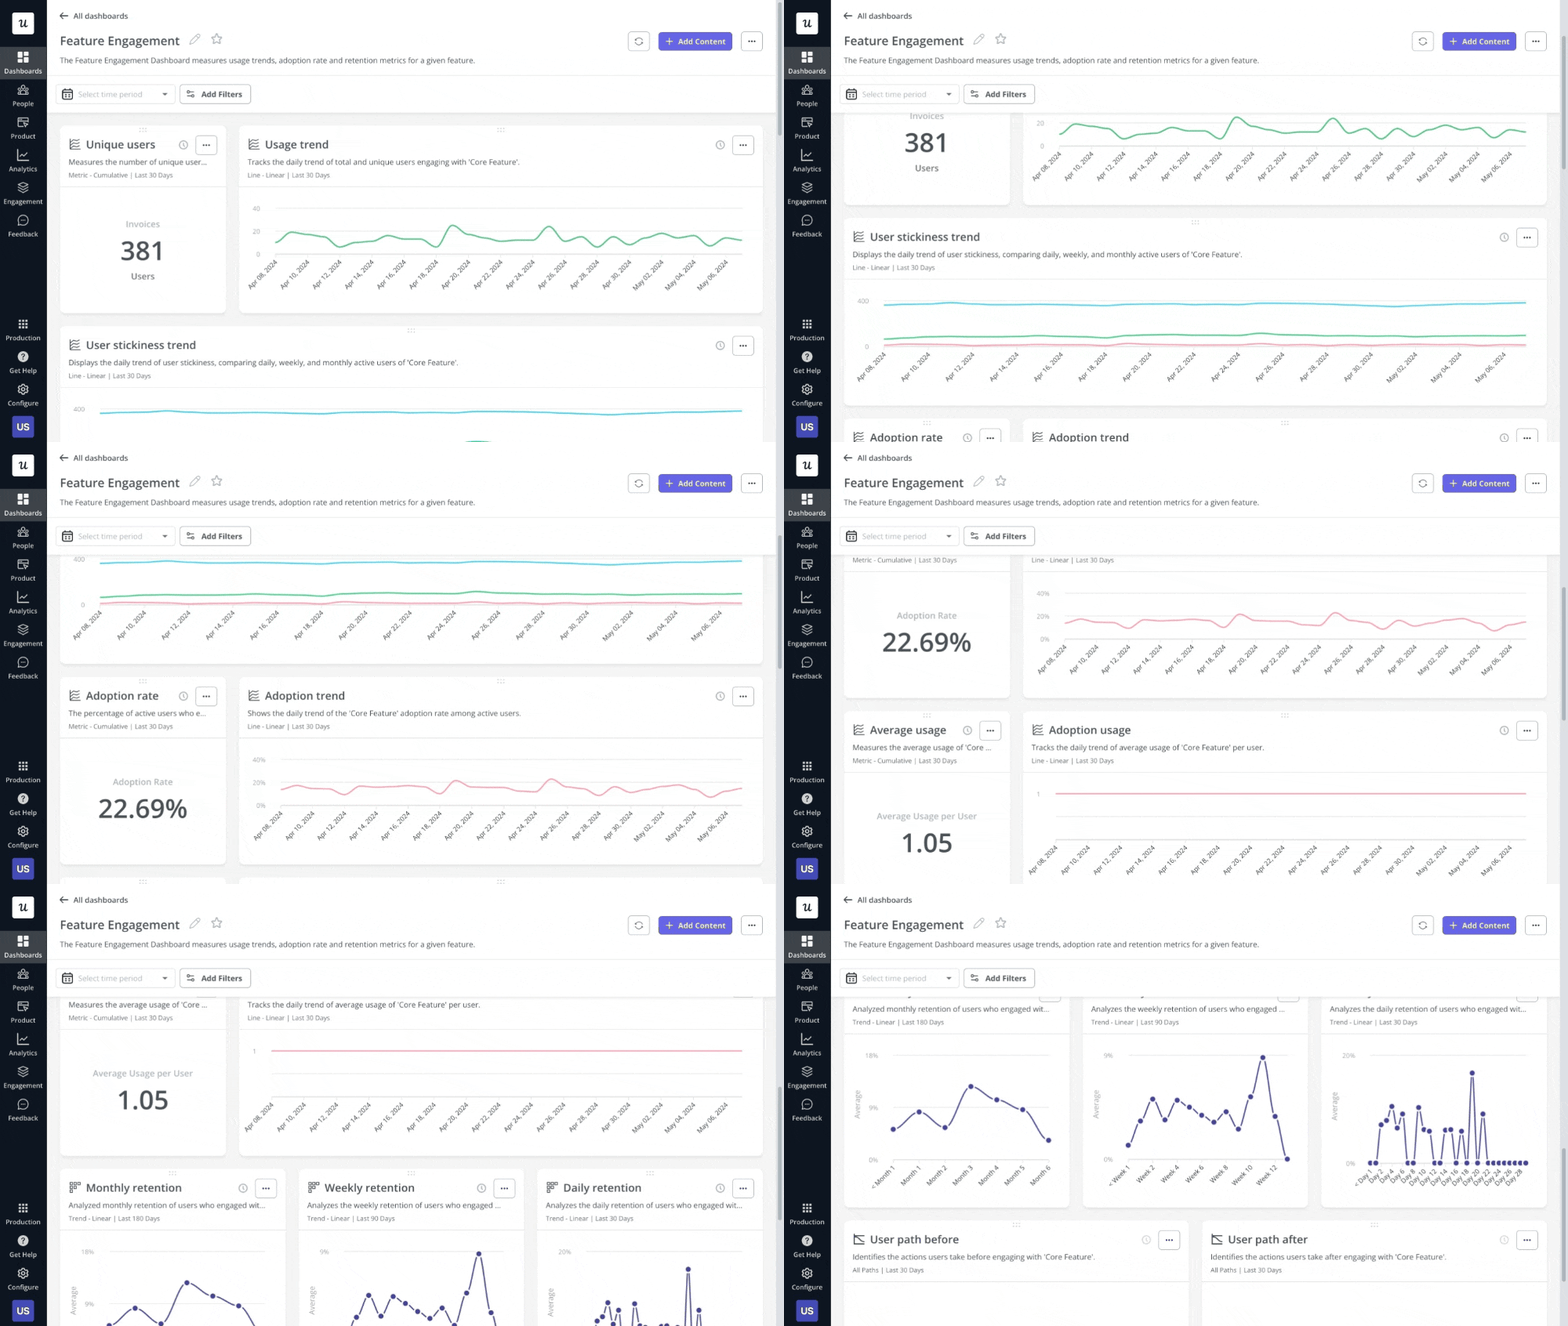
- Pre-designed dashboards: Userpilot comes with a collection of analytics dashboards tracking related key product metrics. This includes pre-designed dashboards tracking feature engagement, user activation, product usage, etc. You don’t have to set anything up, as these dashboards are automatically available.
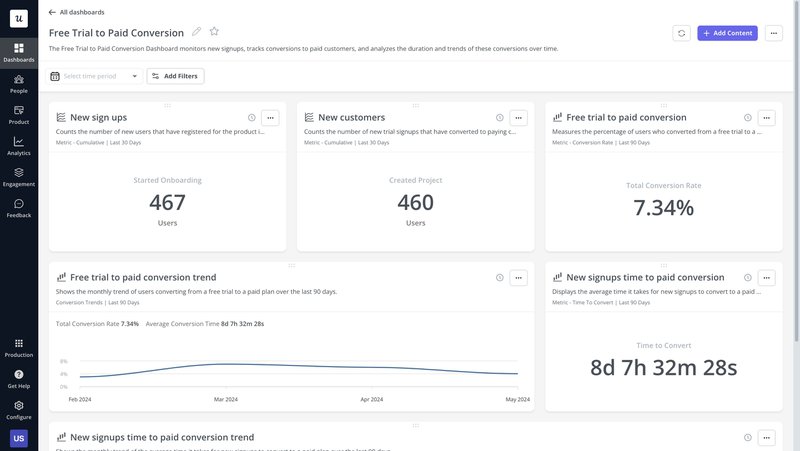
- Custom dashboards: Create your board from scratch with all your desired metrics. Combined with Userpilot’s event tracking feature, these dashboards can be very powerful tools at your fingertips. For example, you can define a conversion event and include it in a conversion tracking dashboard.
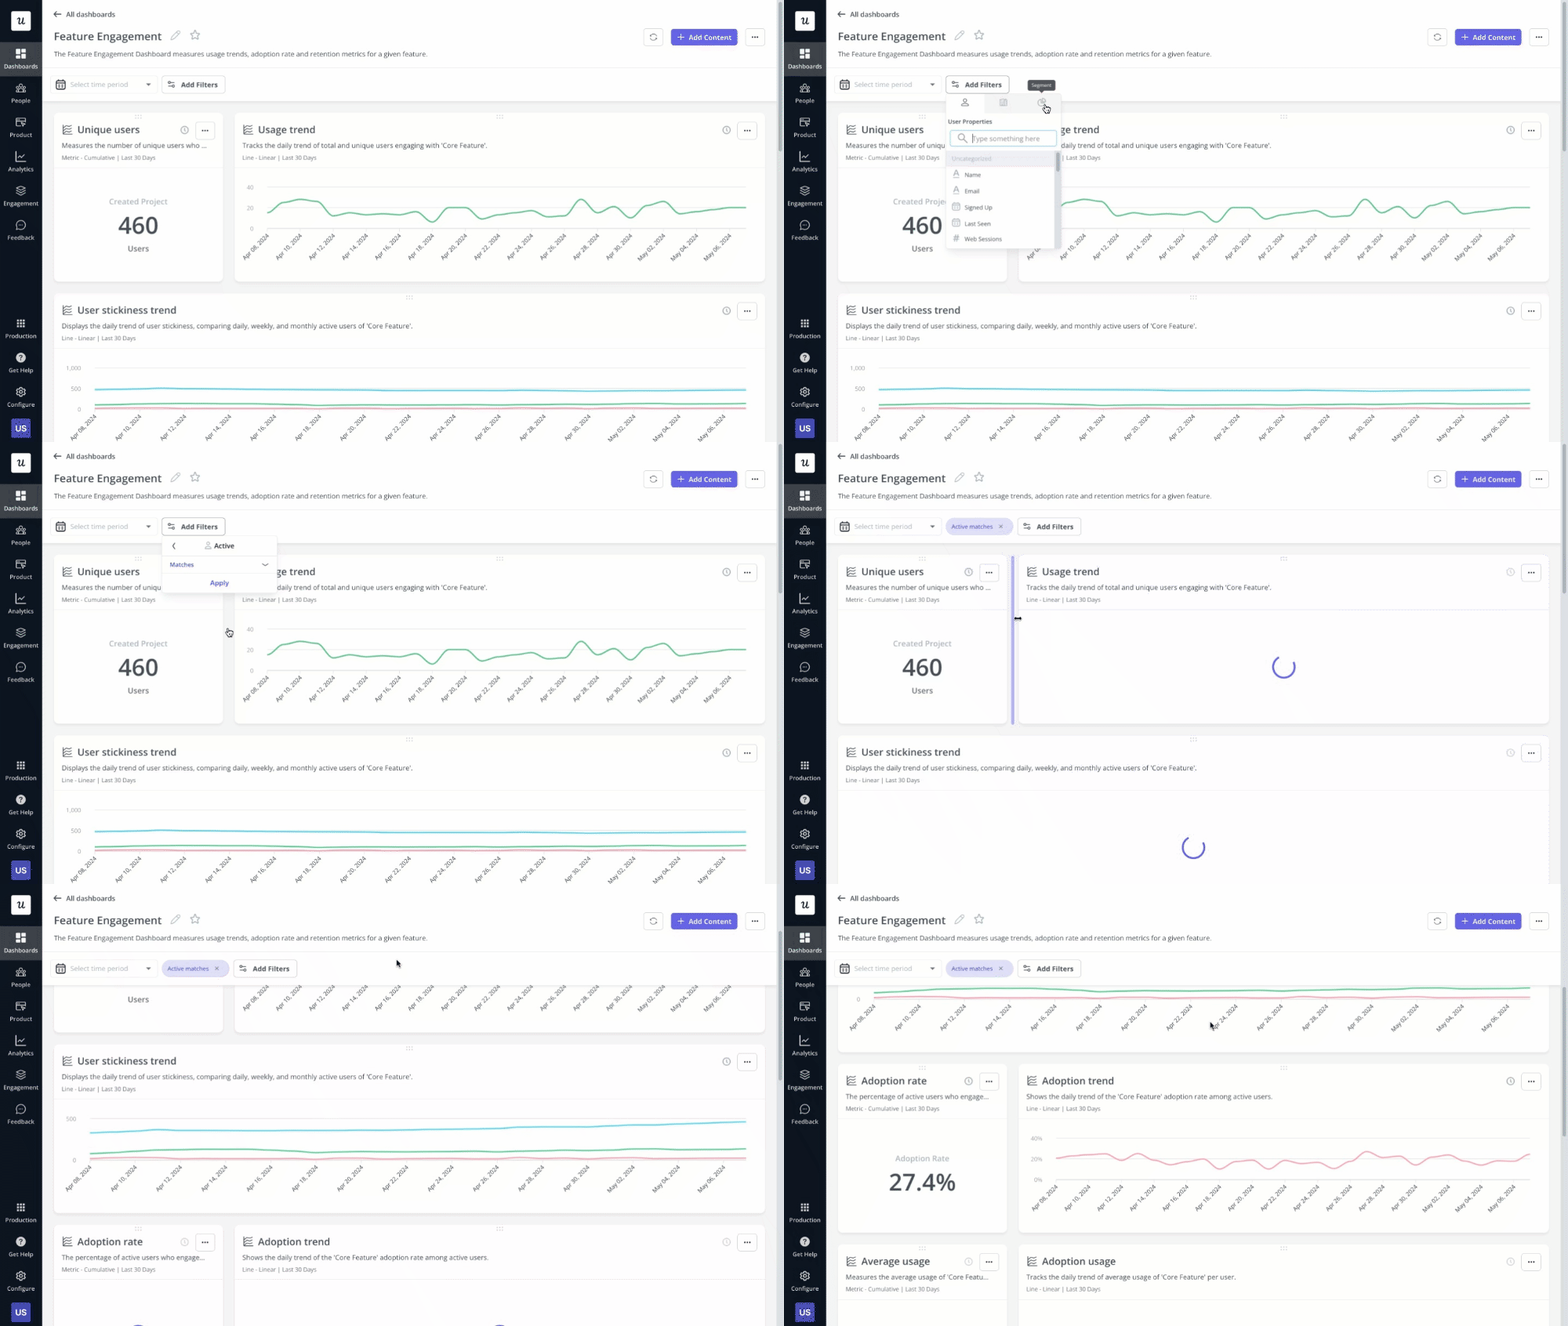
- Dashboard Segmentation: Want to get more granular insights from your data? Take advantage of Userpilot’s segmentation feature to filter your data by user groups and identify trends within each group.
Pros of Userpilot boards
Userpilot boards offer several advantages, making them a valuable tool for understanding user behavior and optimizing your product. These include:
- Real-time analytics: Userpilot’s dashboards are updated in real-time, with new events automatically updating dashboard data.
- Extensive filtration: Filter your dashboards by user segments, company size, or in-app behavior to monitor product metrics for different groups. You can also filter by a specific date or period.
- Actionable insights: Userpilot goes beyond just displaying data to help you act on the insights derived through its engagement and adoption layers.
Cons of Userpilot boards
Before choosing Userpilot, there are two main drawbacks to consider:
- Pricing: Userpilot is a fairly pricey and robust digital adoption tool. Startups looking for a sub-$100 engagement tracking tool may best consider cheaper alternative platforms.
- Primarily customer-focused: While the technology could work for employee onboarding, Userpilot lacks HR-specific features like compliance tracking and internal training workflows that dedicated employee onboarding elements provide.
How to create a dashboard with Userpilot
The first step to creating any dashboard is deciding what metrics to track. Once you feel ready, log into Userpilot and select “Dashboards” on the sidebar menu.
At the bottom of the expanded menu, select “+ Create New” to open a blank dashboard space. At this point, you’ll have two choices: create from scratch or work with a template. Let’s examine each of them:
Create a dashboard with a template
Select “Start From A Template” to create a custom dashboard with an existing template.
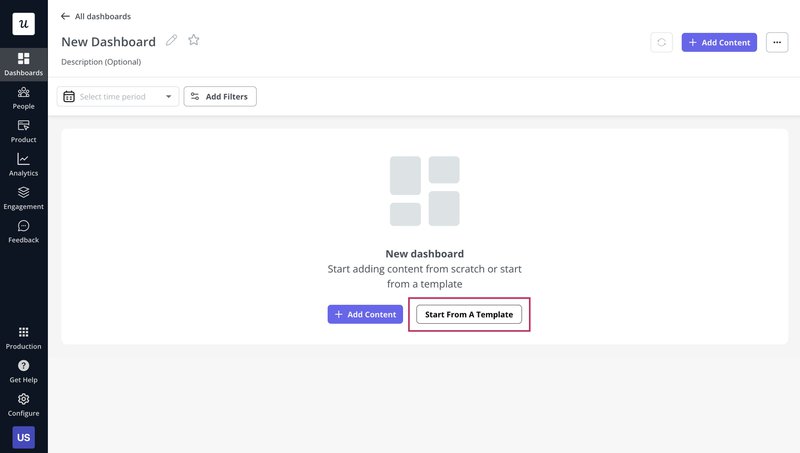
You’ll now be presented with a set of template options. Under the one that most closely relates to your target dashboard, click the “Use template” button.
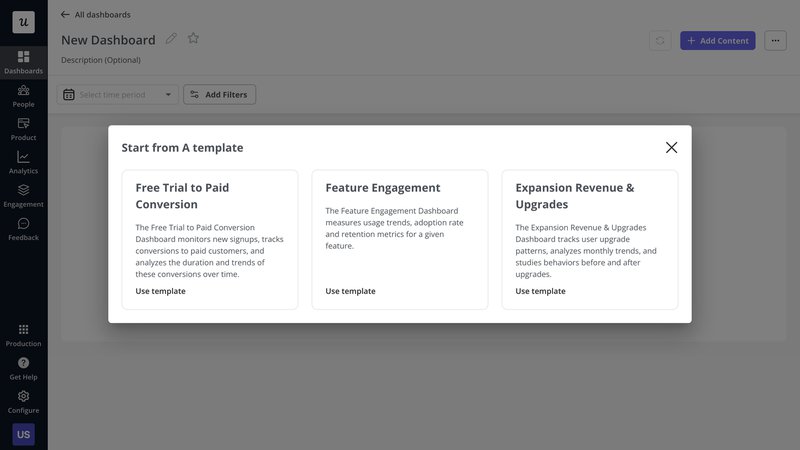
To complete the process, you’ll now be requested to select the events you want to track.
If you’ve already defined conversion events for a free to paid conversion dashboard, for example, click the “+ Select Event” dropdown and select it from the list.
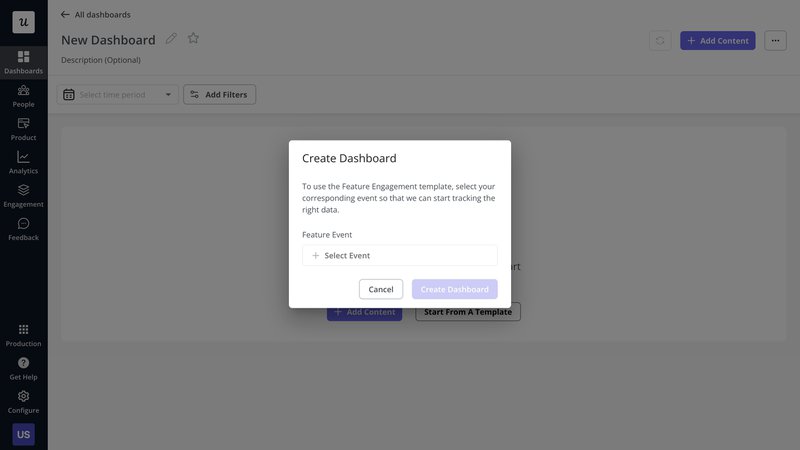
Once you’ve included your custom events, Userpilot will do the rest and generate a customizable dashboard.
Create a dashboard from scratch
If you wish to create a board from scratch, click the “+ Add Content” button on the dashboard creation page instead. You can add up to 30 metrics and analytics reports to your dashboard.
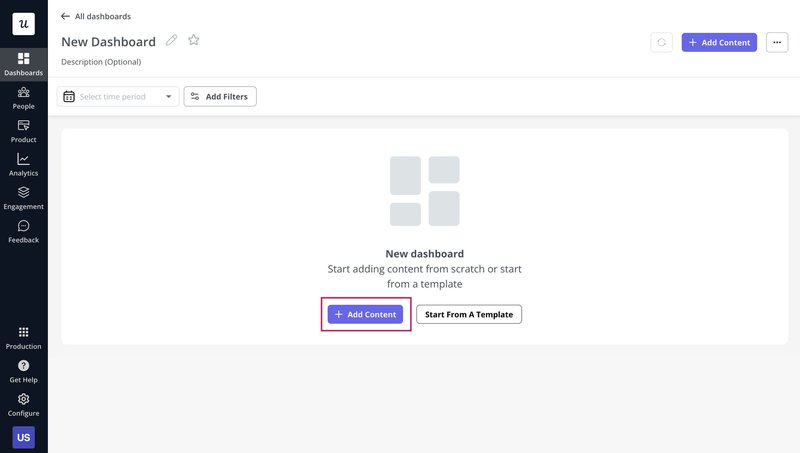
You’ll now be presented with a list of 6 content types.
Select “Trends” to include trend graphs, “Funnel” to include funnel analysis data and charts, “Paths” for detailed user path analysis, “Retention” for cohort retention visualizations, or “Text block” to include a text field and provide more context for your data.
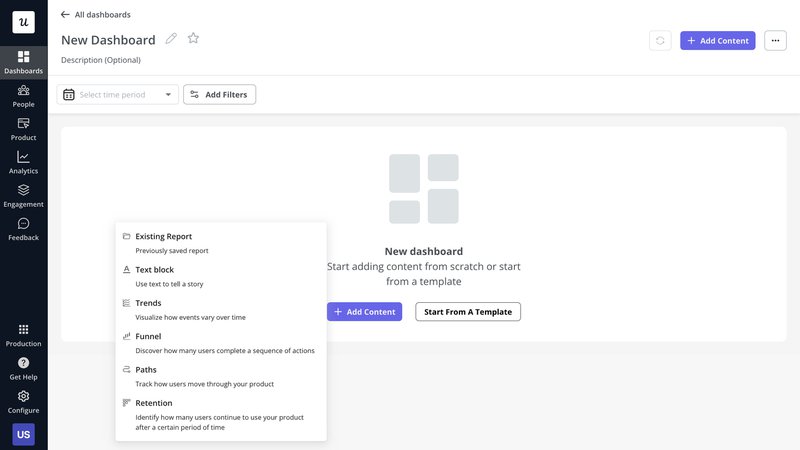
If you’ve already created a custom analytics report that fits into the context of the dashboard, select “Existing report” and pick out the report from the list.
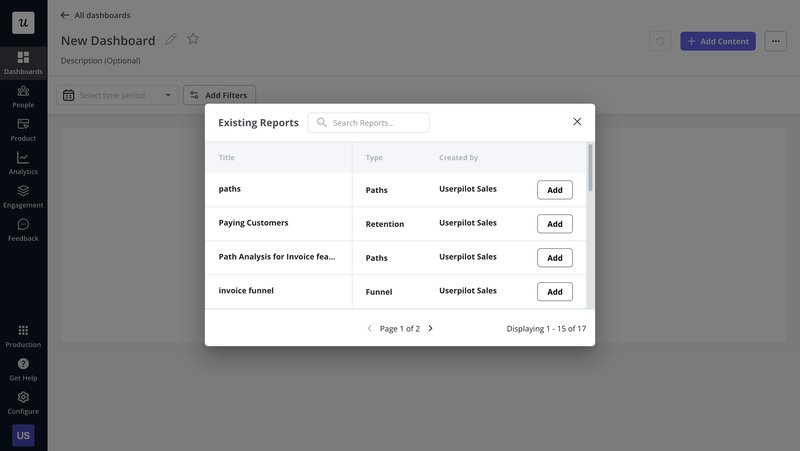
Once you’re done adding elements to your dashboard, you can rearrange them to fit your needs. You can also control the width and height of each block, or even filter the data for a specific data block.
Userpilot boards pricing
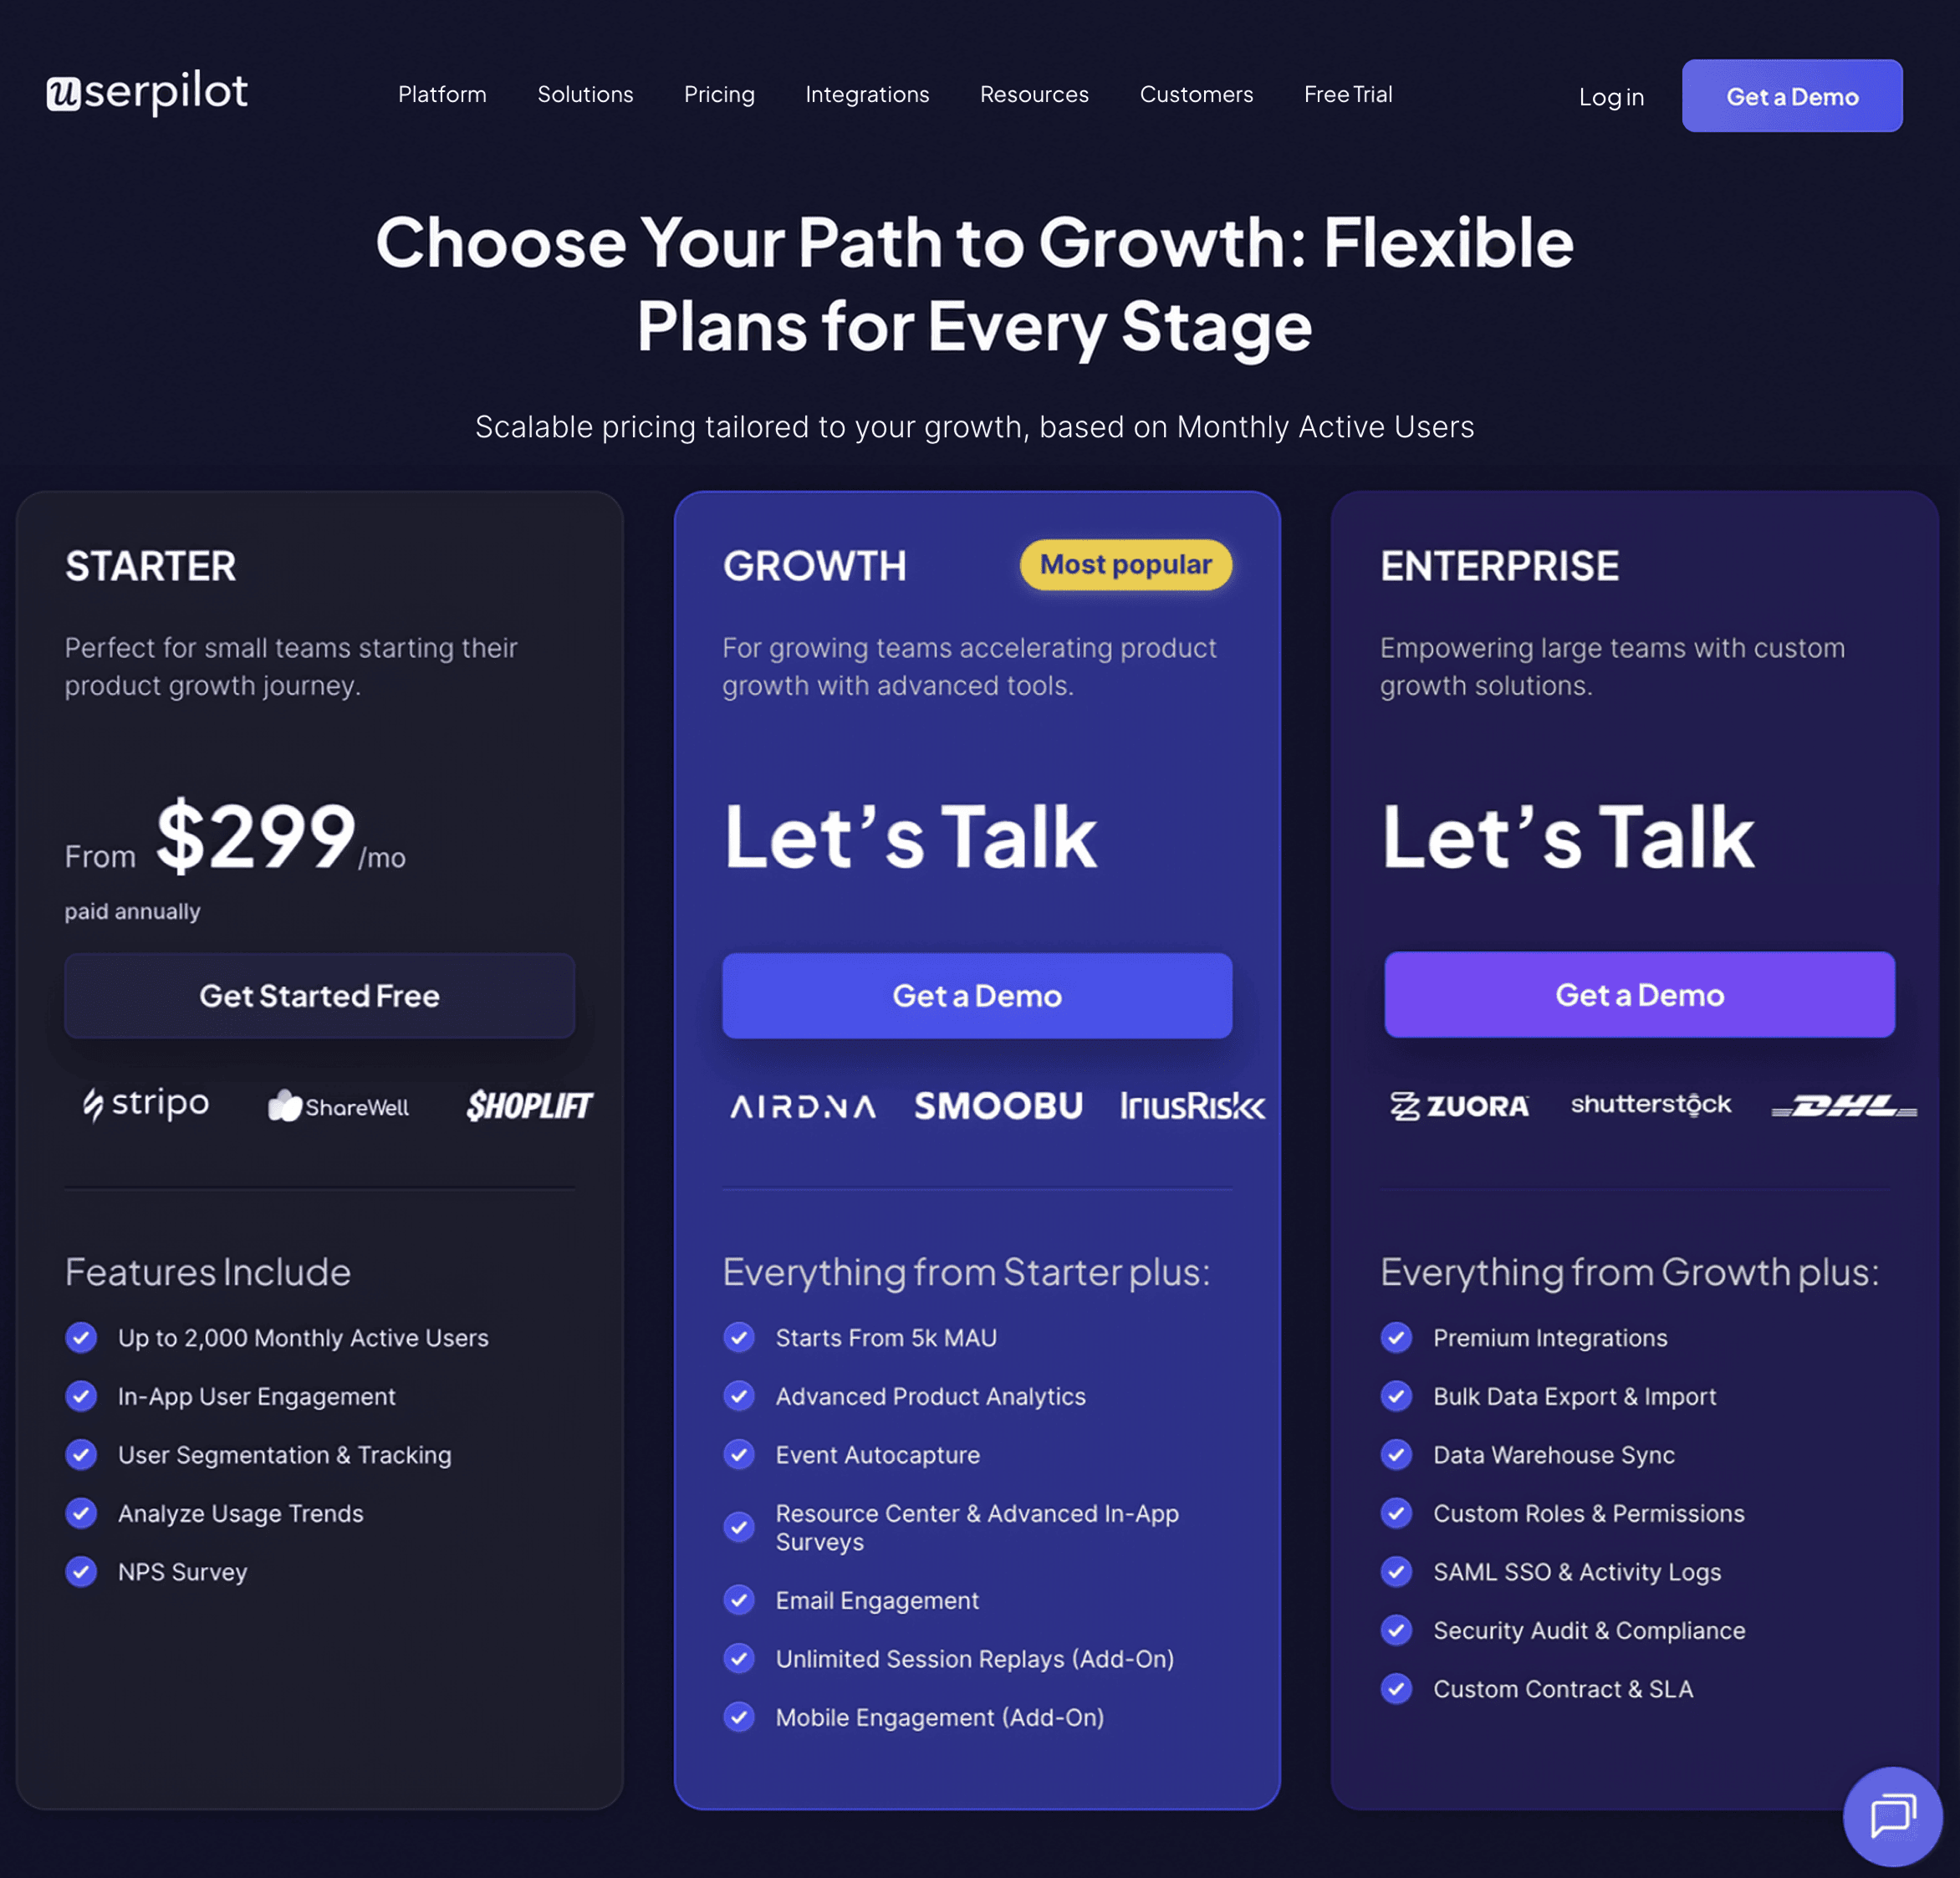
Userpilot offers a three-tiered pricing plan, starting at $299/month for the Starter category and billed annually.
Larger organizations can reach out for a custom price that fits their needs.
Here’s a detailed breakdown of its pricing plans:
- Starter: The entry-level Starter plan is priced at $299/month, billed annually. It includes up to 2,000 Monthly Active Users (MAUs) and features like segmentation, product analytics, reporting, in-app user engagement, NPS surveys, and UI customization. This plan is only available on an annual subscription basis.
- Growth: Custom-priced, the Growth plan adds support for custom MAUs, advanced product analytics, retroactive event auto-capture, in-app surveys, session replay (add-on), mobile engagement (add-on), resource centers, AI-powered content localization, EU hosting options, and a dedicated Customer Success Manager.
- Enterprise: Custom-priced and designed for large organizations, the Enterprise plan includes everything in Starter and Growth, plus premium integrations, bulk data export/import, data warehouse sync, custom roles and permissions, SAML SSO, activity logs, priority support, custom contracts, SLAs, and security compliance (SOC 2 Type 2/GDPR).
Conclusion
Mixpanel put in a lot of effort to make its dashboards more interesting, interactive, and collaborative. The new dashboards are easier to use, more flexible, and better than ever.
If you’d like a better alternative, however, book a Userpilot demo to learn how this robust product growth and analytics tool helps you to track and visualize data.


![What are Release Notes? Definition, Best Practices & Examples [+ Release Note Template] cover](https://blog-static.userpilot.com/blog/wp-content/uploads/2026/02/what-are-release-notes-definition-best-practices-examples-release-note-template_1b727da8d60969c39acdb09f617eb616_2000-1024x670.png)


