Product Usage Metrics in 2026: Your Dashboard Is Probably Missing the Most Important Ones


The standard product metrics stack — DAU, MAU, activation, stickiness — was designed for a world where only humans use your product. AI agents executing tasks via MCP and API don’t generate session events. They won’t show up in your DAU count, even if they’re your most active “users.” I keep seeing teams discover this only after their dashboards have been misreading their healthiest accounts for months.
The other problem is less novel but probably more costly. Most product teams are measuring outputs like retention and revenue as goals in themselves, without tracking the input behaviors that actually drive them. When I dig into why performance stalls, bad metric definitions are almost always part of the answer.
This guide covers the eight core usage metrics every product team should track, four new ones I’d add specifically for agent behavior, and the five definition mistakes I see most often.

What is product usage, and what’s changed in 2026?
Product usage is the data that represents how and when your customers are using your product. More precisely, it covers every event your instrumentation captures: clicks, feature activations, session starts, form completions, API calls, and anything else you’ve wired up. The richer that event layer, the more useful your product usage data becomes for onboarding, retention, and roadmap decisions.
Nothing about that definition has changed, but the scope has expanded significantly in 2026. A growing share of activity in B2B SaaS products now comes from AI agents, automated workflows that interact with your product via API or MCP connections without any human clicking through the UI. If your tracking doesn’t separate agent-originated events from human-originated events, your analytics are already blending two incompatible behavioral profiles into a single misleading signal, and the gap between what the dashboard shows and what’s actually happening will only widen as agent usage grows.
This matters because the whole purpose of tracking product usage metrics is to understand which behaviors correlate with value, retention, and expansion, and vanity metrics like total logins or raw page views tell you nothing about whether users are actually accomplishing anything meaningful.
How do you measure product usage? Metrics to track in your product
Before going metric by metric, one rule worth stating: match your metrics to your product’s usage frequency. A daily collaboration tool and a monthly invoicing tool should not be tracking the same frequency signals. A freelancer who opens invoicing software for five minutes a month to send three invoices is a successful user, not a disengaged one, and total session time would misread them completely.
The other thing to avoid is vanity metrics. The number of logins and raw page views looks satisfying on a dashboard, but tells you nothing about whether users are completing meaningful outcomes. Track behaviors that connect to value instead, and the eight metrics below are a solid place to start.
Product onboarding engagement rate
The product onboarding engagement rate measures how many users actively engage with your in-app and mobile onboarding at each stage of the user journey. Most SaaS products have three onboarding stages, each with a distinct purpose:
- Primary onboarding: Getting users to the activation point by engaging with core product features.
- Secondary onboarding: Introducing users to secondary features for repeated value delivery.
- Tertiary onboarding: Creating advocates and driving account expansion.
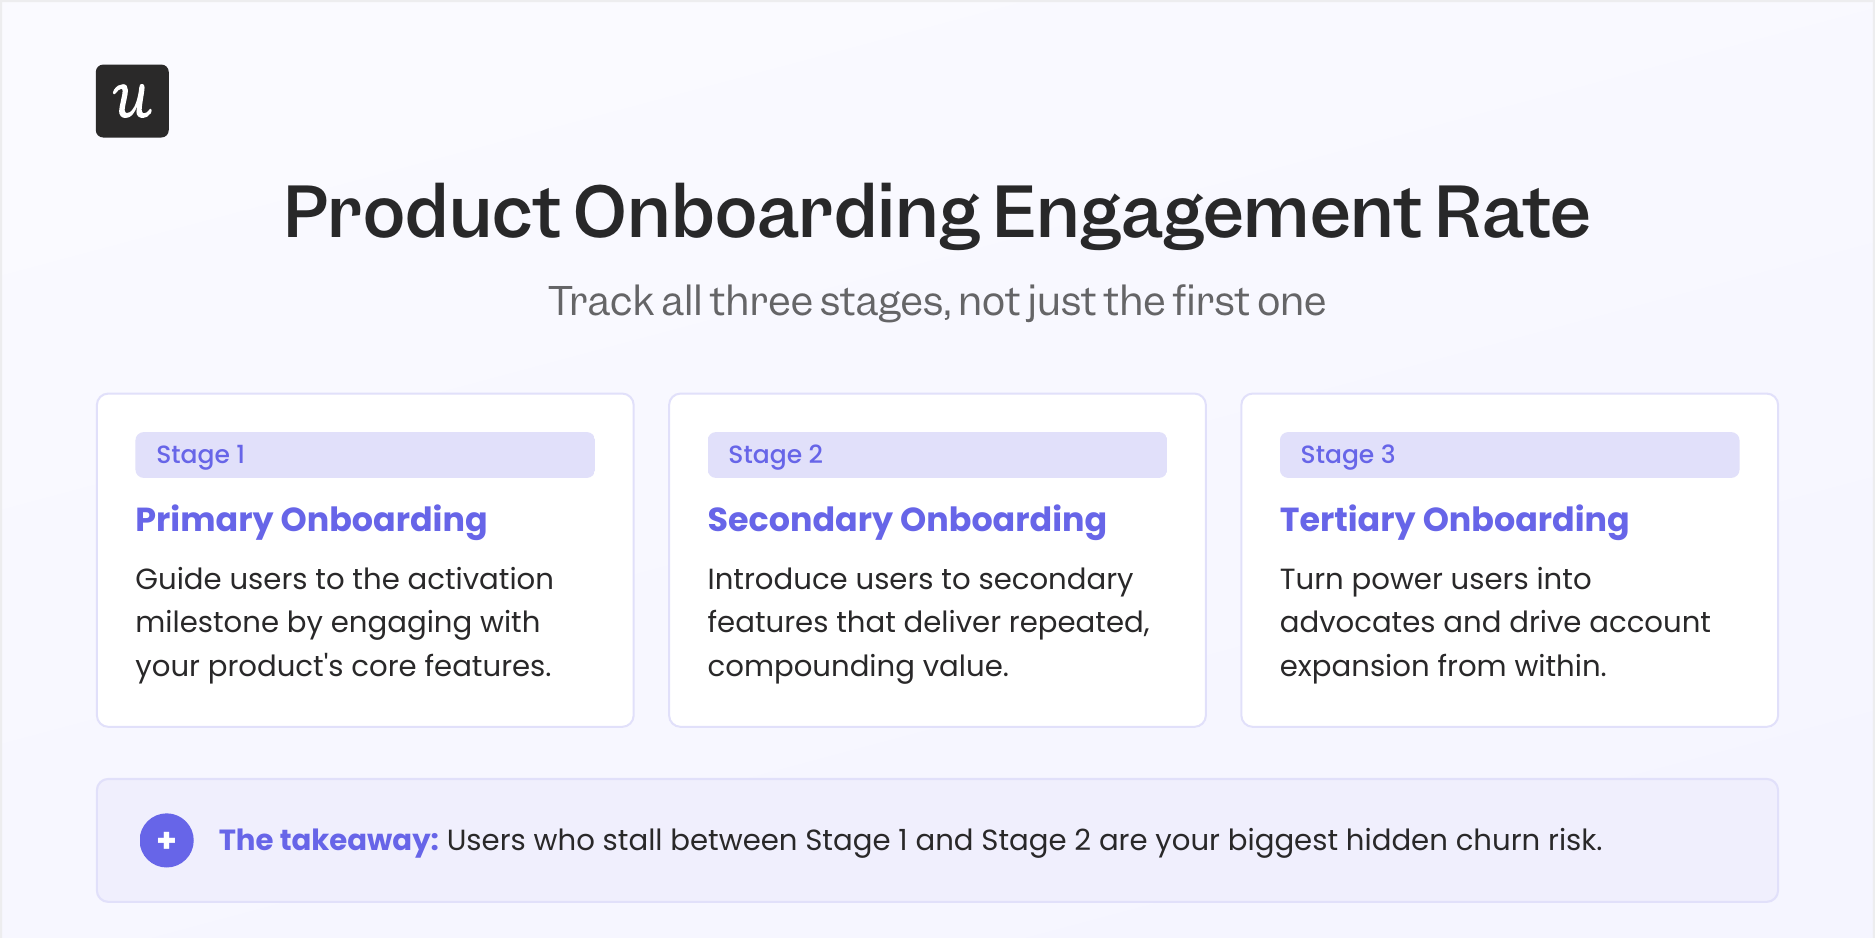
The most common mistake I see is treating primary onboarding as the only stage worth measuring. Users who complete primary onboarding but stall before secondary are a churn risk that most activation dashboards won’t catch until it’s too late, because activation alone says nothing about whether users are discovering the features that would make them stay long-term. Tracking all three stages gives you early warning signals well before churn shows up in your retention data.
To measure onboarding engagement, track each stage separately and look for where users stall. Useful signals include:
- Percentage of users who complete the full onboarding process vs. those who start it.
- Percentage of users who hit all onboarding goals within 24 hours of signup.
- Average time to complete all key onboarding tasks.
- Rate of progress through each individual onboarding step.
Product activation rate
Closely related to onboarding engagement, product activation rate accounts for the number of users reaching the activation point in the user journey, the moment they first experience real value from your product. Because “value” means something different in every product, this metric is defined differently for every team:
Your primary onboarding flow directly shapes this number, so low activation is often a diagnostic for the onboarding rather than the product itself. If users aren’t reaching the activation milestone, the first place to look is whether your onboarding is directing them at the right features in the right order. Low activation combined with high onboarding engagement typically means the milestone itself is defined wrong, not that the onboarding is broken.
Free trial conversion rate
A related metric worth tracking alongside activation rate is conversion rate: The percentage of users completing key downstream actions like upgrading from a free trial or committing to a paid plan. Conversion tells you whether users who activated are finding enough lasting value to stay, which means activation without conversion is a leaky funnel rather than a growth engine.
Product adoption metrics
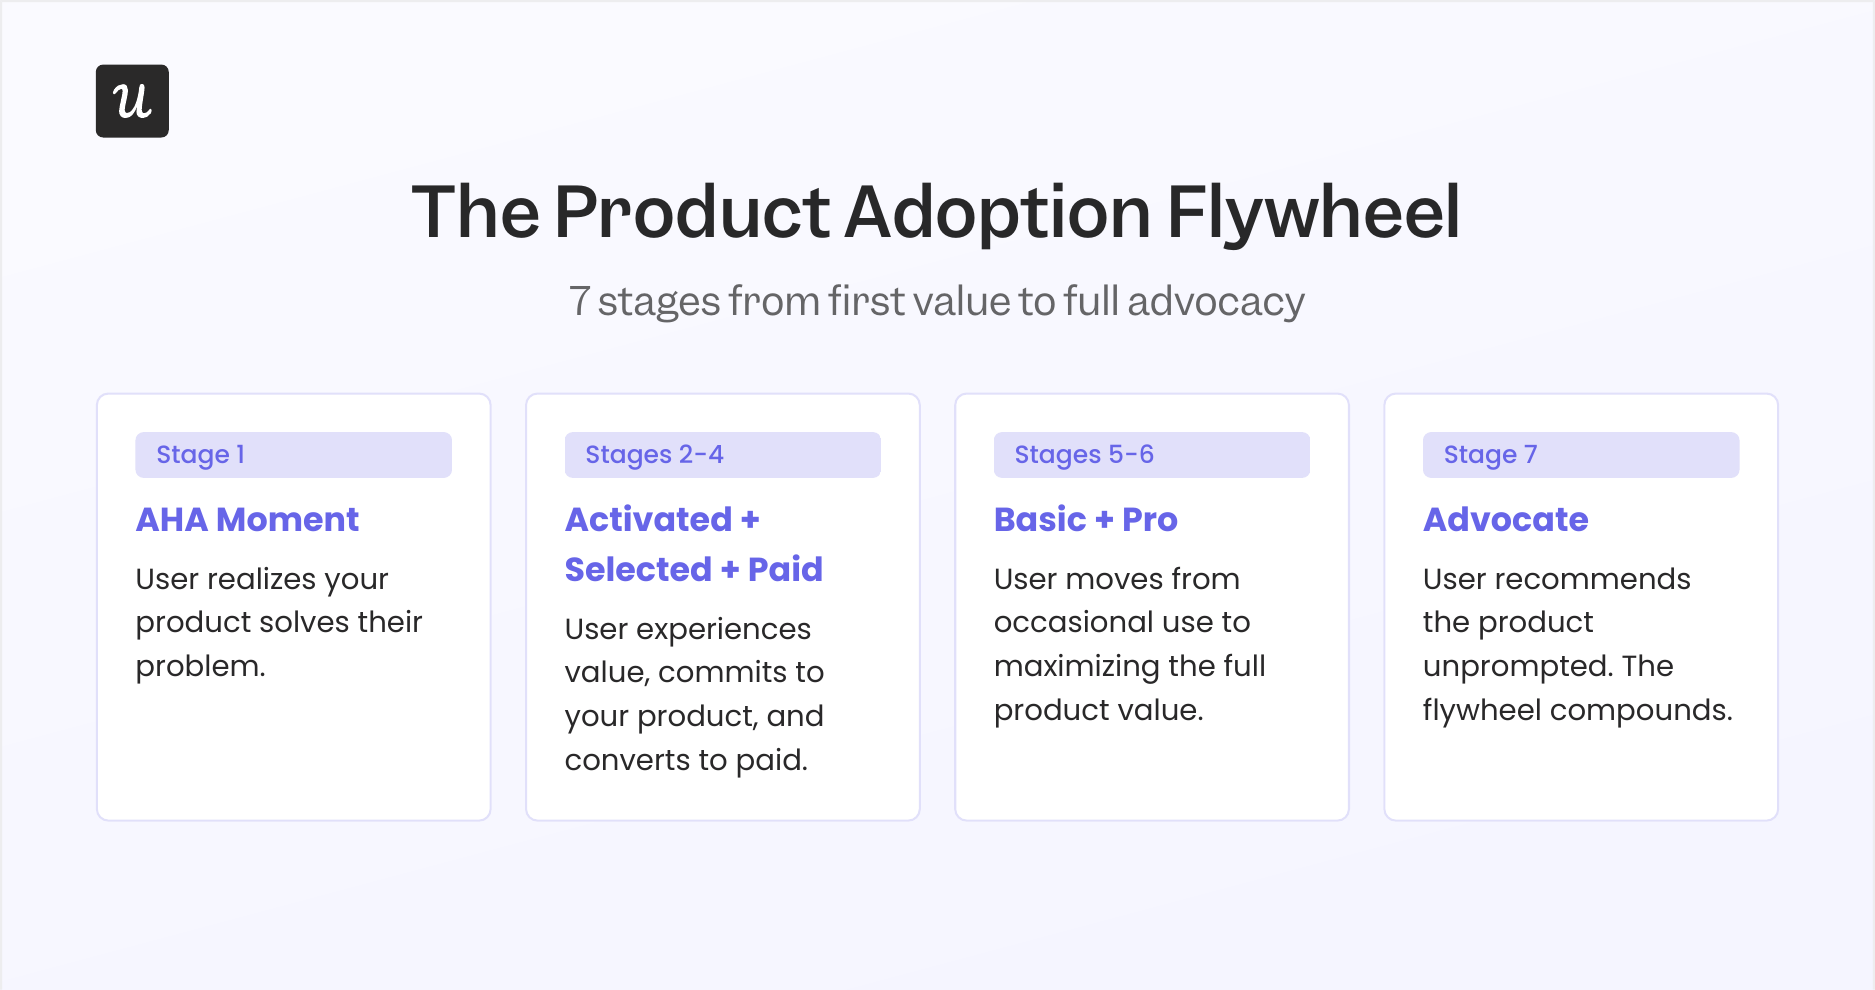
Where activation measures a single milestone, product adoption maps the full arc of a user’s journey from first experiencing value to becoming an advocate. At Userpilot, we model this as the product adoption flywheel, which has seven stages:
- ‘Aha!’ moment: The user realizes your product resolves their core pain point.
- Activated: The user experiences value by engaging with key features.
- Selected: The user decides your product is their primary tool for this job.
- Paid: The user commits financially to continue using the product.
- Basic: The user is using the product but not to its full potential.
- Pro: The user is actively maximizing value as a true power user.
- Advocate: The user recommends the product unprompted to others.
Product adoption doesn’t map to a single metric; tracking it means instrumenting milestones across the full customer lifecycle. Once you have each stage instrumented, identify where the largest drop-off happens, because that’s where your product investment should focus next. Cohort analysis is the right tool for understanding whether changes you ship are actually moving users further along the flywheel, or just reshuffling the same people between the same stages.
Time to Value
Sitting inside the activation and adoption arc is one of the most actionable individual metrics a product team can track: time to value, which measures how long it takes for a user to reach the “Aha!” moment after signup. The goal is straightforward: shorten this window as much as possible, because the implications of getting it wrong run all the way through your retention curve.
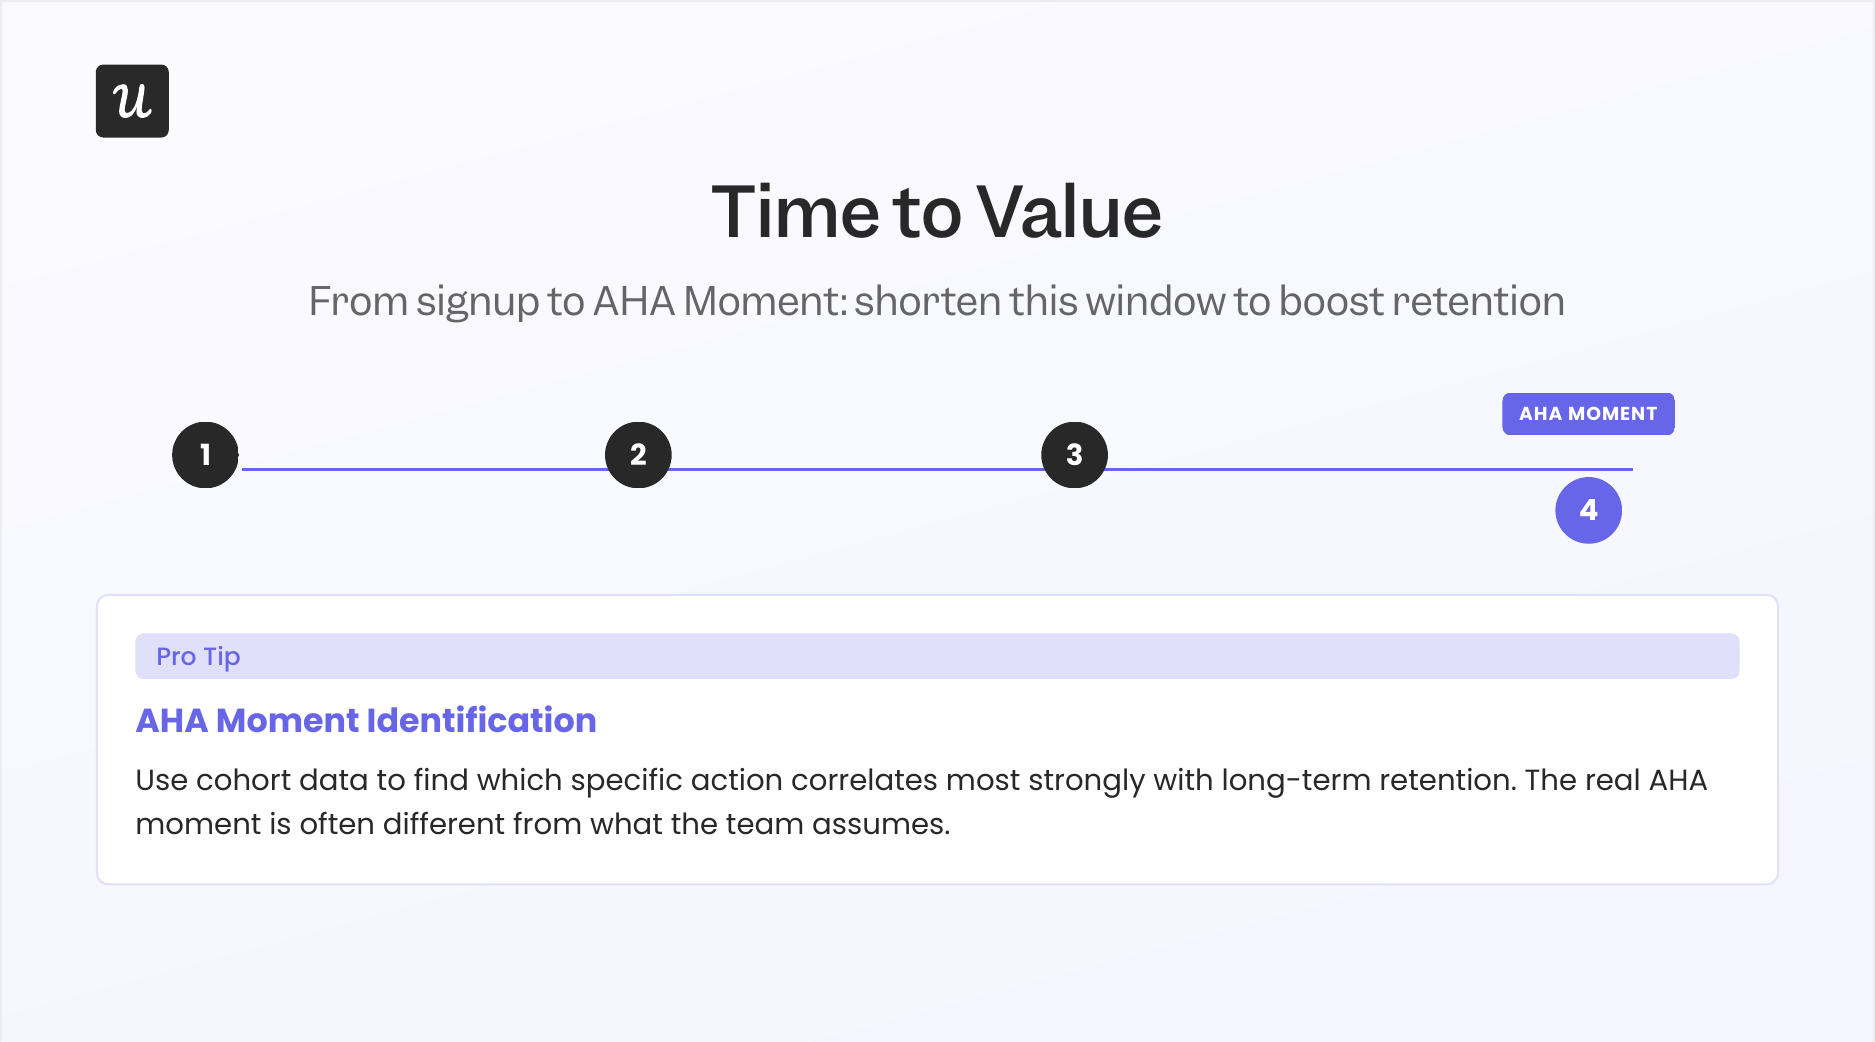
Every additional day between signup and the AHA moment is a day the user might decide the product isn’t worth the continued effort. Reducing time to value improves activation rate, cuts early churn, and typically correlates with stronger long-term retention. In practice, the fastest path to the AHA moment is almost always a simpler onboarding flow: removing steps, not adding them.
One often-overlooked move here is “Aha” moment identification: rather than assuming you know which action constitutes the “Aha” moment, use your product usage data to find which specific action or set of actions correlates most strongly with long-term retention in your cohort data. In many products, the real “Aha” moment differs from what the team assumes; your usage data will tell you which action it actually is.
Number of key user actions per session
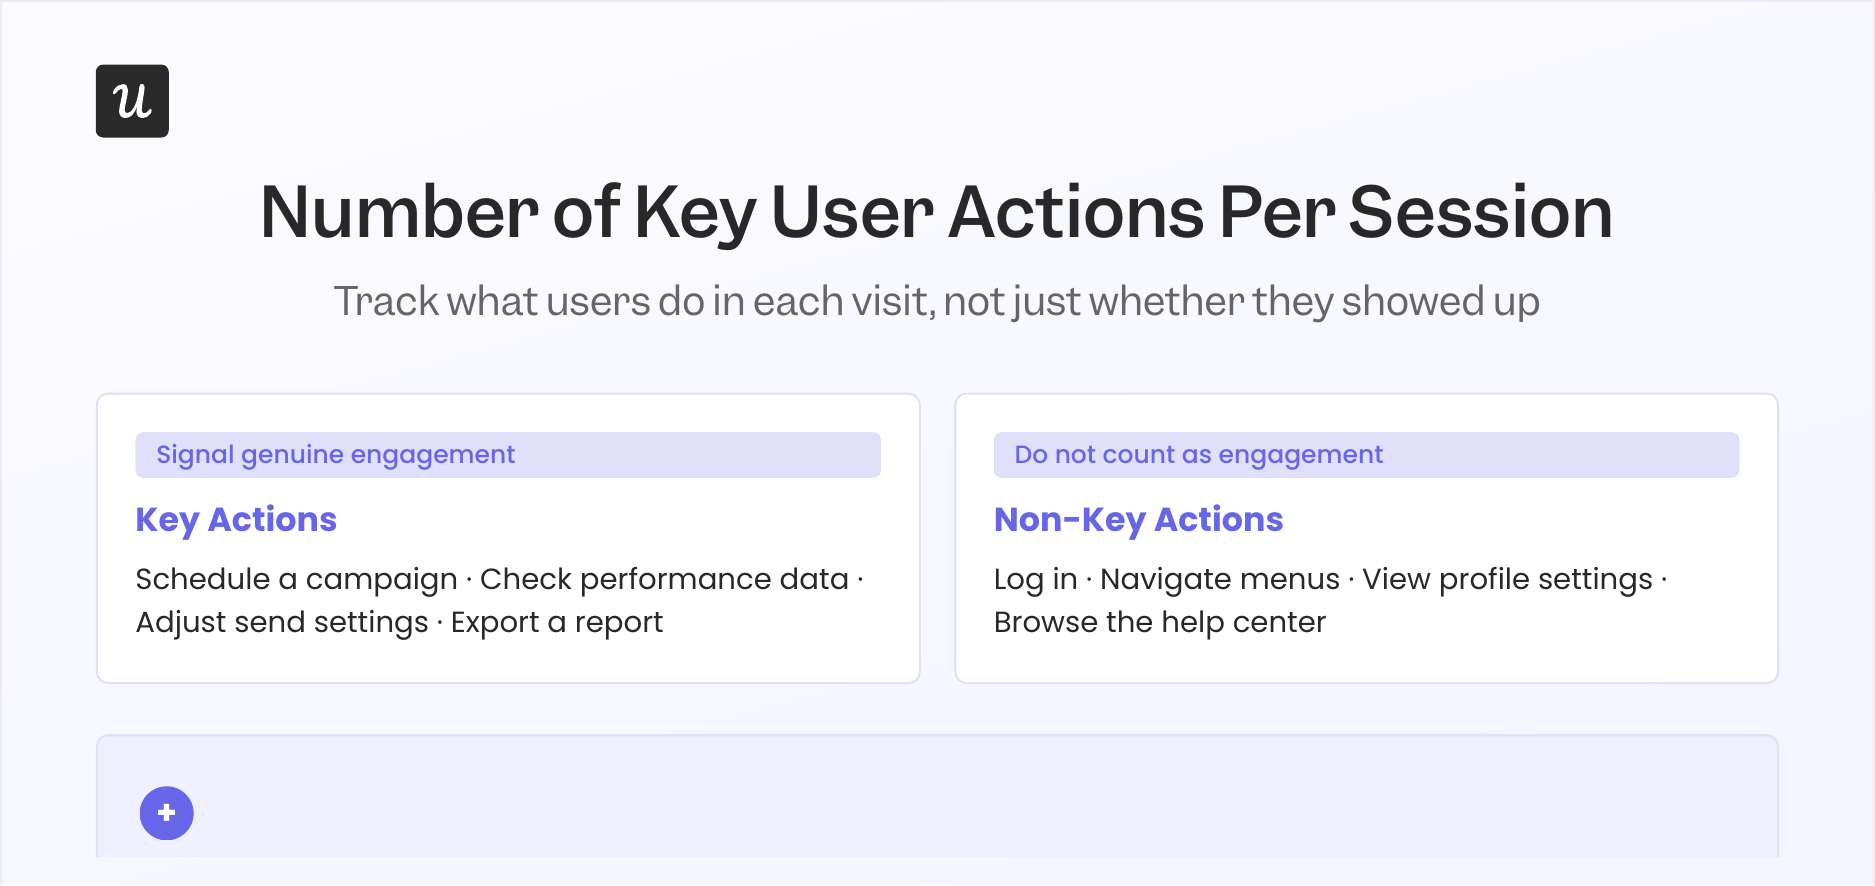
Going deeper than whether users return, the number of key user actions per session tracks whether users are actually doing the things that matter in each visit. For an email marketing tool, the core actions might be scheduling a campaign, checking performance data, and adjusting send settings; those signal genuine engagement, while logging in and navigating the settings menu do not. The distinction matters because a user who shows up but never completes a core action is very different from one who completes three in ten minutes.
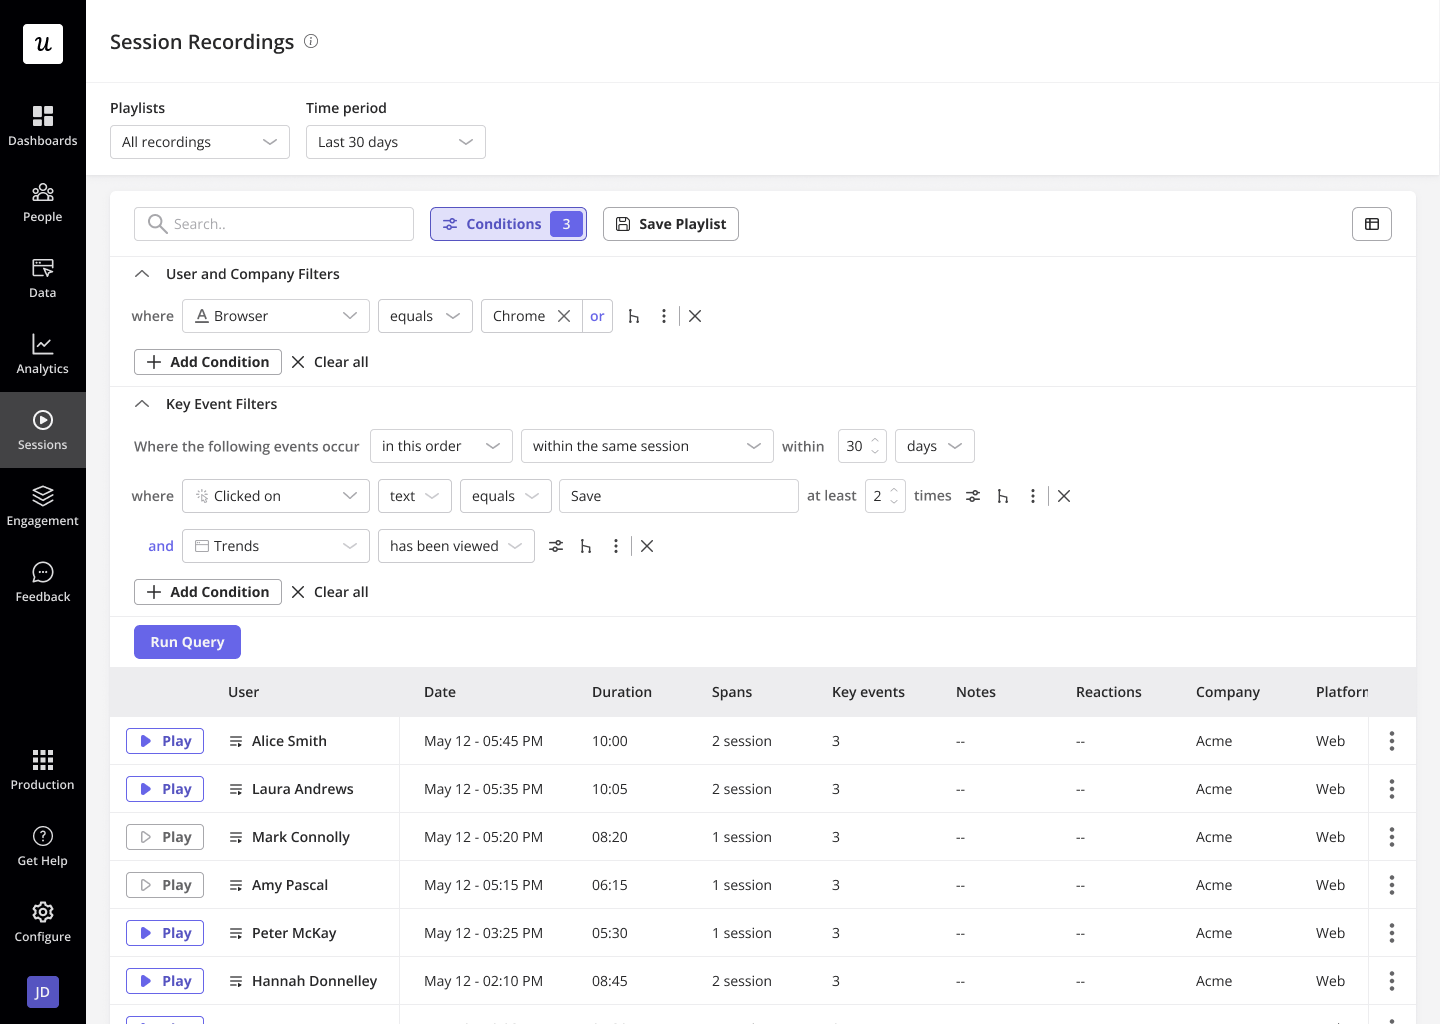
This metric functions as a product health signal because it surfaces the gap between users who show up and users who get value. High session frequency combined with low key-action counts is a warning sign worth investigating: the user is opening the product but not finding a reason to do anything meaningful in it. Session recordings are one of the most efficient tools for diagnosing this, since you can watch exactly where users navigate when they’re not reaching the actions that matter.
Average session duration is worth tracking alongside key actions per session, because the combination tells a richer story than either metric alone. A long session with zero core actions completed usually indicates friction or confusion somewhere in the workflow. A short session with two or three core actions completed suggests a user who knows exactly what they came for, and that’s the behavioral pattern worth actively encouraging.
Customer engagement score
Building on the concept of key actions, the customer engagement score (CES) turns your most important in-app events into a single weighted number for each user. Higher-value actions get higher weights; lower-value actions get lower weights. The result is a composite score that gives you an overall view of customer engagement at the individual account level rather than relying on averages across your entire user base:
The practical value of CES is in the extremes. Users with very low scores are at churn risk: cross-referencing those accounts with session data and funnel reports often reveals exactly where they’re getting stuck. Accounts with very high scores are your expansion opportunity, and studying their behavioral patterns helps you understand what “power user behavior” actually looks like inside your specific product.
CES becomes significantly more actionable when you trigger in-app interventions based on score thresholds. Userpilot’s engagement layer lets you set rules that automatically surface contextual help or a check-in survey when a user’s score drops below a defined threshold, shifting your CS motion from reactive to proactive.
Feature usage
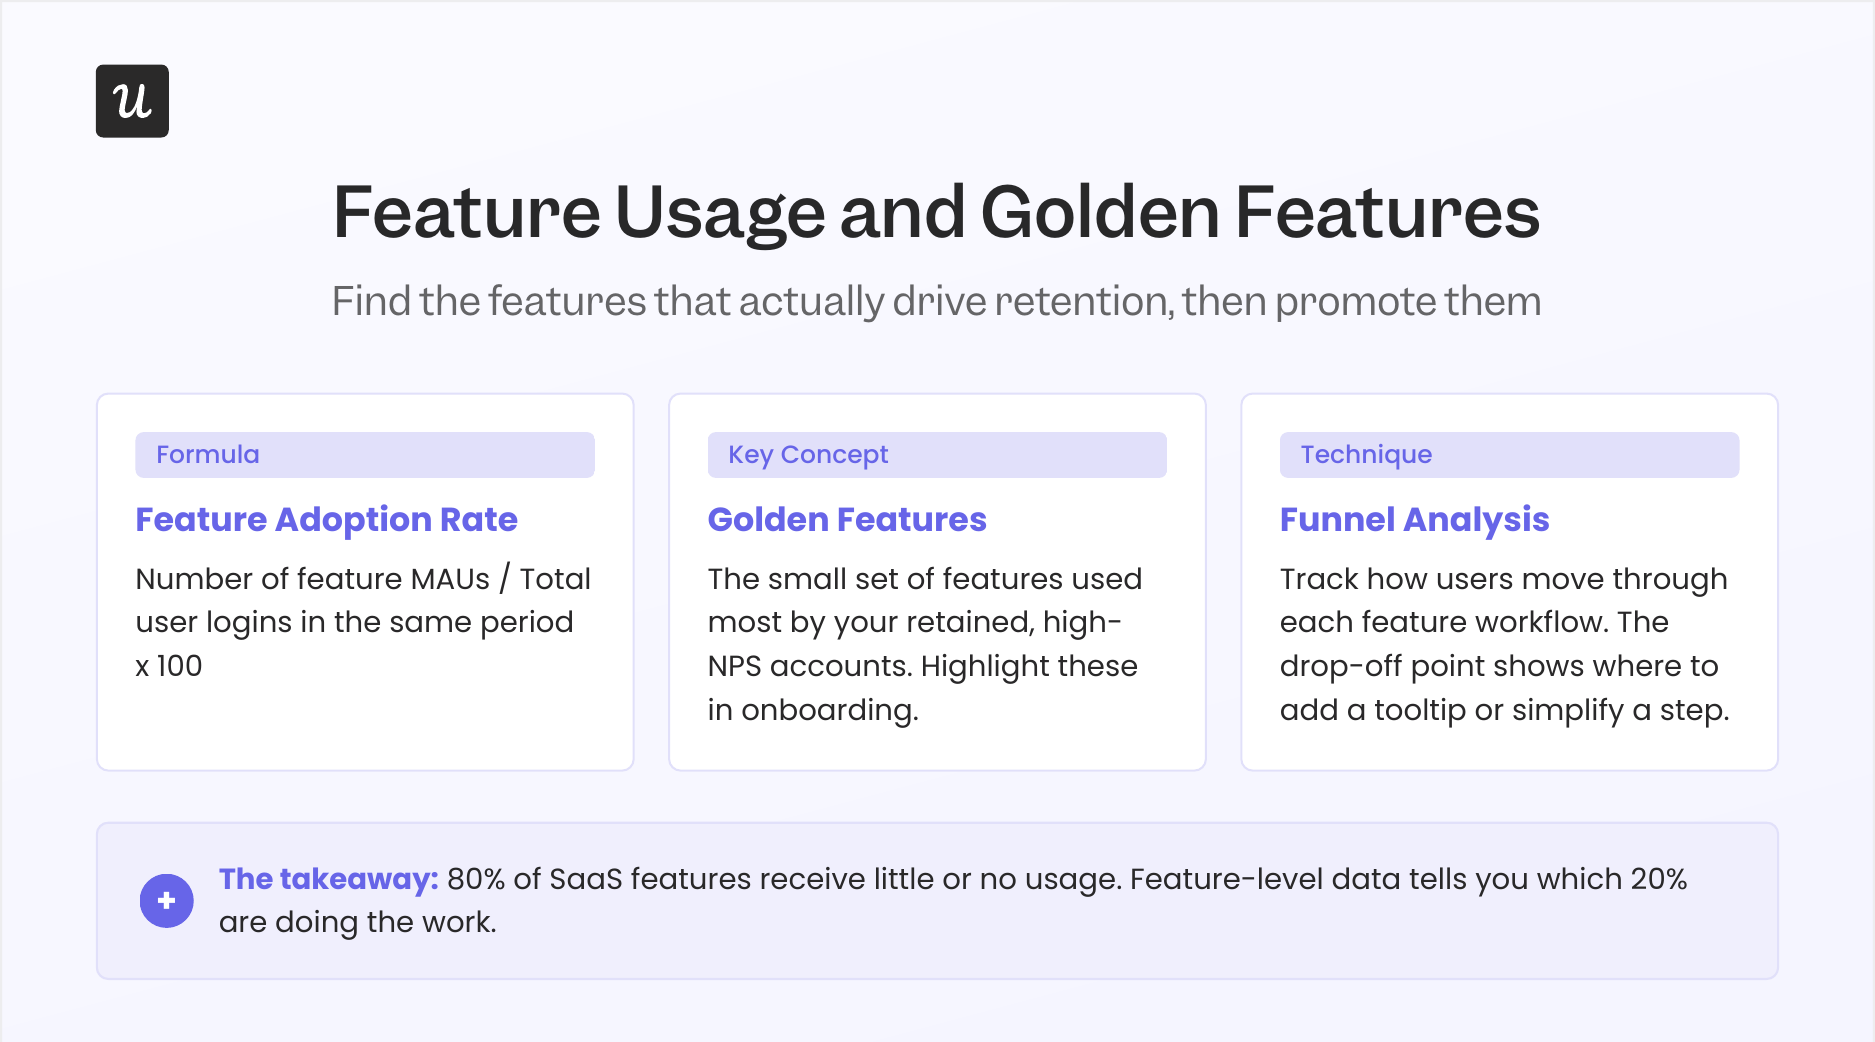
Where CES gives you an account-level health signal, feature usage gives you the feature-level map of how your product is actually being used. To calculate feature adoption rate for any specific feature:
Tracking feature usage at the cohort level adds a critical second layer of insight. When you segment by user persona and cross-reference with retention data, a small set of features usually emerges as doing the heavy lifting for your best customers; call these your “golden features”, the ones most frequently used by retained, high-NPS accounts. Once you know which features those are, you can highlight them in your onboarding and guide new users toward them earlier, rather than letting discovery happen by accident months into the relationship.
Funnel analysis within individual features shows exactly where users drop off in a workflow. That drop-off point is often where a single targeted tooltip, a contextual checklist, or a simple copy change has an outsized impact. Userpilot CEO Yazan Sehwail described the scale of this challenge as shipping velocity increases:
“As producing and building features become a lot cheaper, instead of every quarter, you’re releasing one or two features, now you’re releasing 7, 8, 9. It becomes even harder for product teams to manually have to track each one and understand usage for each one.”
Running experiments against segmented feature usage data is also where the most impactful roadmap decisions get made. When you have clear feature adoption rates broken down by persona, you can prioritize improvements based on evidence rather than intuition.
Product usage stickiness
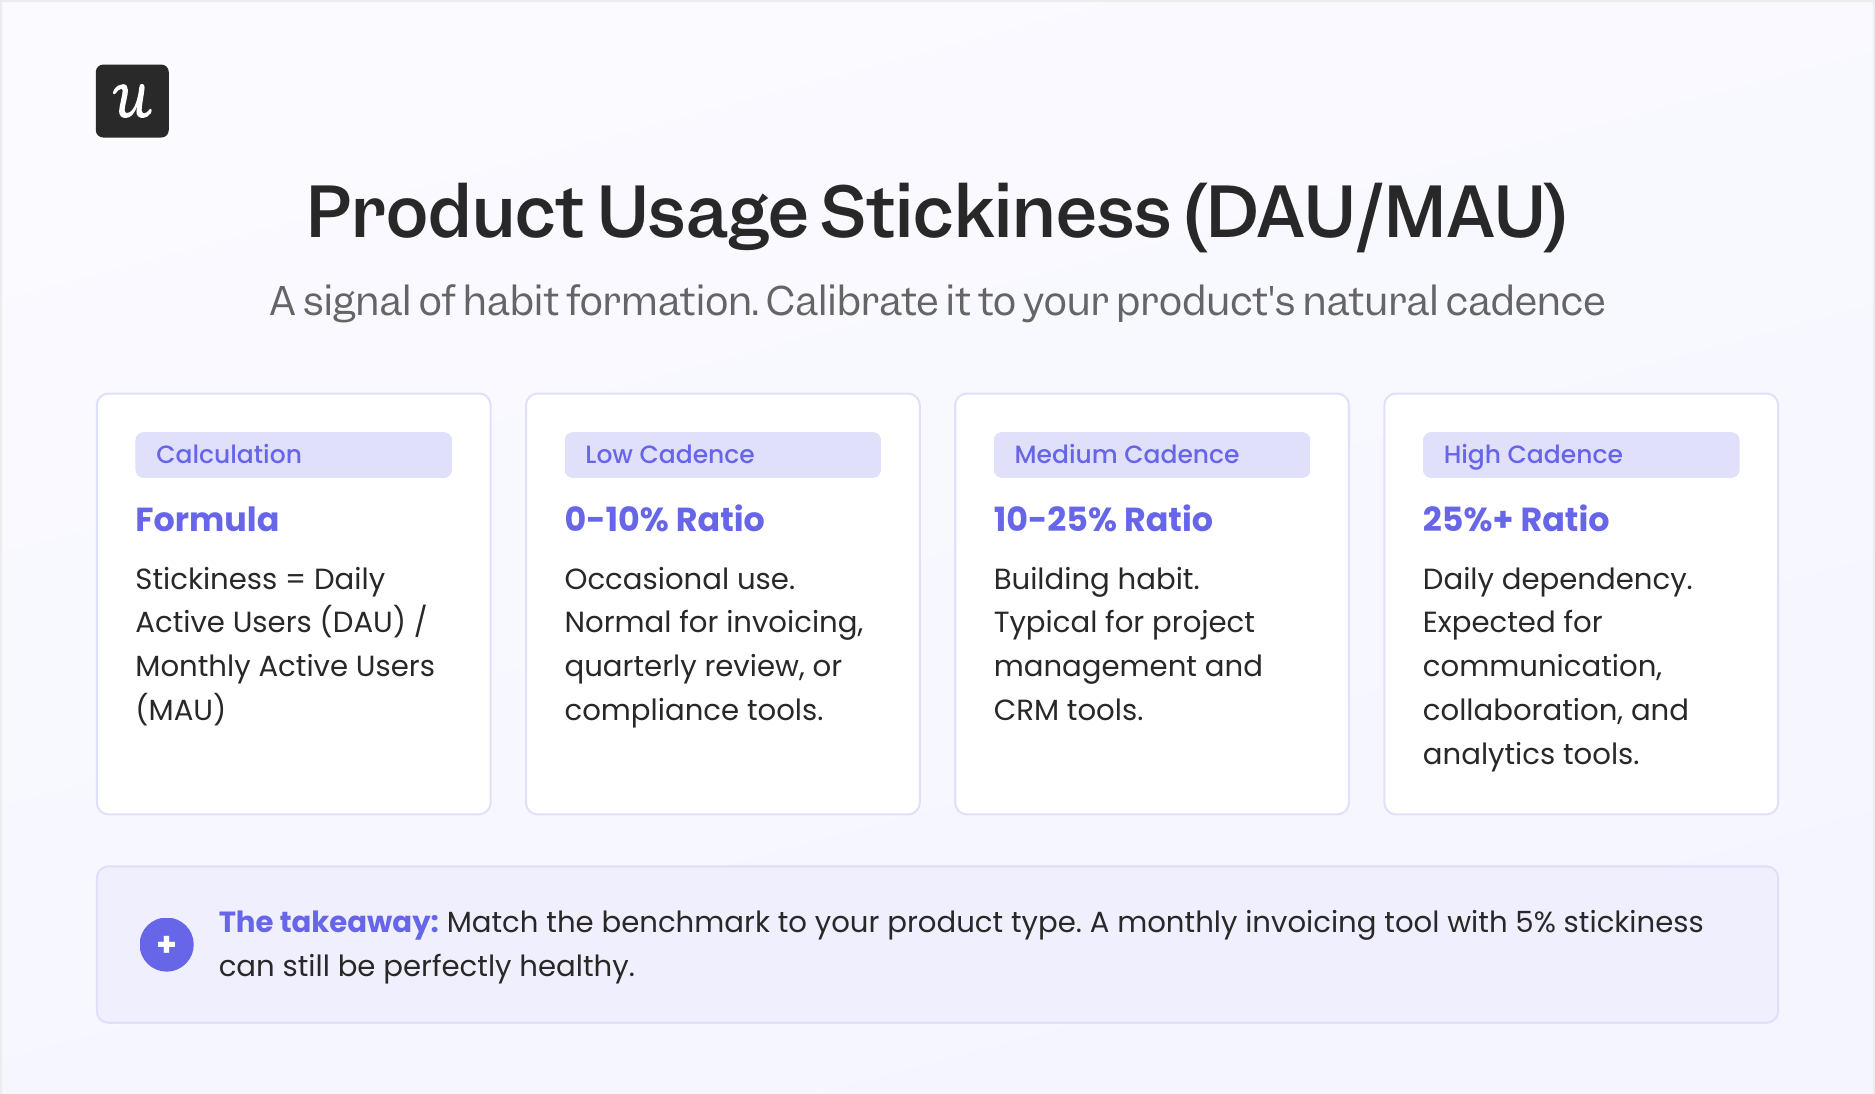
Rounding out the core metric set is product usage stickiness, which measures how frequently your monthly active users are returning on a daily basis. The formula is simple, but the interpretation requires context:
A higher stickiness ratio means users are building a daily habit with your product. A lower ratio is entirely normal for products with a less frequent natural cadence: project management tools, invoicing software, and quarterly review platforms all tend to have lower DAU/MAU ratios, and that doesn’t signal poor health. Before using stickiness as a warning sign, confirm that daily use is what your product’s core use case actually demands.
Three practical ways to extract more signal from this metric:
- Identify your natural cadence: DAU/MAU suits collaboration and communication tools, while Weekly Active Users (WAU)/MAU is more meaningful for products with an inherently weekly rhythm.
- Compare cohorts to find the stickiness pattern: Segment users by behavior and look for which cohorts show consistently higher stickiness. Those segments define what “successful use” actually looks like in your product, and that pattern is worth reverse-engineering into your onboarding.
- Use predictive churn analysis alongside stickiness: A user whose stickiness ratio drops across consecutive weeks is a churn signal worth catching before they cancel. Monitoring usage-frequency drops lets you trigger proactive CS outreach at the right moment, rather than after the damage is done.
Churn rate (the percentage of users who stop using your product in a given period) and retention rate (the percentage who continue using it) are the output metrics that stickiness predicts. When stickiness trends down over several weeks, churn rate will typically follow within one to three months in most SaaS products.
4 Product usage metrics for AI agent users
The eight metrics above were designed for human users, and they remain the right foundation for tracking human behavior in your product. The challenge is that AI agents interacting with your product via MCP and API calls don’t generate the same signals: they don’t click through a UI, they don’t open sessions in the traditional sense, and they won’t appear in your DAU count even if they’re executing hundreds of tasks per day. Treating agent activity as if it were human activity will eventually cause your dashboard to misread your healthiest accounts as disengaged and your riskiest as stable.
This is no longer a future consideration. Gartner forecasts that at least 40% of enterprise SaaS spend will incorporate usage-, agent-, or outcome-based pricing elements by 2030, which means agent usage data will eventually flow directly into your revenue model.
Here are the four metrics worth building into your analytics now, before agent usage becomes mainstream in your product:
1. Agent task completion rate
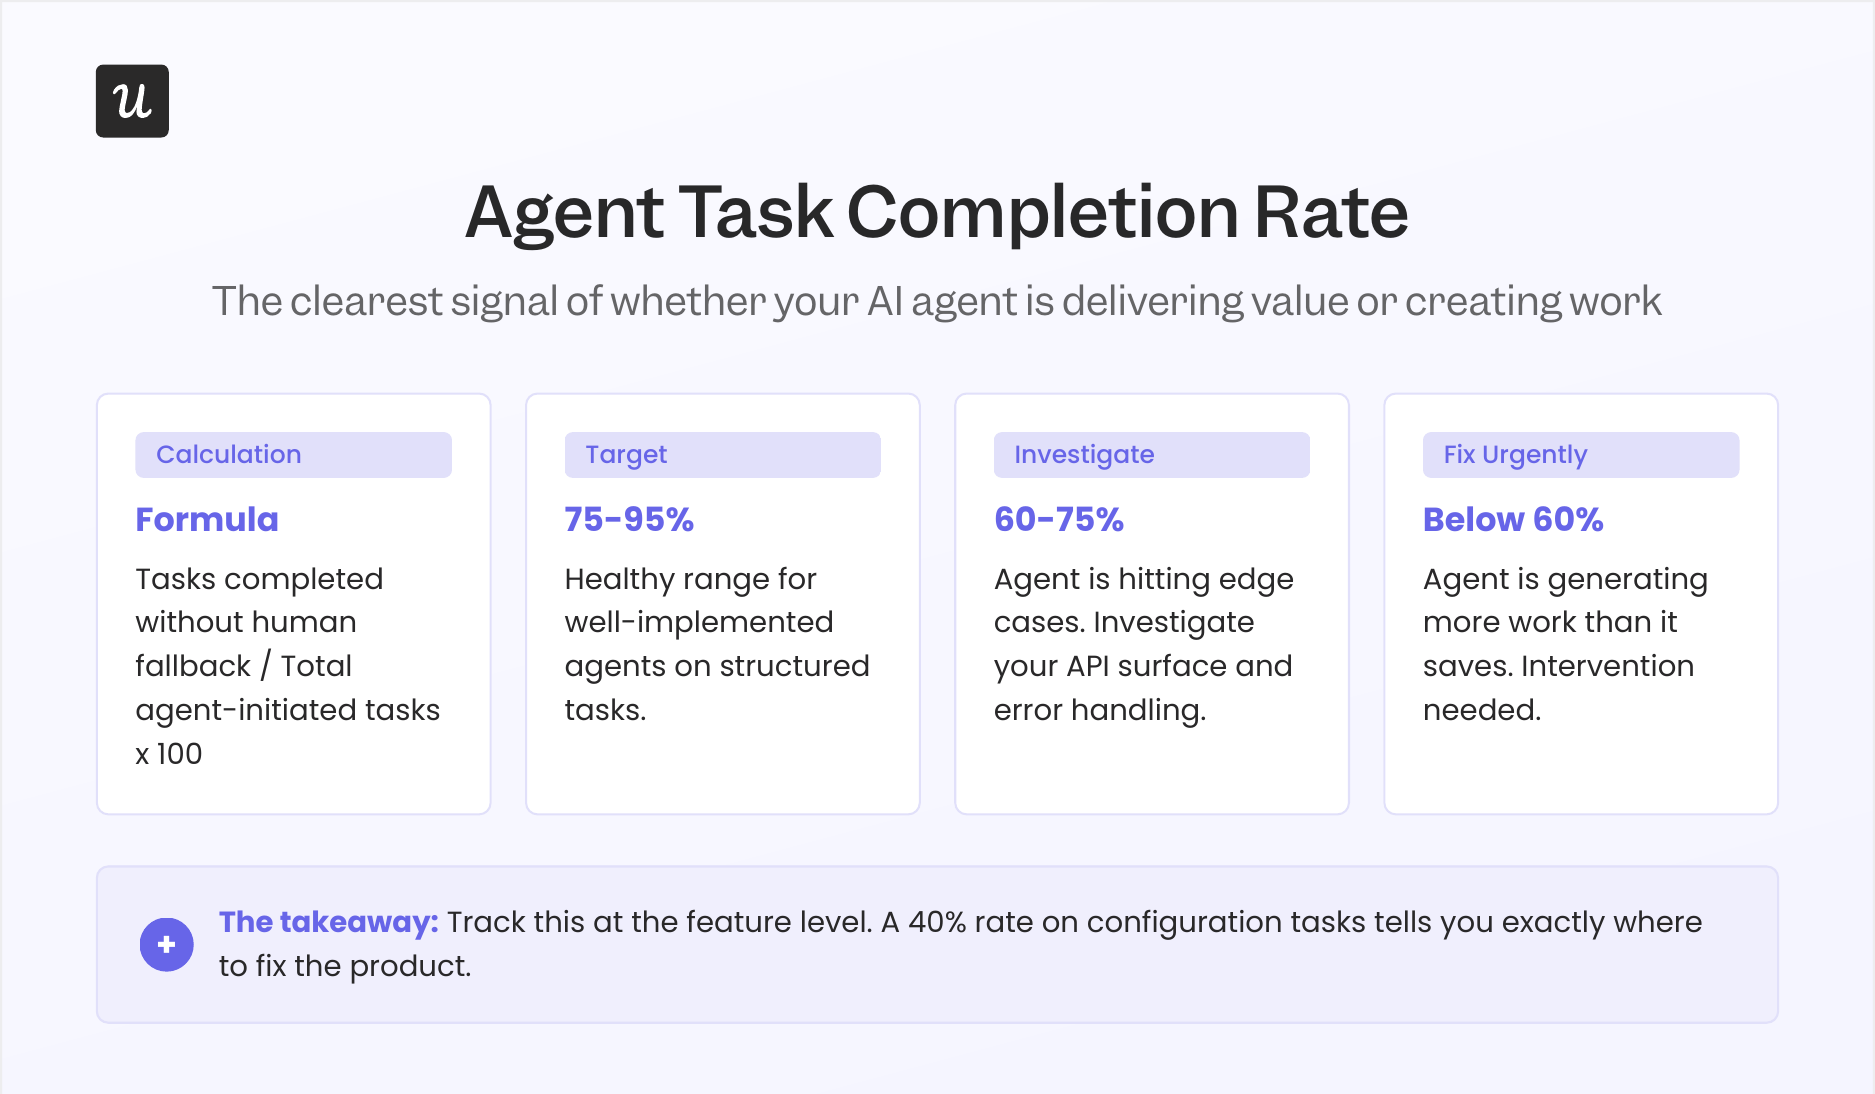
Agent task completion rate measures the percentage of tasks initiated by an AI agent that finish successfully without human intervention or fallback to a manual workflow. Of the four agent metrics, this one gives you the clearest signal of whether an agent is actually delivering value or just generating more coordination work for the team running it. Research across agentic AI platforms shows that well-implemented agents achieve 75 to 95% autonomous completion rates for structured tasks; rates below 60% typically indicate the agent is hitting edge cases your product doesn’t yet handle cleanly.
Track this metric at the feature level rather than just the account level. An agent might complete 95% of reporting tasks and only 40% of configuration tasks, and that second number tells you exactly where to focus product improvements for the agentic use case, since the gap is usually in your API surface or error handling rather than the agent itself.
2. Agent prompt volume
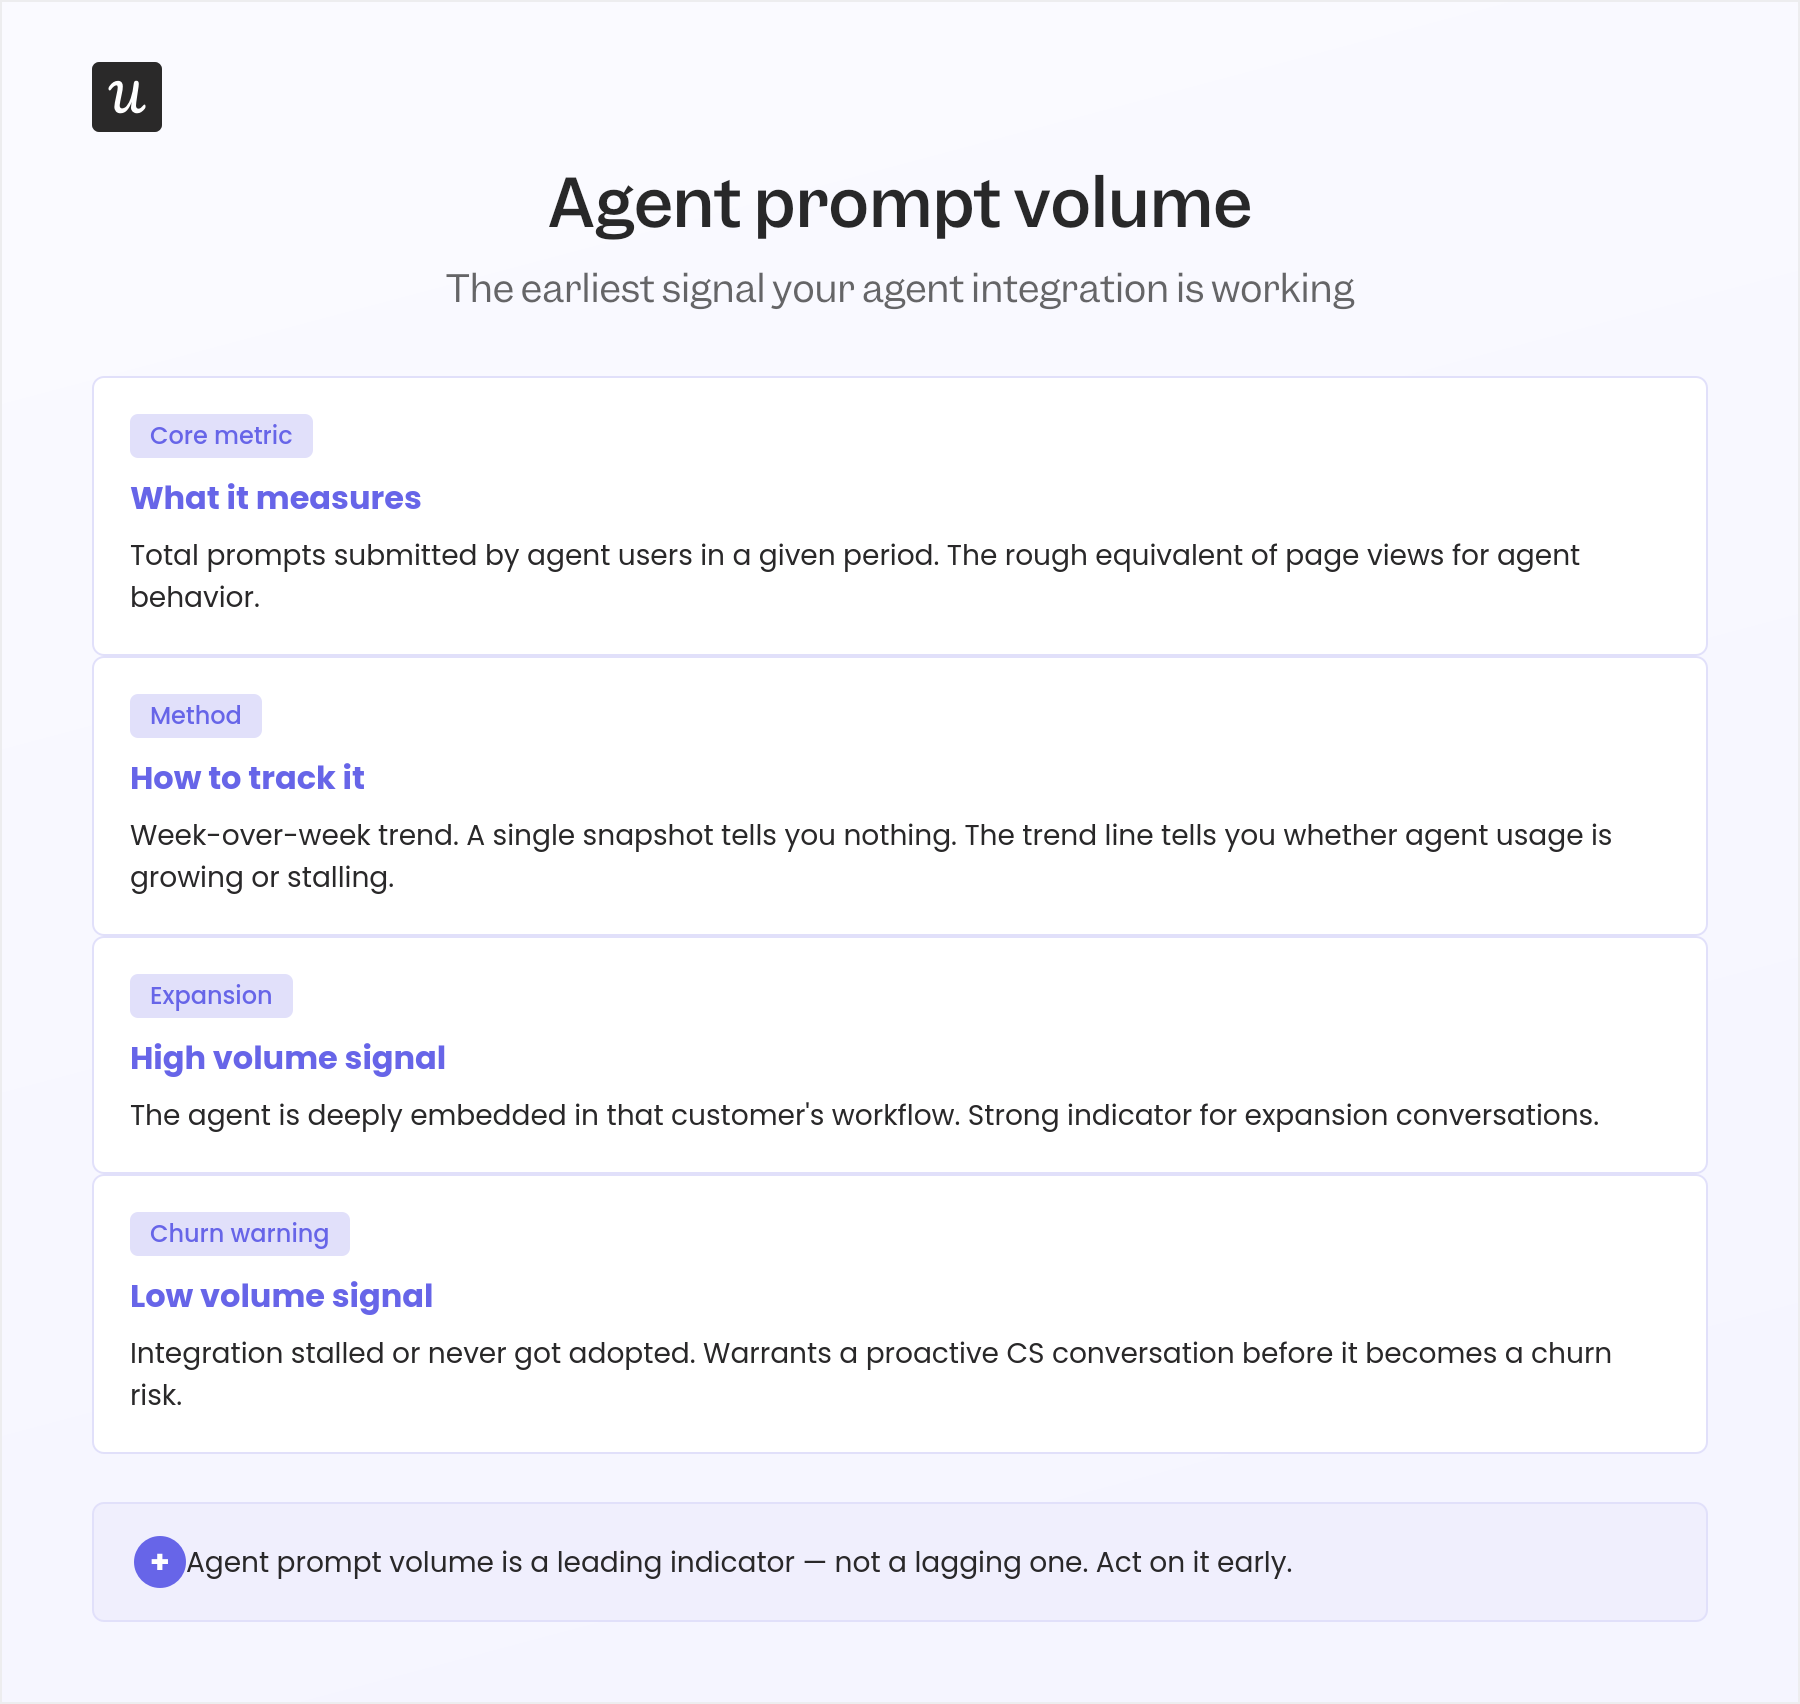
Agent prompt volume counts the total number of prompts submitted by agent users in a given time period, functioning as the rough equivalent of page views for agent behavior. Even when agents don’t generate traditional session events, prompt volume tells you how actively they’re using your product and whether that usage is growing or stalling. Tracking it week over week gives you a trend line that’s far more useful than any single snapshot.
High prompt volume from a single account is a strong expansion signal: the agent is deeply embedded in that customer’s workflow, and the relationship is compounding. Low prompt volume from an account that integrated an agent two months ago is a reliable warning that the integration stalled or didn’t get adopted by the team that was supposed to use it, which warrants a proactive CS conversation before it becomes a churn risk.
3. Agent containment rate
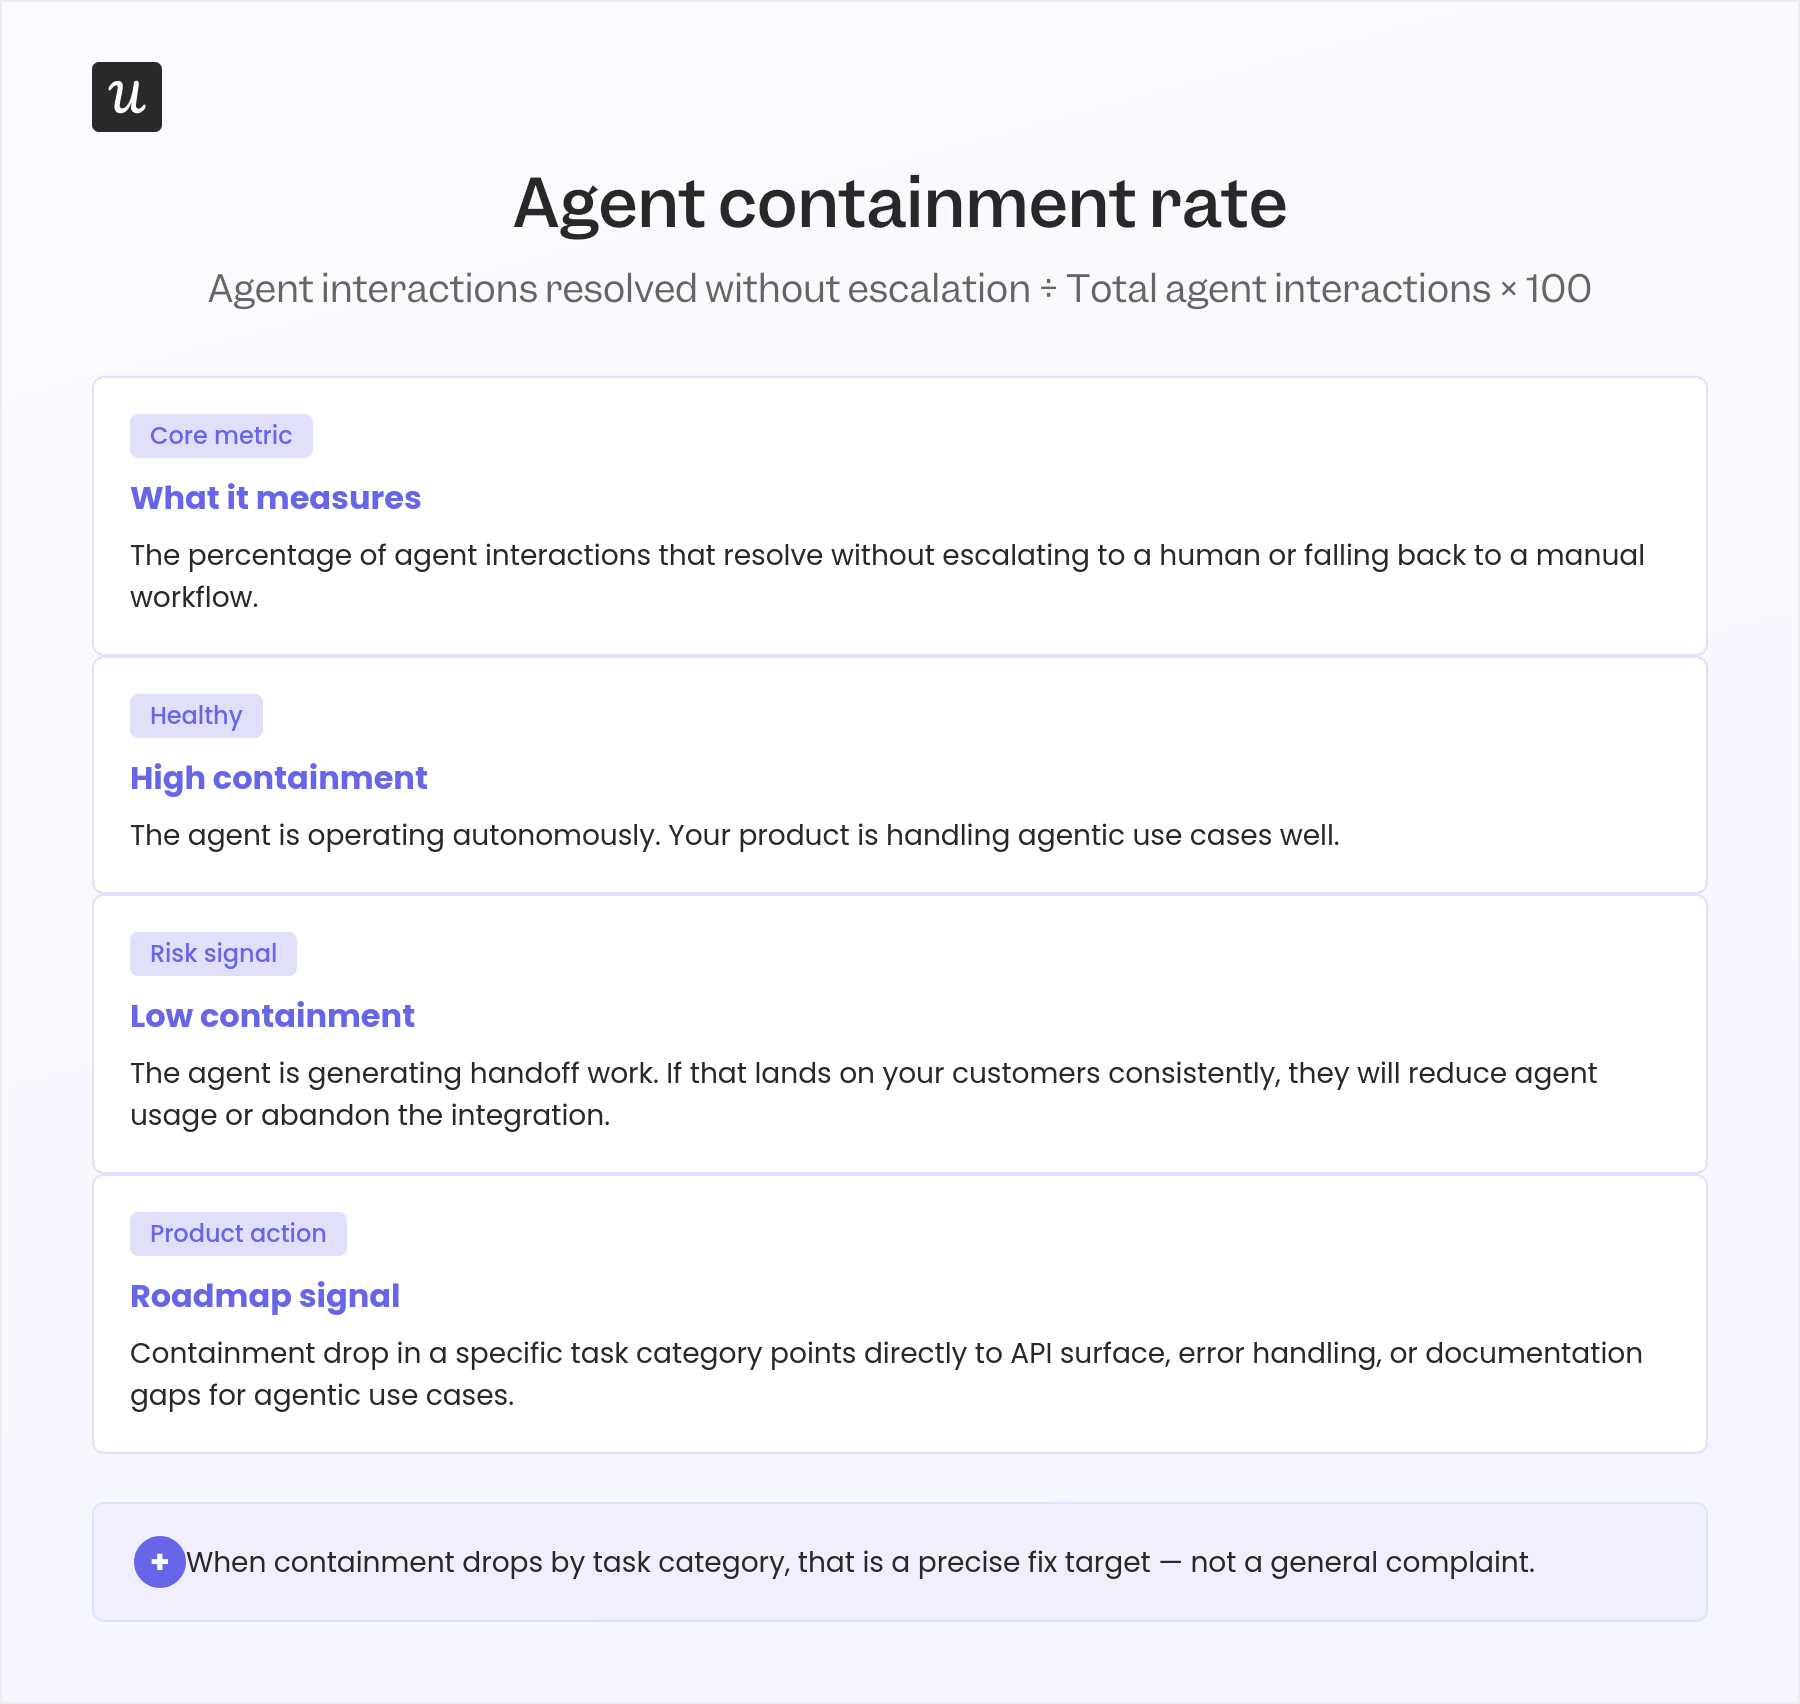
Agent containment rate measures the percentage of agent interactions that resolve without needing to escalate to a human or fall back to a manual workflow. High containment means the agent is operating autonomously and your product is handling agentic use cases well. Low containment means the agent is generating handoff work, and if that work lands back on your customers’ teams consistently, they’ll reduce agent usage or abandon the integration entirely, not because the agent failed, but because the cost-to-benefit balance shifted against it.
This metric connects directly to your product roadmap in a useful way. When the containment rate drops for a specific category of agent tasks, that’s a precise signal to investigate whether your API surface, error handling, or documentation for agentic use cases needs attention. It narrows the problem far more quickly than a general “agents aren’t working well” complaint from a customer.
4. Human-to-agent usage ratio
Human-to-agent usage ratio captures the share of your active usage coming from agents versus human users. An account that is 80% agent-driven and 20% human needs a completely different CS and expansion playbook than one that is 80% human, since the first needs infrastructure conversations while the second needs adoption coaching. The ratio also determines which of your other metrics to trust: if an account’s traffic is 70% agents, its apparent “DAU” is mostly automated activity and shouldn’t be read as a human engagement signal.
Beyond individual account management, the ratio across your customer base tells you something important about where your product is heading. As that number shifts toward agents over time, the metrics, pricing conversations, and success benchmarks that served you for human-driven accounts will need to evolve alongside it.
How Userpilot and Lia track agent behavior
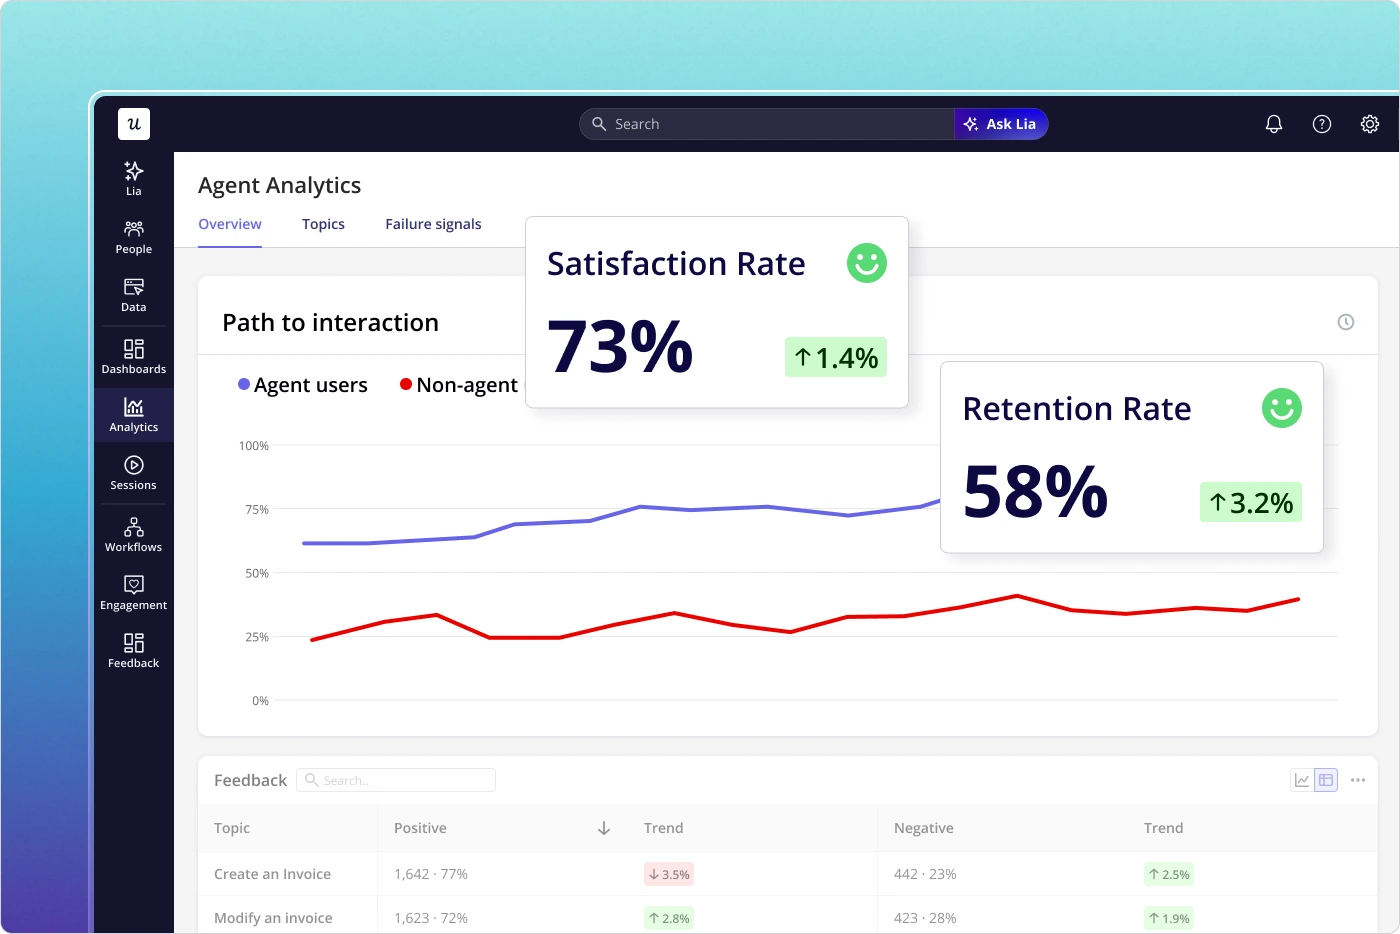
Userpilot’s product analytics separates agent-originated events from human-originated events at the instrumentation layer, which means you can filter any of the four metrics above by event source rather than having to infer behavioral origin from patterns after the fact. The prompt volume, task completion, and containment signals all flow through the same event pipeline as your existing human usage data, just tagged differently at the point of capture.
Lia, Userpilot’s AI agent, is built to surface these signals through natural language rather than requiring custom queries or new dashboards for each metric. Yazan Sehwail, Userpilot’s CEO, described how this infrastructure is positioned in the broader agentic shift: “We see Userpilot as becoming the infrastructure that powers your product usage data for that sort of system. As teams start deploying their own AI agents, those agents are gonna tap on our existing infrastructure that will be powering all of the usage and all the product data, and that’s extremely powerful.”
In practice, Lia lets you ask questions like “which accounts have the highest agent prompt volume this week,” “where is agent containment rate dropping across our enterprise segment,” or “how has the human-to-agent usage ratio shifted in the last 30 days,” and get answers immediately rather than building a new report from scratch each time. That’s particularly useful for the four agent metrics above, where the patterns shift faster than a manually-refreshed dashboard can reliably track.
Yazan also described how this plays out more broadly for anyone who needs to pull usage data across multiple sources: “If you as a marketer wanted to see, using session replay, NPS data, survey data, and product usage data, you’re able to get your answer without having to go to Userpilot, without having to pull data and upload it to someone. So this is why MCP is gonna be a game changer.”
5 Mistakes product teams make when defining their metrics
Knowing which metrics to track is only half the problem. Ksenia Khmelevskaya, a product manager at 1inch with a focus on data-driven product strategy, documented the five most common definition mistakes she’d observed across product teams in a LinkedIn post I’ve found myself referencing in conversations with customers ever since. Most teams are making at least two of them without realizing it, and the cost compounds over time as dashboards built on shaky definitions become harder to question.
1. Metrics before strategy
Metrics are meaningless without a strategy, because the only question a product metric should answer is: “Is our strategy working?” When teams start tracking metrics before aligning them to a clear strategy, they end up with a pile of numbers that point in different directions and tell no coherent story together. The fix isn’t more dashboards or more granular data; it starts with deciding what “success” actually means before deciding what to measure, then working backward from there.
2. Dashboards before definitions
Dashboards are easy to build; defining metrics correctly is where the real work happens. A polished dashboard built on a poorly-defined metric produces confident-looking bad decisions, because the chart looks authoritative even when the underlying definition is ambiguous. Before anyone builds a chart, the team needs to agree in writing on exactly what this metric counts, what qualifies as an “active user,” what the right time window is, and what it would look like if this number moved in the wrong direction for the right reasons.
3. Output metrics as goals
Retention and revenue are output metrics; they measure the result of things that happened upstream, not the things that caused them. Giving a team “improve retention” as a goal without the input metrics that drive it is like telling a surgeon to “reduce complications” without discussing the procedure. Teams need input metrics: the specific actions that correlate with retention, the behaviors that predict expansion, and the early churn signals you can actually act on before they become cancellations.
4. Revenue-first instead of usage-first
Usage creates revenue, not the other way around, and the teams growing fastest are the ones obsessing over the usage metrics that drive revenue rather than the revenue figures themselves. As Kyle Poyar, founder of Growth Unhinged, finds in his SaaS benchmarking work: boards are increasingly evaluating companies on usage depth and activation alongside MRR. If your team’s weekly review only covers revenue, you’re optimizing the scoreboard instead of the game, and you’ll be surprised by churn that the usage data was flagging for months.
5. Confusing retention with engagement
Retention and engagement are not the same metric, and conflating them leads to false confidence: retention asks whether the user came back, while engagement asks what they did when they got there. A user who logs in once a week but completes zero core actions is retained but not engaged, and those two profiles require completely different interventions. Declaring that retention is healthy while engagement quietly erodes is one of the most common ways churn sneaks up on a product team, because by the time it shows in the retention data, the disengagement has been building for months.
Start with the metric that’s actually missing
Tracking product usage metrics is only valuable if they’re correctly defined, connected to a clear strategy, and read at the right level of granularity. The eight metrics above are still the right foundation for any SaaS product team, and that hasn’t changed. What has changed in 2026 is that they’re no longer complete on their own.
If your product has any AI agent usage, or you expect it to within the next 12 months, adding the four agent metrics above is the most impactful next step. Agent activity that looks like human activity will eventually misread your healthiest accounts as disengaged and your riskiest as stable, and by the time that shows up in churn, the damage is already done. Getting the instrumentation in place now costs very little; retrofitting it after agent usage is widespread costs significantly more.
If any of the five mistakes in the last section felt familiar, that’s usually the more urgent place to start. The most sophisticated analytics stack in the world won’t help a team that’s measuring outputs instead of inputs, or tracking engagement when they actually mean retention. Fix the definition first, then build the dashboard around it.
If you want to start measuring all of this without building custom instrumentation from scratch, Userpilot’s product analytics gives you feature tracking, funnel analysis, session replay, cohort reporting, and agent event separation out of the box, plus Lia to help you interpret what the data is telling you.
Want to see what your product usage data actually looks like? Get a Userpilot demo and we’ll show you.
About the author