Boosting and optimizing the conversion rate is vitally important for all product managers and savvy SaaS owners. Using CRO analytics is one of the best ways to drive growth.
In this article, we’re going to:
- Set out how quantitative data analysis can lead to conversion optimization.
- How to leverage CRO analytics data to enhance conversion processes.
- Explore the best conversion rate optimization tools on the market.
Ready to make a start?
Try Userpilot Now
See Why 1,000+ Teams Choose Userpilot

What is conversion rate optimization (CRO)?
Conversion rate optimization (CRO) – is the systematic process of increasing the percentage of website visitors who take a desired action.
For example, making a purchase, signing up for a newsletter, or clicking on links in your landing pages).
CRO involves understanding user behavior in your product, helping you figure out areas for improvement, and ultimately testing and implementing changes to increase conversions.
What is CRO analytics?
CRO analytics is the process of using data to understand how users interact with a product, service, or web pages (i.e. your website’s conversion rate) and ultimately to identify opportunities to improve conversion rates.
CRO tools track a variety of metrics and granular data, including:
- Traffic sources: Where are users coming from when they visit your website (i.e. visitor behavior, organic traffic)?
- Page views: Which pages are users visiting most often? Where do you see micro-conversions (i.e. through your site search, highest traffic pages).
- Bounce rate: What percentage of users leave your website after visiting only one page (i.e. where are your conversion funnels failing to convert visitors).
- Exit rate: What percentage of users leave your website from a particular page?
- Conversion rate: What percentage of potential customers take the desired action on your website, such as making a purchase or signing up for a newsletter? Are there areas driving substantial conversions?
All this real-time data taken as a whole can help you piece together valuable insights (way more useful than just landing page performance, for example).
How do you calculate the conversion rate?
To calculate the conversion rate, you need to divide the number of conversions by the total number of visitors and multiply the result by 100 to get a percentage.
It’s worth mentioning a ‘conversion’ can be defined in many ways.
A conversion might be when users click a button, interact with a specific feature, or go from free to paying customers.
For example, if you have an e-commerce website and you receive 5000 visitors in a month, and 100 of those visitors make a purchase, your conversion rate would be 2%.
What’s the average conversion rate in SaaS?
The average conversion rate in SaaS varies depending on many factors.
These include the company’s industry, target audience, product offering, product type, and more. Given that, aiming at one specific conversion goal doesn’t make a lot of sense.
Instead, let’s consider two different examples as a benchmark:
- Freemium. The average freemium conversion rate ranges from 1% – 10%.
- Website conversion. This hovers around 7%.
The benefits of CRO analytics
The CRO process is by no means simple. Despite that, it is a massively worthwhile investment for any business that wants to improve its website performance and grow its bottom line:
- Track user behavior and identify drop-off points: Analyzing a performance report and looking at the trends in user behavior for each and every user flow can be incredibly useful. They’ll show you what users are doing and exactly where they drop off.
- Improve the customer journey and user experience: The better your understanding of your users (i.e. audience reports), the better your chances of improving the customer journey and increasing conversions.
- Sync marketing and product efforts: CRO analytics and conversion reports help you align your marketing and product functions. This means teams are focused on building features that maximize user value and are easily communicated (i.e. enhanced e-commerce opportunities).
Macro and micro CRO analytics: What’s the difference?
Macro CRO analytics and micro CRO analytics are two different approaches to analyzing website data with the overall goal of improving conversion rates.
Micro CRO analytics focuses on revenue-generating metrics (i.e. number of leads and overall conversion rate). This type of analysis is useful not just for understanding the overall performance of your product, but identifying trends in macro conversions over time.
Micro CRO analytics focuses on more granular metrics (i.e. micro conversions), such as click-through rate, bounce rate, and time spent on a page. This type of analysis is useful for identifying specific areas of a website that need improvement (i.e. site speed, or web form analytics). These all typically feed into macro conversion goals.
What SaaS key metrics can be optimized with CRO analytics?
There is a huge range of metrics your CRO efforts can help you optimize. Let’s explore them!
Website visitors to free trial conversion rate
This metric – sometimes referred to as the freemium conversion rate – will show you the portion of website visitors who sign up for a free trial or a freemium account. It’s an important step towards acquiring paid customers.
Signup flow conversion rate optimization
This shows you the percentage of customers who trigger and then follow through on a signup flow within your product.
This is important to track so you understand how many people abandon the process: that gives you an idea of different opportunities for improvement (i.e. delay email confirmation, simplify forms, remove credit card, add SSO, and more).
User activation conversion rate optimization
This shows the percentage of people who successfully reach a particular milestone in your onboarding process and start to successfully derive value from your product.
Activation has a huge knock-on impact on a range of other metrics, so it’s important to track and optimize.
Free trial to paid conversion optimization
This is the percentage of users that upgrade from a free trial or freemium to a paid account.
For many SaaS businesses, this is the ‘north star’ metric: it demonstrates people are willing to part with their hard-earned cash.
Feature adoption conversion rate optimization
This measures the overall usage for a software product’s specific features: if your users aren’t engaging with features, they’re simply not going to get value from your products and you run the risk of losing them down the line.
Upgrade and expansion conversion rate optimization
Finally, this metric focuses on users expanding their accounts. It measures the percentage of customers who purchased additional features or upgraded their plan.
It’s critically important for savvy product managers as growth is the lifeblood of any successful SaaS.
6 CRO analytics methods for getting quality insights
Next up, we’re going to dig deeper into some distinct analytics methods that’ll help you unlock quality insights and drive more conversions.
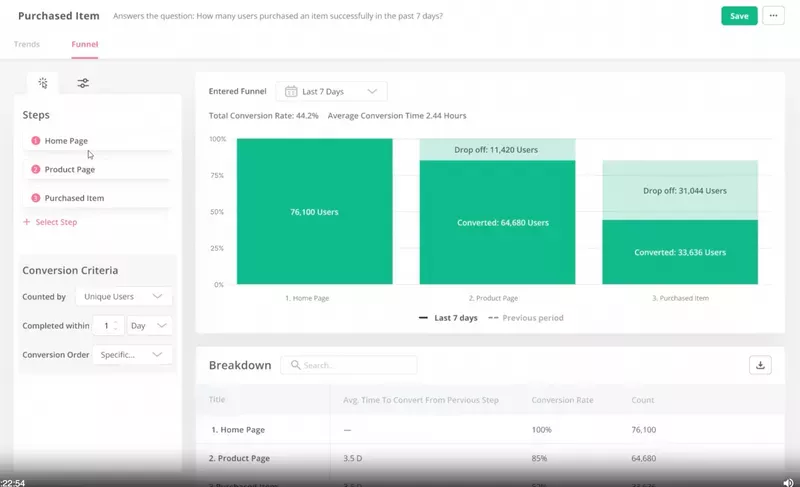
#1 – Identify the drop-off points in the customer journey with funnel analysis
CRO funnel analytics can help you identify junctures of disengagement, revealing friction points in the customer journey.
You can then dive into these further with other UX research methods to understand the reasons behind them and swiftly act on the data to improve conversion rates.
#2 – Use flow analytics to extract granular insights about user interactions
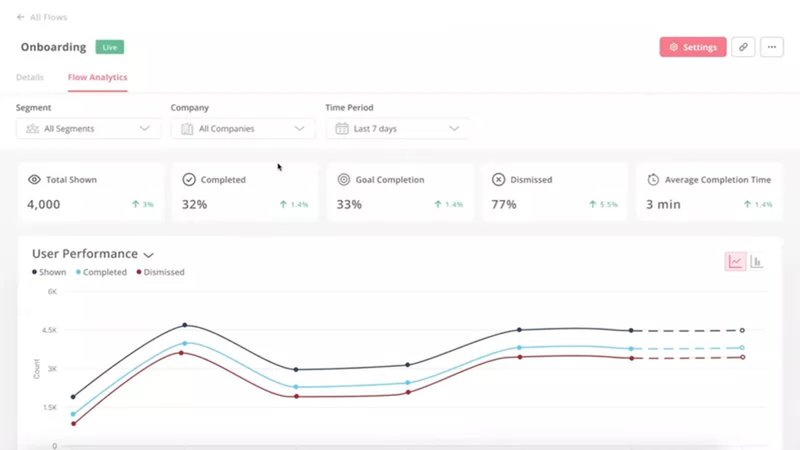
This type of analytics enables you to track in-app experiences at a step-by-step level.
For example, if your onboarding flow consists of a number of in-app messages, you will be able to analyze in detail which users interacted with them and completed the step, and which of them dropped out.
Flow analytics is one of the most powerful tools you have to truly understand what’s driving your user’s actions.
#3 – Track and analyze user retention trends over time with custom reports
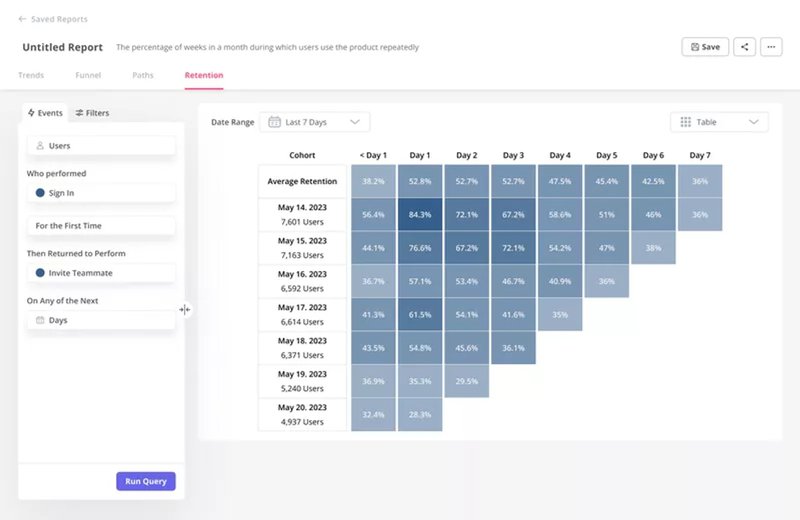
You can analyze retention trends using cohort and retention breakdown tables.
Here’s how: look at retention data for several time periods, then pinpoint exactly when in a customer’s lifecycle you start to develop a churn problem so you can act on data.
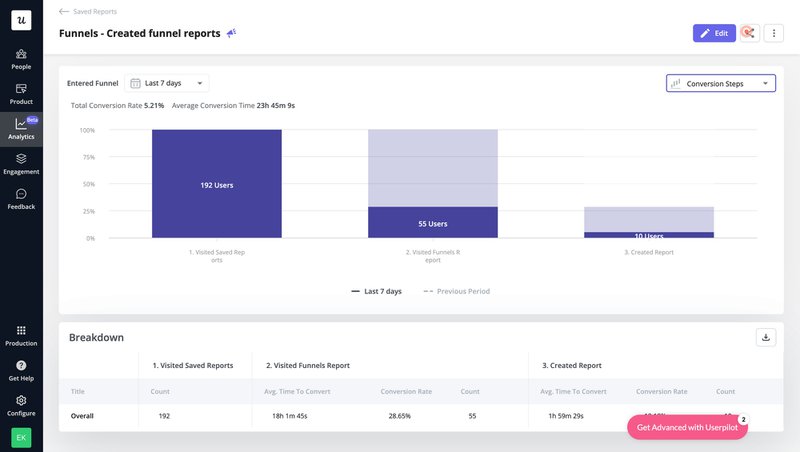
#4 – Use conversion funnel reports to see how users progress from one stage to another
Conversion funnels are typically one of many preset reports that can help you to identify drop-off points in a specific journey between two milestones (for example, from signup through to activation).
Analyzing funnels at different stages of the journey helps pinpoint drop-off points usually caused by friction.
Once you’ve identified these, you can use qualitative analytics like survey results or recordings to understand what’s happening and adjust your CRO strategy accordingly with the goal of reducing friction.
#5 – Analyze and prevent churn with path analysis
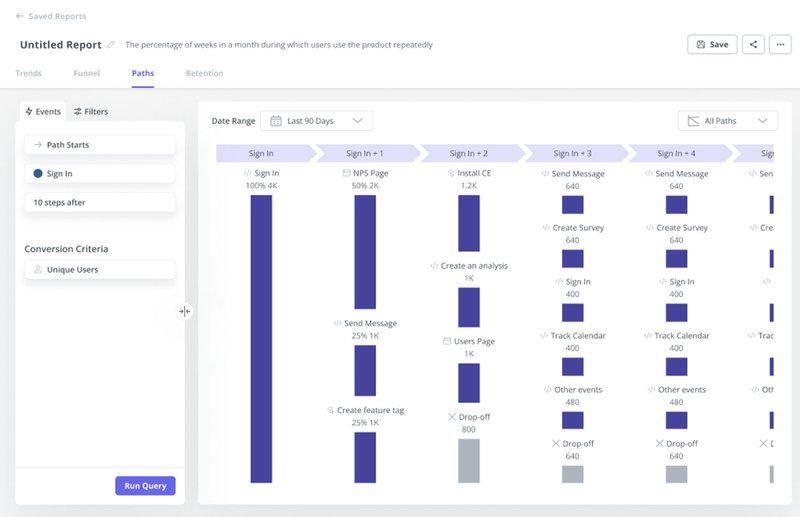
You can identify and prevent churn with reverse path analysis.
It’ll help you look at the steps users take before churning, and in doing so identify patterns that lead to churn.
That puts you in a position to act on data and adjust your conversion rate optimization strategy to engage with users fast and put them on a different path before they churn.
#6 – Determine top conversion paths and optimize them further
Ultimately, your time and resources are limited. You need to prioritize your efforts.
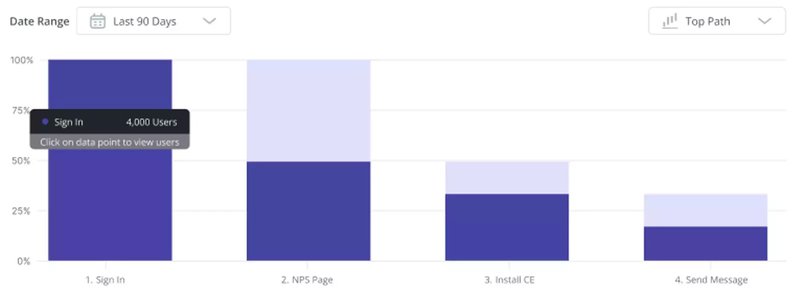
You can improve your chance of converting the most users by choosing the most successful conversion path and exploring how you can optimize them further (i.e. making them more mobile-friendly, tweaking copy to improve journey completion and generate more leads).
Doubling down on what works and playing to your strengths is a proven strategy for product success.
How to use CRO analytics for your optimization efforts
Next up, let’s shift focus to optimization: CRO analytics offers you lots of options.
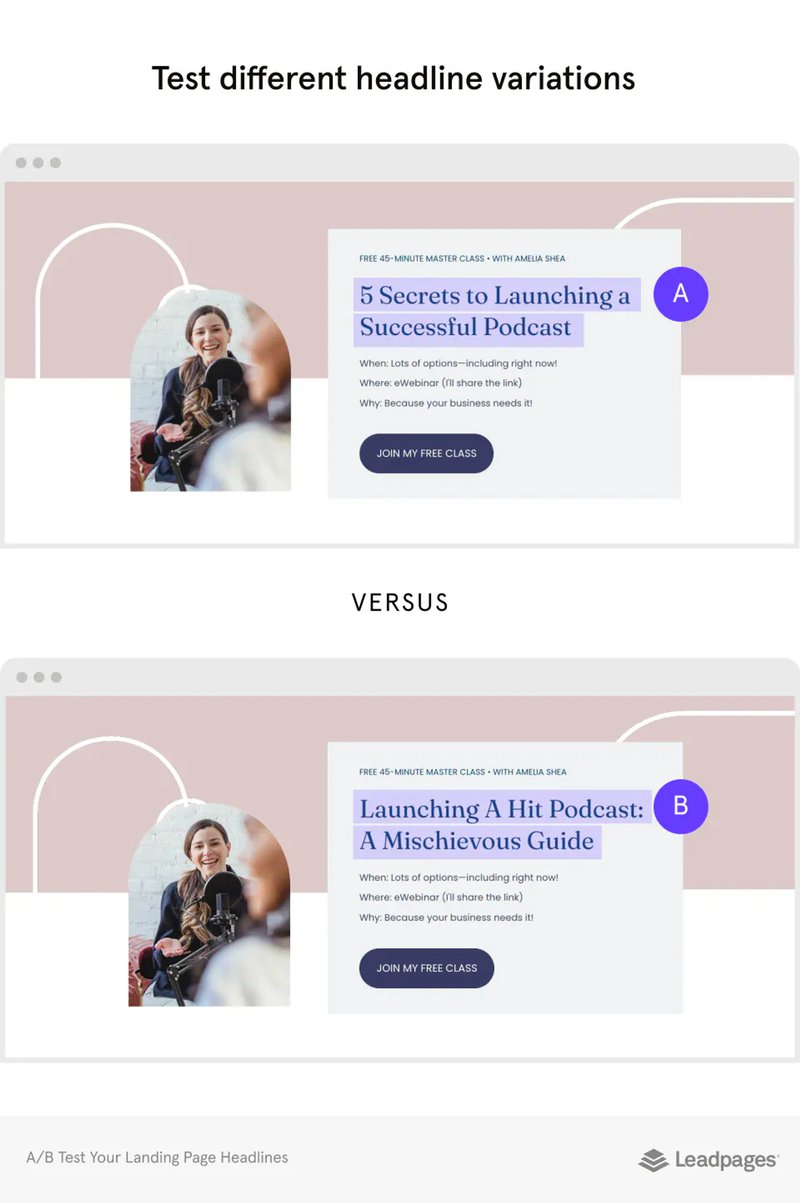
A/B test variations across your main landing pages
A/B testing and constant iteration can show you definitively which things your target audience values the most. To introduce A/B test variations across your main landing pages, you will need to:
- Identify the elements of your landing page that you want to test. This could be anything from the headline to the call to action button.
- Create two variations of your landing page. For example, you could create one variation with a different headline and another variation with a different CTA button. There are dozens of aspects you can vary: headlines, images, CTA wording, the hero, social proof, and more.
- Randomly assign visitors to one of the two variations. This will ensure that each variation is tested with a fair sample size so your results are valid.
- Track the performance of each variation. This could include monitoring metrics such as the conversion rate, bounce rate, and time on the page.
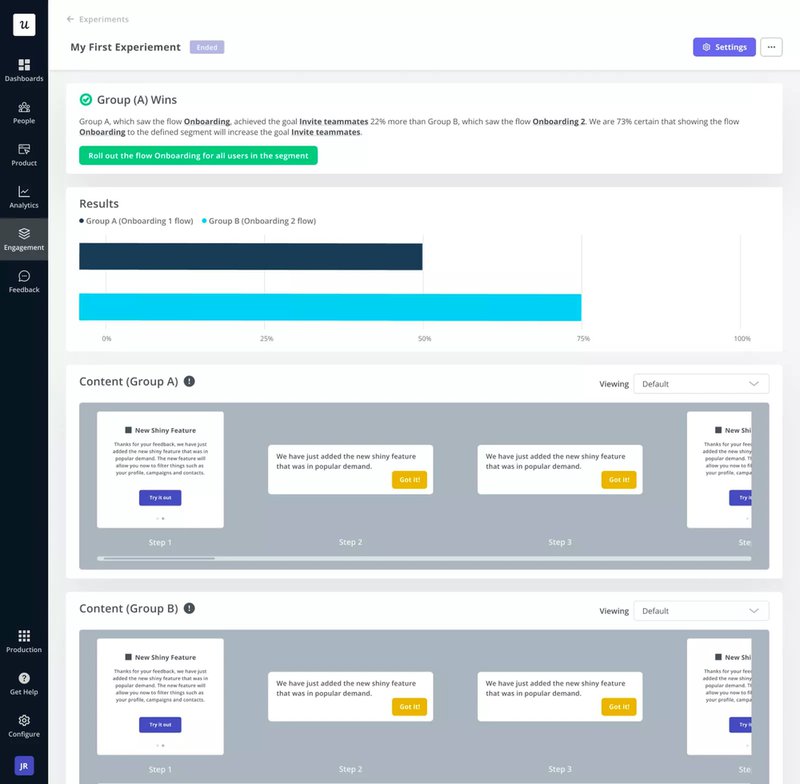
Test multiple variations of your in-app flows
Similarly, you can also tweak and iterate your in-app onboarding flows. It’s another form of multivariate testing, the results of which should drive improved macro conversion rates.
For example, you might alter the sequence of messages, the type of UI patterns you use, and other interactive elements – and closely monitor which help your users reach activation sooner.
Reduce friction and drop-offs with in-app guidance
Once you’ve identified areas of friction, you can make targeted interventions with in-app messaging to enhance the overall user experience.
Let’s look at an example. Say your CRO analytics show you that after clicking on a checklist item, a user doesn’t engage with a particular feature on your e-commerce site. You’ll want to address that urgently: an interactive walkthrough might be a good option for boosting engagement.
CRO tools to help you increase conversions
Luckily don’t have to choose from just one CRO tool. Let’s look at some of the best options out there!
Userpilot – best for tracking and acting on behavioral data inside the app
Userpilot is a product growth platform that allows you to harness user data to drive customer engagement and product adoption through behavior-triggered experiences.
- Range of functionality. It is a cloud-based platform that enables the creation, management, and A/B testing of custom flows, targeting of user segments, extensive customization of the user interface (UI), goal setting and tracking, powerful analytics, and more.
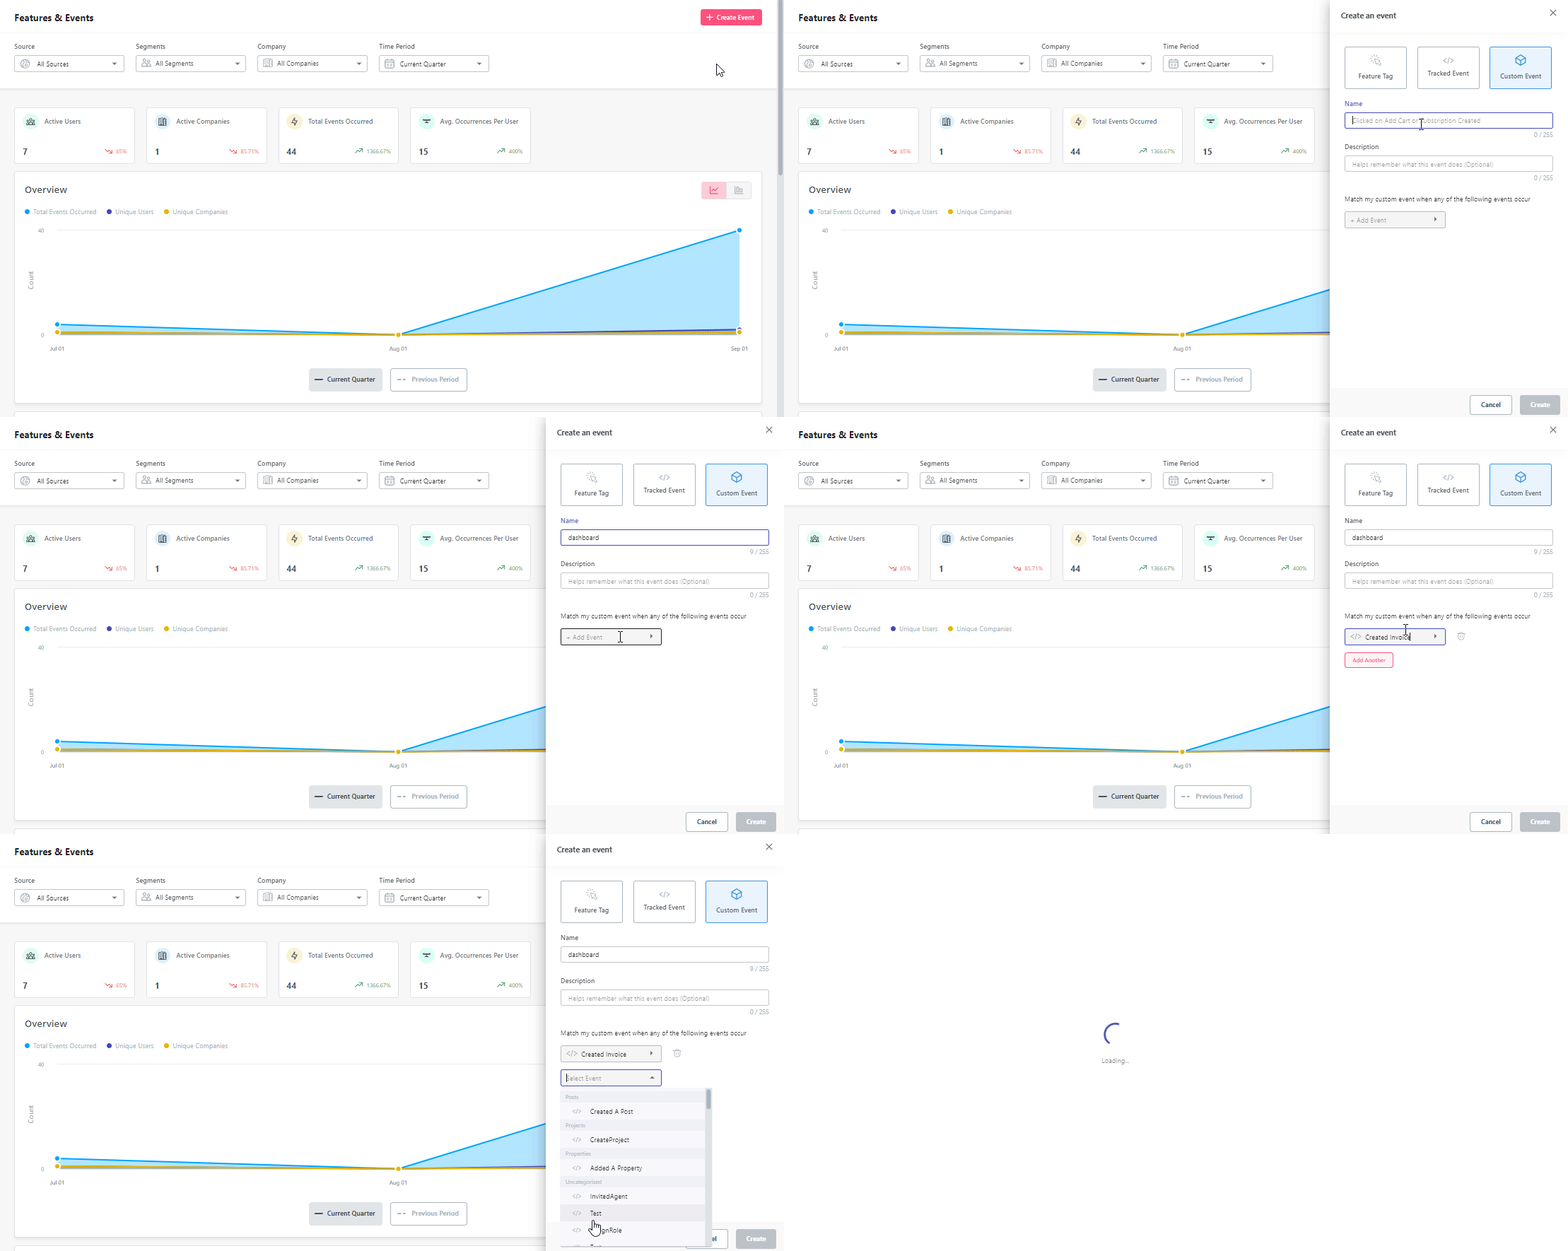
- Custom events. Another key feature is the ability to monitor custom events to track customer interactions and conversions across the funnel.
- Segmentation. You can also create and monitor sophisticated segments based on in-app behavior.

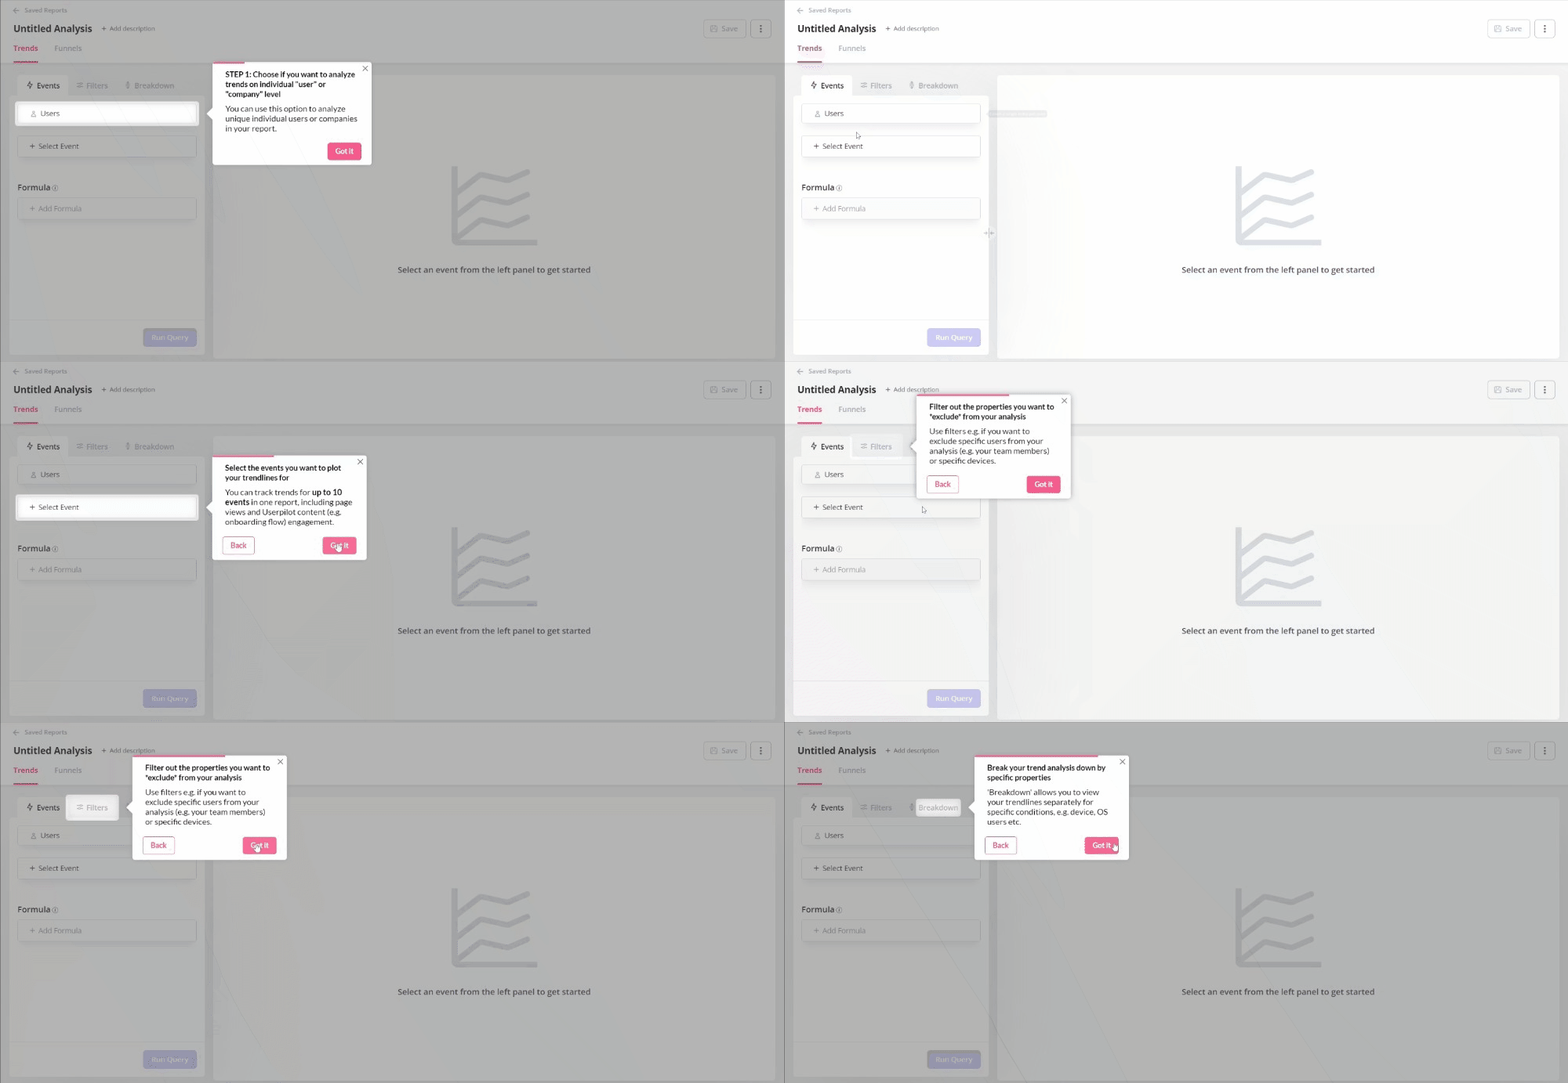
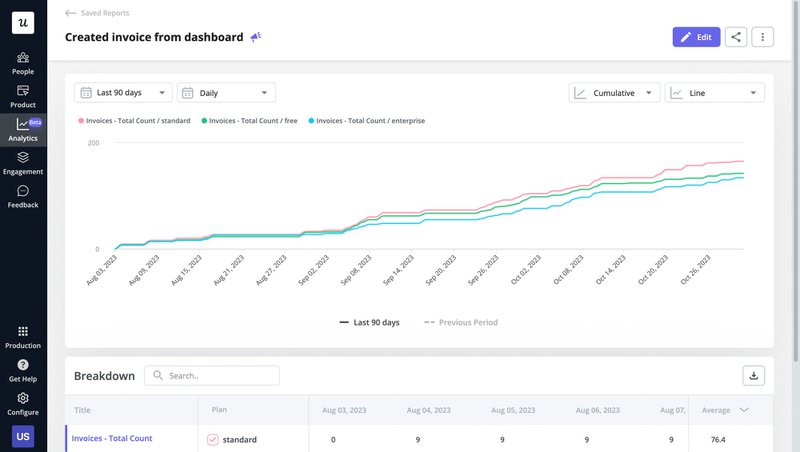
- Custom reporting. There are many options to create custom reports that help you unpack underlying trends and patterns in user data. For example, the trends dashboard helps you see what brings value for users on different plans.
Google Analytics – best for tracking your site’s conversion rate
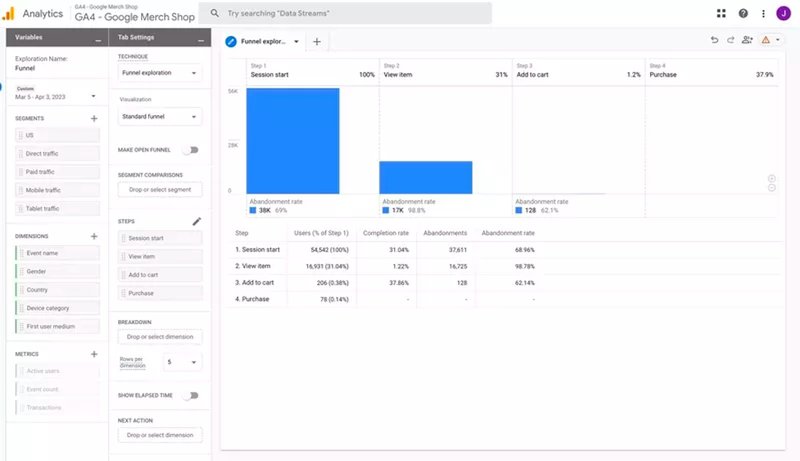
Google Analytics is a web analytics service that tracks and reports website traffic. It is a ubiquitous tool in the world of analytics and is frequently used by organizations large and small to track their app’s performance and to identify opportunities for improvement. Key features include:
- Traffic tracking: Google Analytics tracks the number of visitors to a website, the pages they visit, and the actions they take.
- Conversion tracking: Google Analytics can track conversions, such as purchases, sign-ups, and downloads.
- Audience segmentation: Segment your audience based on a variety of factors, such as demographics, interests, and behavior. This information can be used to create targeted marketing campaigns.
Hotjar – best qualitative data analysis
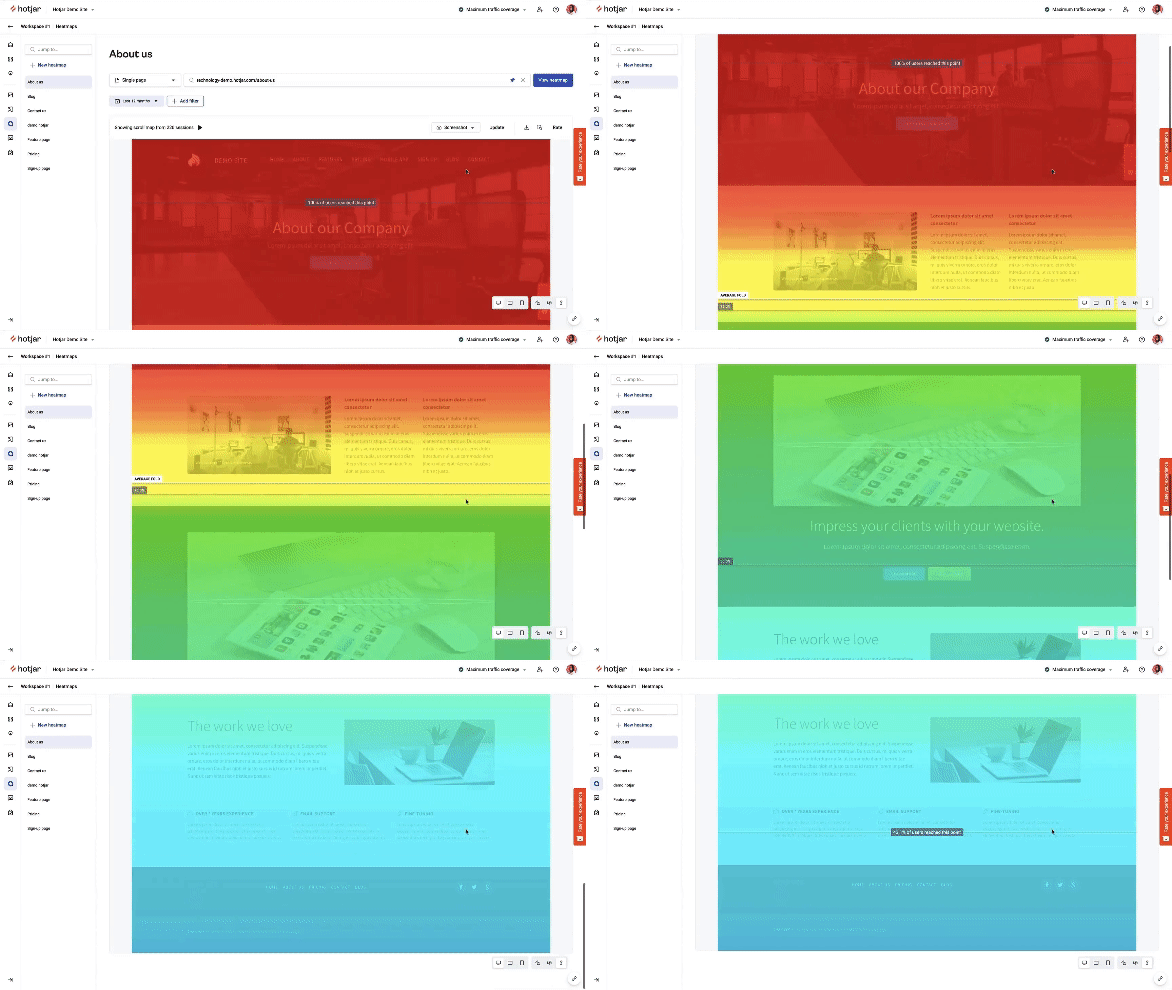
Hotjar is a behavior analytics and feedback platform that helps businesses understand how users interact with their products and services. It provides a variety of features, including:
- Heatmaps: See where users are clicking, scrolling, and hovering on your website. This information can be used to identify areas of your website that are engaging and areas of friction.
- Session recordings: Session recordings help identify specific problems that users are having and generate insights into their thought processes.
- Surveys and feedback: Hotjar’s key functionality is all around capturing and analyzing qualitative data. Collect user feedback about their experience with your product, which you can then use to improve your website’s design, content, and functionality.
Optimizely – best for marketing campaign optimization
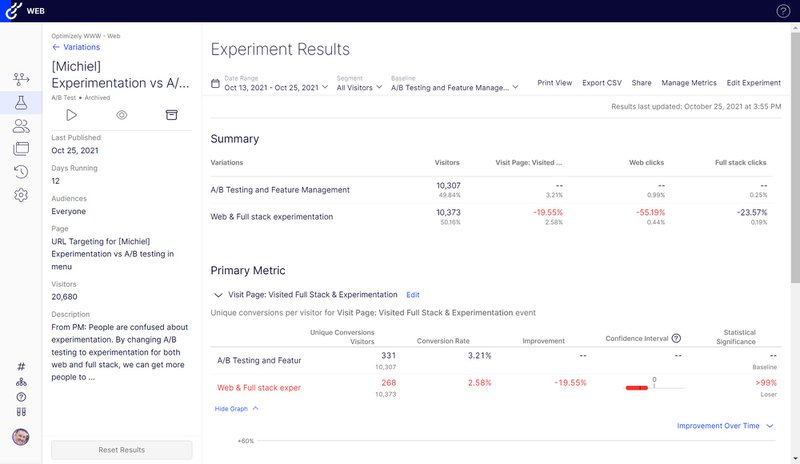
Optimizely is a platform that offers a whole host of testing tools for their websites and digital experiences. Optimizely’s platform includes tools for A/B testing, personalization, and more – but campaign optimization is the key selling point here.
- Content management allows businesses to create, publish, and organize their digital content to create compelling campaigns that drive conversions.
- Feature management allows businesses to control which features are available to users and when they are available. This can be used to roll out new features incrementally or target specific features to specific users.
- A/B testing allows businesses to test different versions of their website, marketing campaigns, or digital experience to see which version performs better. This can be used to improve conversion rates, increase engagement, and reduce bounce rates.
Conclusion
We’ve covered a lot of ground!
Hopefully, you now have a rock-solid understanding of what conversion rate optimization analytics are all about: what they are, how you can leverage them to generate insights in your product to drive growth, and how to choose the right tool for it.
Want to learn more about Userpilot’s CRO analytics capabilities? Book a demo call with our team to learn how exactly Userpilot can help you with your conversion rate optimization efforts.


