5 Assumptions Behind Retention Curves That AI Products Are Breaking in 2026


I checked a retention curve last month that looked completely healthy. Day 30 retention hit the benchmark, and the curve flattened right on schedule.
Three weeks later, I found out that half the cohort had opened the product exactly once and never came back. So, was the retention curve wrong all along?
Far from it. But the way I was reading it was.
AI has changed how users discover, adopt, and interact with products. As a result, some of the assumptions we, product folks, have relied on for years to interpret retention curves no longer hold.
In this article, I discuss five specific assumptions AI products are changing and how to read your retention curves with the right context.

Assumption #1: The first week’s retention reflects product quality
Not anymore!
Today, the first week tells you more about who showed up than how good your SaaS product is. That’s because AI has made trying new products almost effortless.
Users can sign up, generate a result, satisfy their curiosity, and leave within minutes. Yet, they sit in the same Day 0–7 cohort as users with a genuine long-term use case. This makes early retention much noisier than it used to be.
And this pattern is becoming common across AI product launches. Recently, a founder shared that their product attracted 5,000 signups in less than five days. Yet, only a small fraction became paying customers.
Santiago Rodriguez and Alex Immerman, partners at Andreessen Horowitz, call this the “AI tourist wave.” In their research, they found that these users (AI tourists) churn hard between Weeks 2 and 5. And they drag down early retention even when the core user base is healthy.
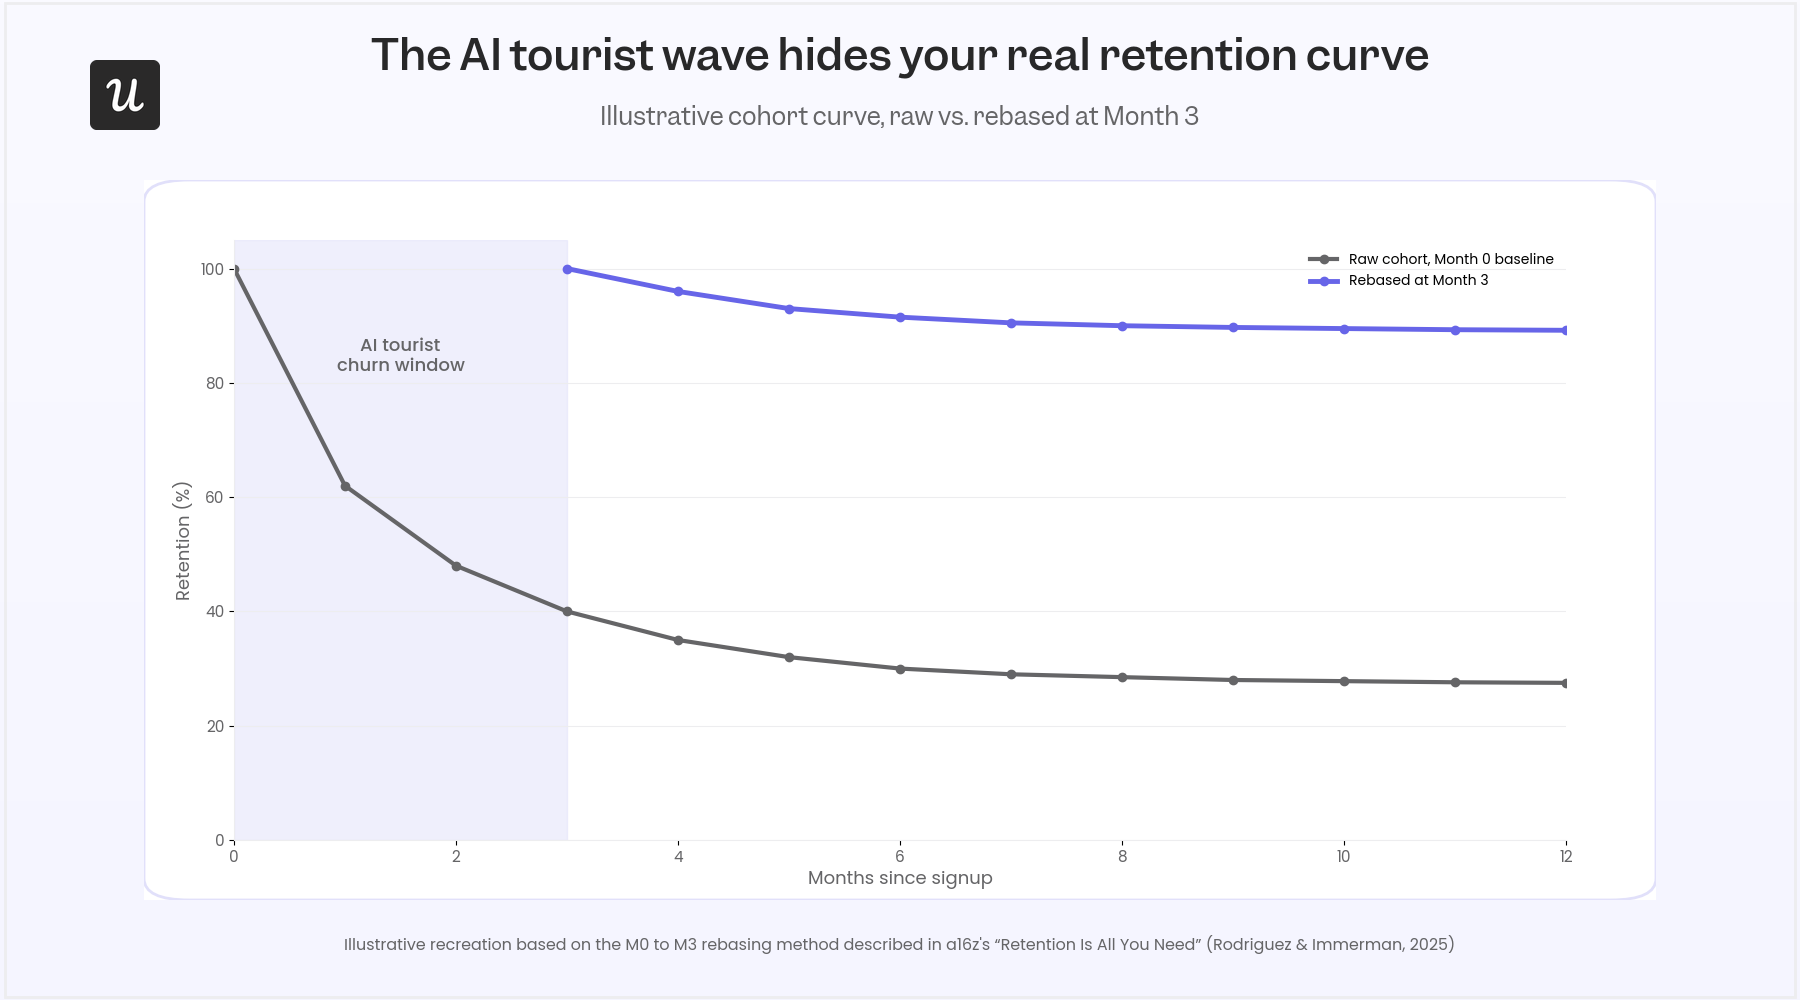
So, what’s the right way to interpret first-week retention?
- Define activation around an AI-specific value moment. This could be generating a first output or completing a workflow. Don’t stick to just logging in.
- Expect a noisier Day 0–7 retention curve than pre-AI benchmarks. Don’t treat it as an onboarding failure by default.
- Judge product quality by where the curve stabilizes, not by how steeply it falls in the first week.
Assumption #2: A single retention percentage tells you whether a cohort is healthy
Once you’ve accounted for the AI tourist wave, the focus should be on how soon your retention curve stabilizes. For instance, two products can report the same Month 1 retention:
- One may have lost a large wave of curious users before settling into a loyal customer base.
- The other may still be losing users steadily every month.
The retention percentage will be identical, whereas the health status will differ.
Santiago and Alex found the same pattern in their research (the same research in Assumption #1). Among AI companies that surpassed $1M in ARR, the strongest performers were those whose cohorts stabilized early. They continued to retain customers over time, producing Net Dollar Retention above 100%.
So, instead of focusing on a single, terminal retention percentage, track:
- How quickly each cohort reaches a plateau.
- Whether newer cohorts stabilize faster than older ones.
- Whether retention after the plateau is improving over time.
Assumption #3: More sessions mean stronger retention
In the AI era, session frequency measures engagement, whereas retention measures dependence. For example:
- Session frequency: A user logs in every day but never touches a feature.
- Dependence: A user opens your product twice a week to consistently solve a problem.
The retention curves of leading AI products align with the second. ChatGPT, for example, no longer behaves like traditional consumer apps.
OfficeChai says it’s becoming an infrastructure. In other words, users reach for it whenever they have a problem, like typical search engines. And as users discover more use cases over time, dependence grows, even if usage isn’t driven by a fixed daily routine.
So, don’t assume more sessions mean stronger retention. Do these instead:
- Track outcomes reached per session; don’t stop at just session count.
- Ask which product a user reaches for first when the problem shows up, just as much as you ask how often they open yours.
- Cross-reference frequency against feature depth before calling an account healthy
Assumption #4: Only human logins create retention
AI agents are beginning to do work that previously required humans to log in. As a result, fewer human sessions no longer mean lower product value.
And I’ve seen this firsthand, leading Customer Success at Userpilot.
Earlier this year, one account looked healthy for months. We saw steady activity, consistent feature usage, and regular workflows. But when we reached out, we discovered that no human had logged in since January. An AI agent had been running reporting workflows through the API the entire time.
The account was still getting value. It just wasn’t coming from human sessions.
Brian Balfour points to Intercom’s AI support agent, Fin, as another example of this shift. Fin now resolves more than one million support tickets every week, and Intercom charges per ticket resolved rather than per seat. In that model, retention is measured by outcomes delivered, not by how many people log in.
The takeaway? AI products need two retention curves. One for human engagement and another for AI-driven outcomes.
So, track both separately:
- Human retention: Measure it through logins, feature adoption, and workflow completion.
- Agent retention: Measure it through task completion, workflow execution, and successful API calls.
We built Userpilot’s Agent Analytics for this reality. It monitors human engagement alongside agent activity, activation lift, and failure signals. This way, your team gets a complete picture and stops treating every interaction as the same kind of usage.
Assumption #5: A smile curve always means users are becoming more engaged
Not necessarily!
For years, a smile-shaped retention curve meant users were naturally expanding their usage. In other words, they adopted more features. They built stronger habits or rolled the product out across their team.
Now, AI products have introduced another explanation: the product keeps getting better. and OfficeChai’s data (referenced in Assumption #3) paints a perfect picture:
Over a 24-month period, ChatGPT climbed from roughly 37% Month 1 retention to more than 70% by Month 24. Reacting to the chart, Garry Tan, Y Combinator CEO, remarked:
“Does a hype cycle have a retention curve that looks like this? Literally never seen a retention cohort graph like this.”
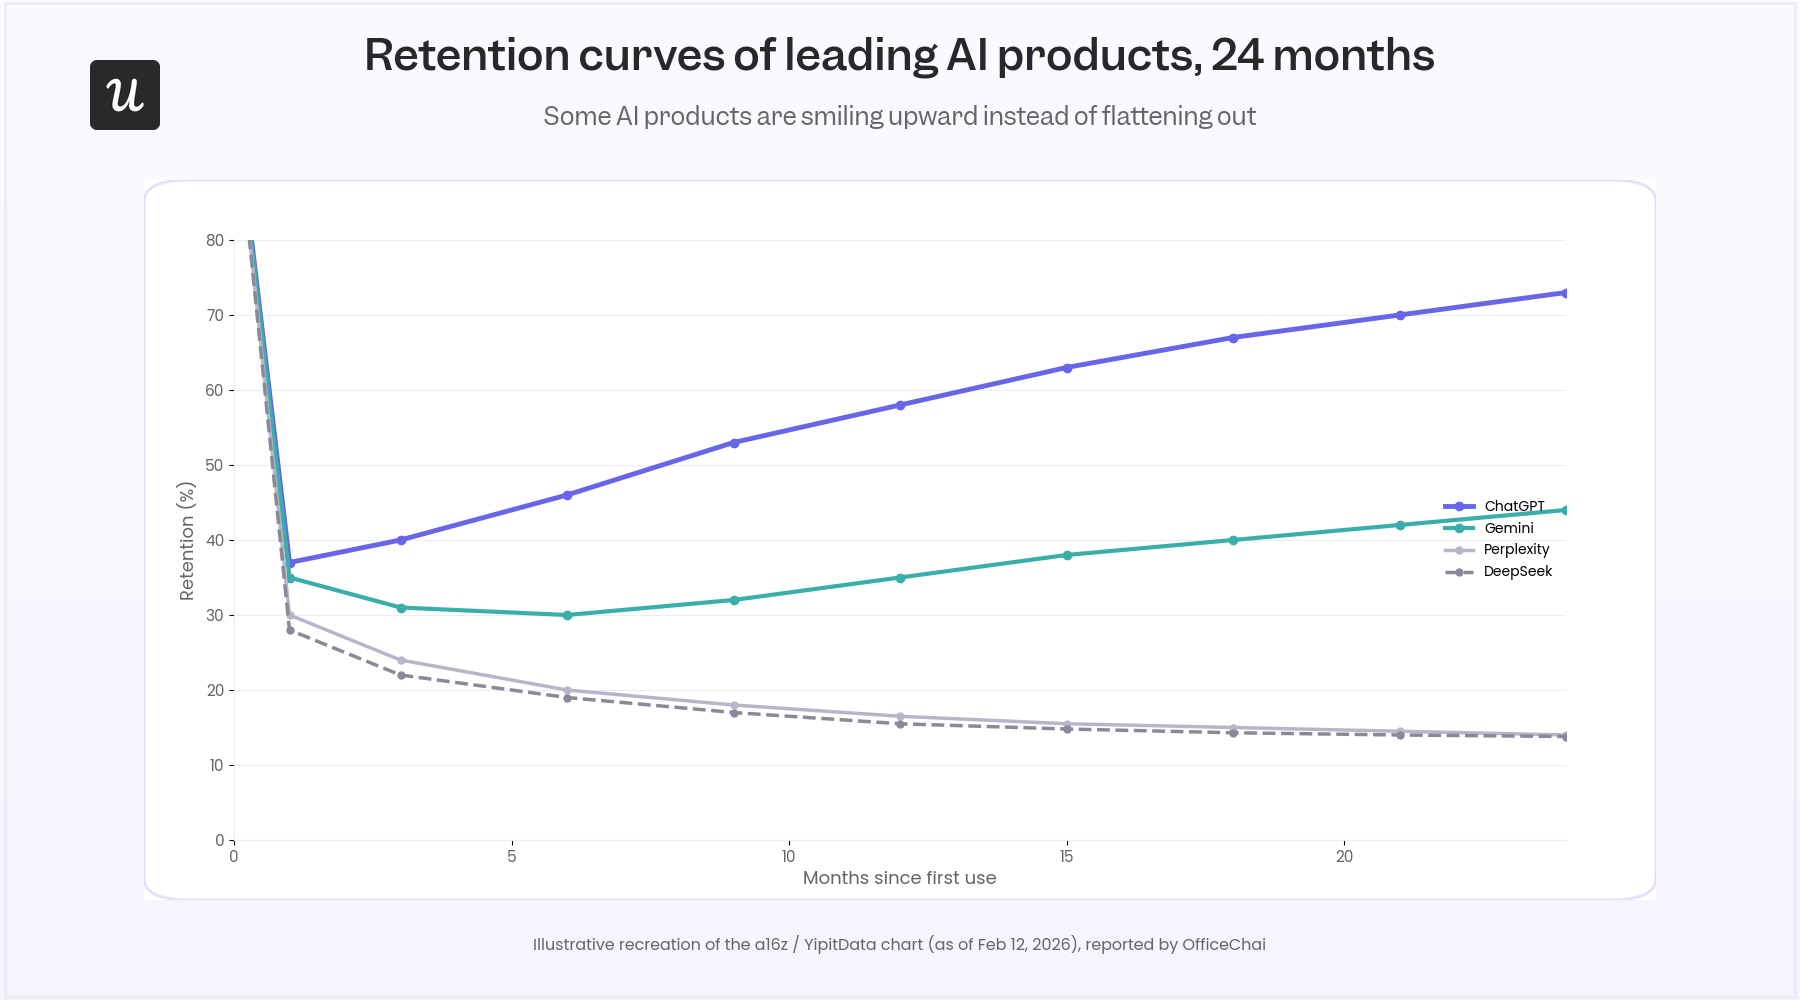
Gemini showed a similar, though smaller, recovery. It dipped to around 35% early before recovering to roughly 44%.
What’s remarkable is that users didn’t suddenly buy more seats or change plans. The products themselves became dramatically more capable. This gave existing users new reasons to return and new jobs to solve.
So, before assuming a smile curve means users are becoming more engaged, ask what actually caused it.
Ask these questions:
- Did retention improve after a major product release?
- Are previously inactive users returning because of new capabilities?
- Is the growth coming from better product value rather than pricing or expansion?
The retention curve didn’t break. Our interpretation did.
The five assumptions in this article weren’t wrong. They only reflected how products worked when retention depended almost entirely on humans returning to the app.
However, AI has changed that.
Today, users arrive with different intentions. Products are evolving. AI agents are generating value without creating the behavioral signals we’ve relied on for years. All these resulted in the questions we must ask of retention curves.
Now, we must replace “What’s my Day 30 retention?” with:
- Where does the curve stabilize?
- Are users reaching lasting value?
- Is progress improving across cohorts?
- Who is creating the value: humans, AI agents, or both?
This is how we move from measuring activity to understanding retention.
Userpilot’s AI agent, Lia, makes the shift seamless. First, it monitors activation, adoption, and retention across every account. Then, it identifies the behavior patterns that predict long-term success. Ultimately, it surfaces churn risks before they appear in the retention curve.
Don’t wait for dashboards, book a demo today to understand what’s happening with your retention!
FAQ
What is a good retention curve?
There isn’t a universal “good” retention curve. A healthy curve is one that stabilizes after the initial drop rather than continuing to decline indefinitely.
Why do retention curves drop so sharply at the beginning?
Early churn is normal. In 2026, it’s even more pronounced because AI products attract large numbers of curious users (“AI tourists”). These users who sign up, explore the product once, and leave.
What's the difference between a retention curve and cohort analysis?
A retention curve visualizes how a cohort of users is retained over time. Cohort analysis is the broader method of grouping users. This could be by signup date, acquisition channel, feature adoption, or another characteristic. It compares how different groups retain. In practice, retention curves are one of the outputs of cohort analysis.
How often should you review retention curves?
I’ll say at least thrice: after every significant onboarding, pricing, and product change. Also, look at monthly cohorts. This way, you will know whether recent releases are improving long-term retention.
About the author