Product Feature Analysis in 2026: How to Measure Success with Human & Agent Users


How do you measure the success of a product feature? Ask ten PMs, and you’ll get ten answers on how they do product feature analysis.
It’s not a trivial question – especially at times when teams ship more features than ever (thanks, AI! 🙄) and more than users can possibly consume…
I’ll explain in this post how I actually do feature analysis at Userpilot, *but* updated for the two obvious shifts that are happening in tech as a result of AI (at the time of writing, in May 2026):
- Shipping velocity is outpacing your user attention – in simple words, our AI-assisted engineering teams are pushing out a lot more than our teams can consume.
- A meaningful share of your users are about to… stop being human.
These shifts mean both how often we do feature analysis and the metrics we are using to evaluate feature success need to change.
So I’ll cover:
- How to define the new feature unit now – differently for agents & human users!
- The layered metrics that beat HEART for feature-level analysis, how to measure features when half your users are AI agents, and the monthly + quarterly cadence I run with my team.
Quick version
If you only have time to read one section, read this one:
- Define what a “feature” means before you measure anything – there’s no objective “feature” unit on Earth 😉 A “feature” can be a screen, a workflow, a setting, or a sub-capability. Pick one definition and use it across your product team.
- Maintain two artifacts: a stable feature matrix for portfolio decisions, and a live feature catalog for event-level tracking. This is the methodological backbone of Olga Berezovsky’s framework, and it’s the single most useful structural change you can make.
- Measure features in layers:
- Exposure and eligibility.
- Adoption.
- Product usage frequency and usage depth.
- Retention and conversion.
- Monetization.
- Then composite “Aha!” patterns.The AARRR and HEART frameworks are useful umbrellas, but Paul Levchuk is right that they’re too high-level to judge a single feature.
- For agentic users, measure:
- Task completion.
- Intent resolution.
- Tool-call accuracy.
- And outcome quality. Click counts and session length will mislead you when the user is an AI agent calling APIs rather than clicking on buttons.
- After every feature analysis, you need to translate the outcome into an explicit decision:
- Build.
- Improve.
- Promote.
- Package.
- Or sunset the feature analyzed.
- Run a monthly operational review on live features and a quarterly strategic refresh on the portfolio. Annual feature reviews are dead – just like annual product roadmaps.

What “product feature analysis” actually means in 2026
Product feature analysis means evaluating individual features to understand their impact on user behavior, retention, monetization, and overall product value. This hasn’t changed.
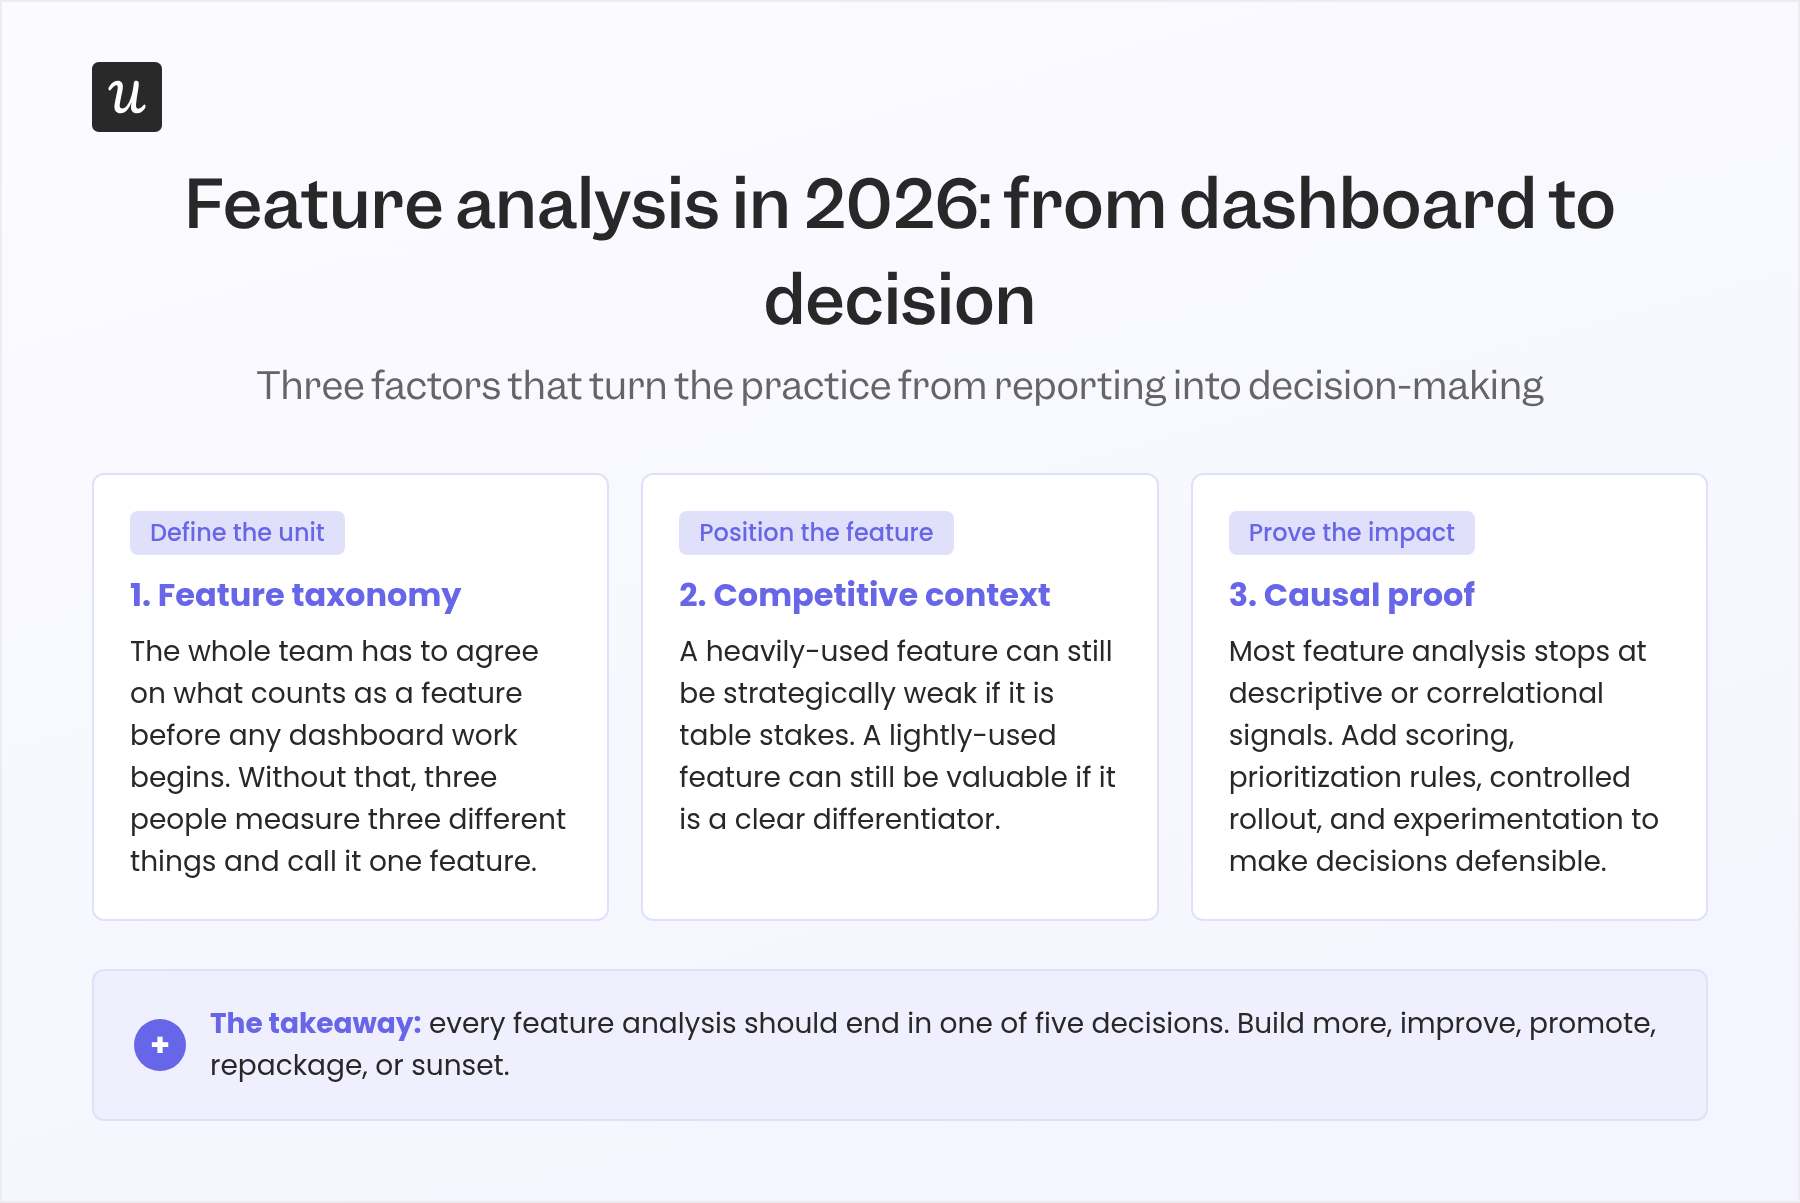
What’s changed is the output. Two years ago, feature analysis often ended in a dashboard. Now it has to end in a decision: build more of this, improve it, promote it harder, repackage it into a different tier, or sunset it.
You need a feature taxonomy so the whole team agrees on what counts as a “feature” before any dashboard work begins. Without that, three people on the same team will measure three different things and call it one feature.
Competitive context is the second factor you need to consider.
A heavily-used feature can still be strategically weak if it’s table stakes across the market, and a lightly-used feature can still be valuable if it’s a clear differentiator.
Causal proof is the third, and the one most often missing. Most feature analysis I’ve seen, including most of what ranks on Google for this query, stops at descriptive or correlational analysis. Pairing those signals with scoring, feature prioritization rules, controlled rollout, and experimentation is what turns the practice from reporting into decision-making.
Define the feature unit before you measure anything
This is the step most PMs skip, and it’s where most feature analyses break.
A “feature” inside the same product can mean any of these things: an entire value area (like “in-app messaging”), a specific workflow (like “scheduled in-app NPS survey“), a setting (like “send only to active users”), or a background capability (like “throttle if recipient was emailed in the last 7 days”). If three people on the team mean three different things by “the email feature”, the analysis is over before it starts.
The cleanest framework I’ve found for this comes from Olga Berezovsky’s guide. She separates two artifacts and uses both:
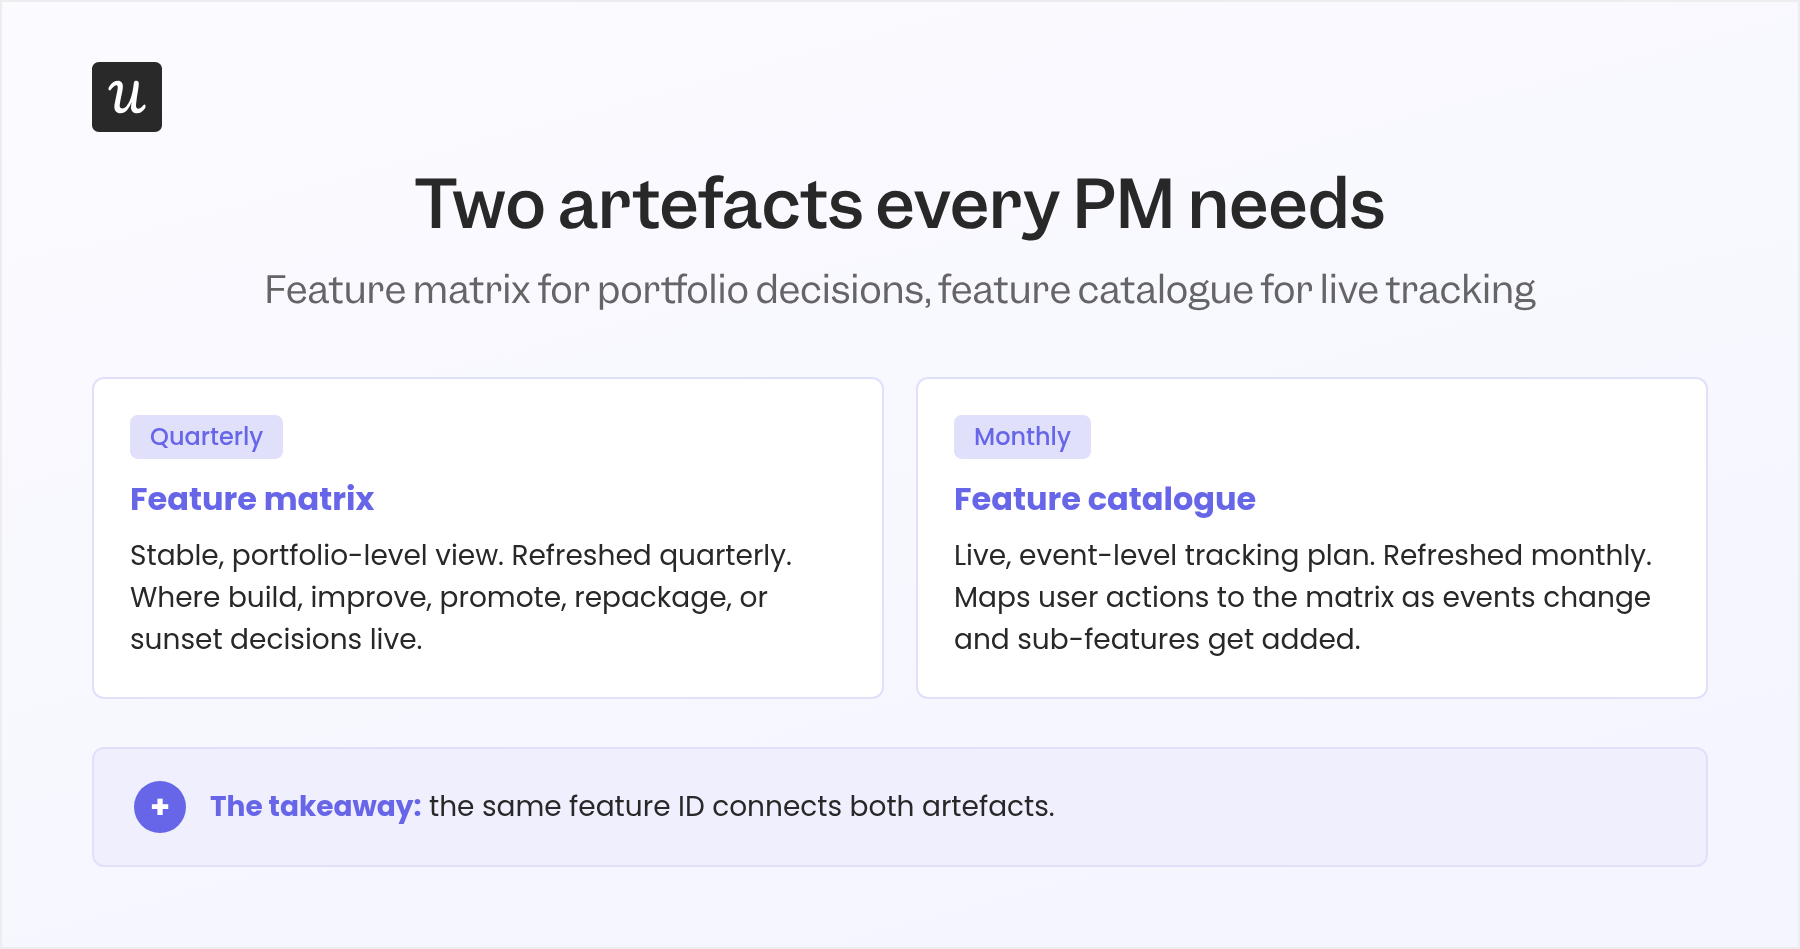
- The feature matrix: A relatively stable portfolio view that lists features at a consistent level of granularity. It’s where strategic decisions live (which area gets investment, which gets sunset).
- The feature catalog: A live, event-level tracking plan that maps user actions to the matrix. Events change, names get refactored, sub-features get added; the catalog tracks all of it.
The reason this two-artifact split matters is that without it, your strategy will collapse into either a vague feature list or a noisy mountain of raw events. Neither is useful. The matrix gives the leadership view, the catalog gives the engineering and analytics view, and the same feature ID connects them.
Before I tag a single event for a new feature on my team, I write down the feature unit definition (matrix entry) and which user-facing job it ties to. If I can’t write a one-sentence answer to “which user problem does this feature solve, and for which persona”, I’m not ready to tag anything.
The metrics that matter: Analyzing feature usage in 6 layers
HEART (Happiness, Engagement, Adoption, Retention, Task Success) is a fine umbrella framework, but Paul Levchuk’s critique in his Medium piece on measuring feature success is right: it’s too high-level for judging an individual feature.
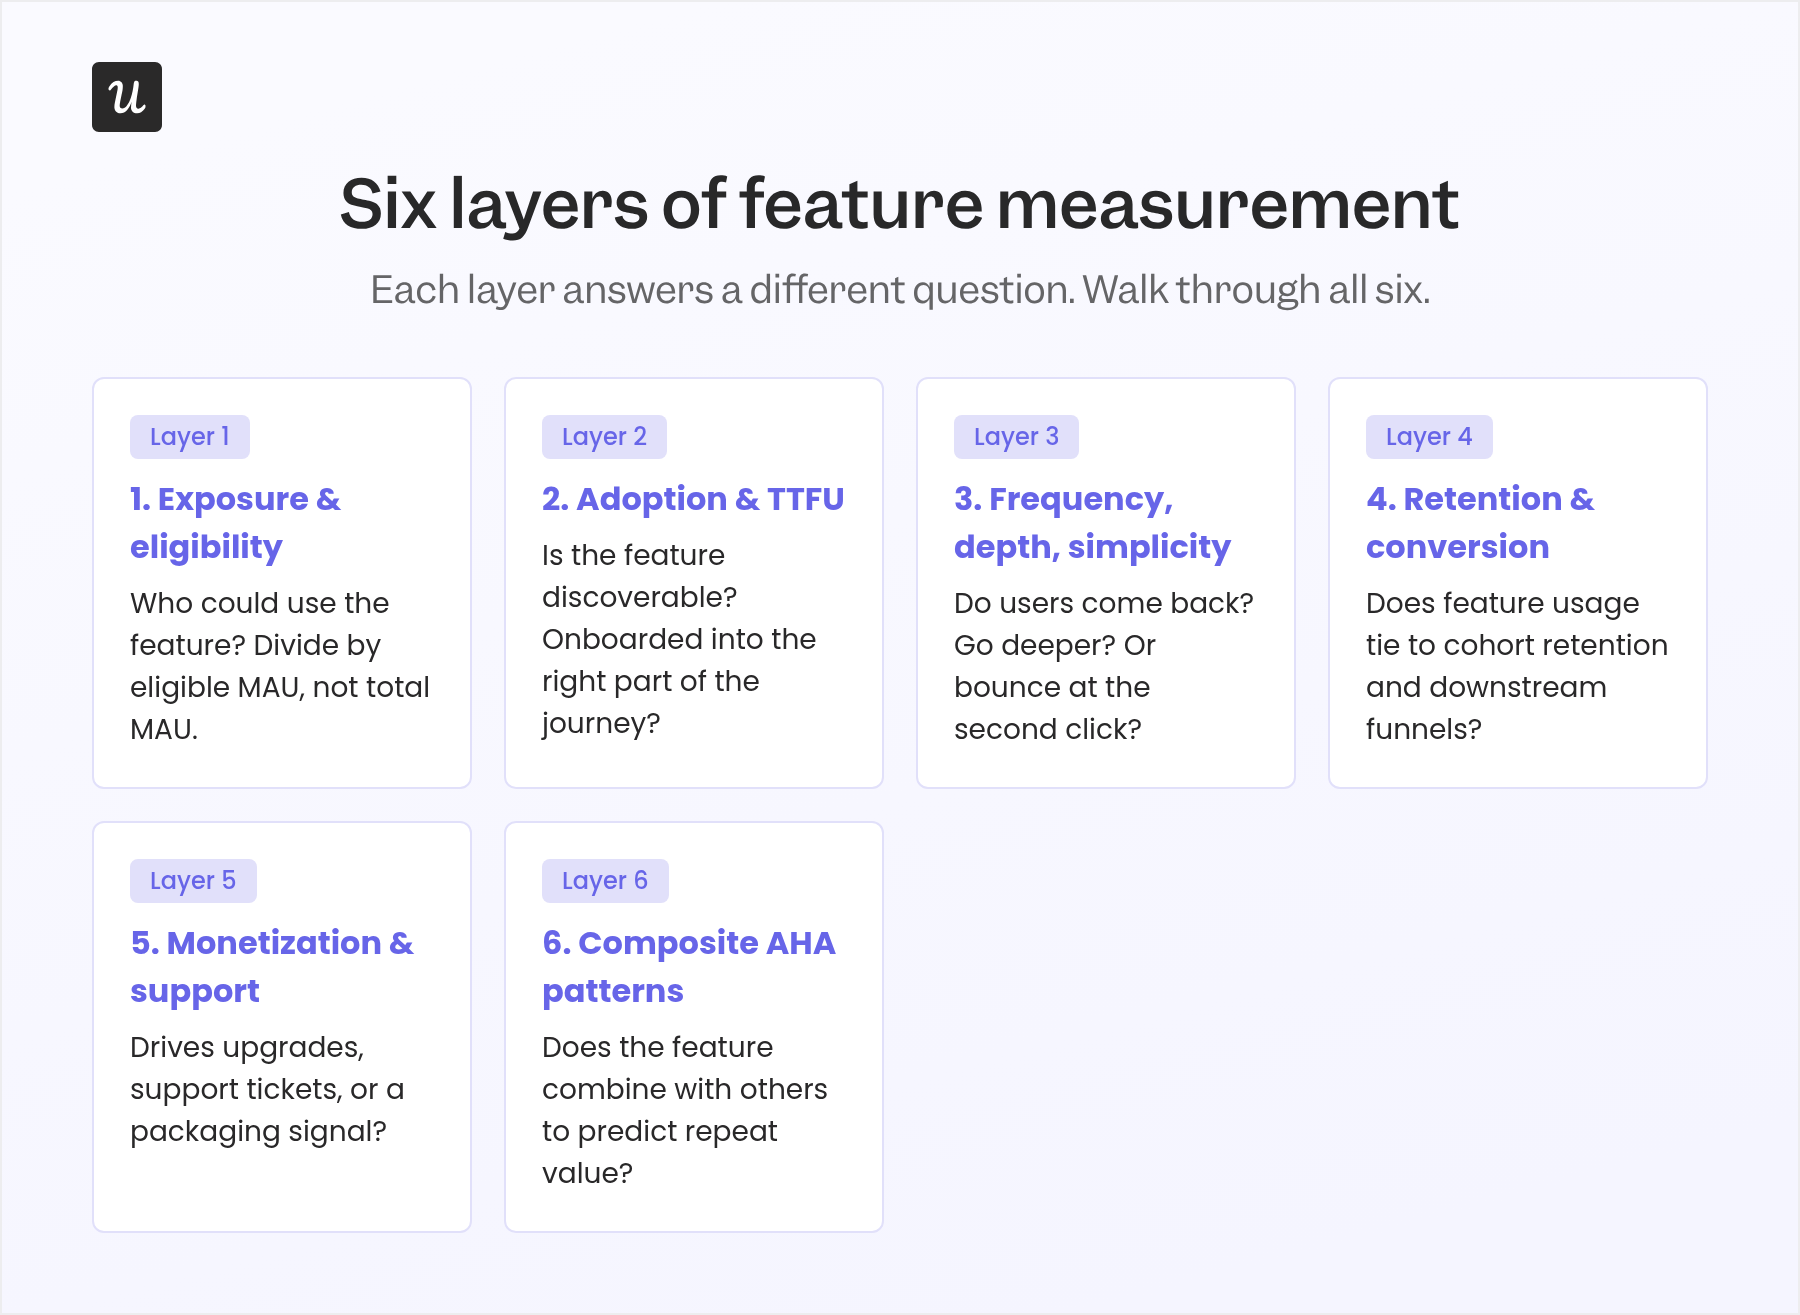
The version I use is layered, not flat. Each layer answers a different question, and the analysis only works if you walk through all six.
Layer 1: Exposure and eligibility
Measure who could use a feature before measuring who did. Paid features, region-locked features, role-based features, and gated features will all look artificially weak if you divide adoption by total MAU instead of eligible MAU.
This is the single biggest fix I made to my own Userpilot product analytics dashboards last year.
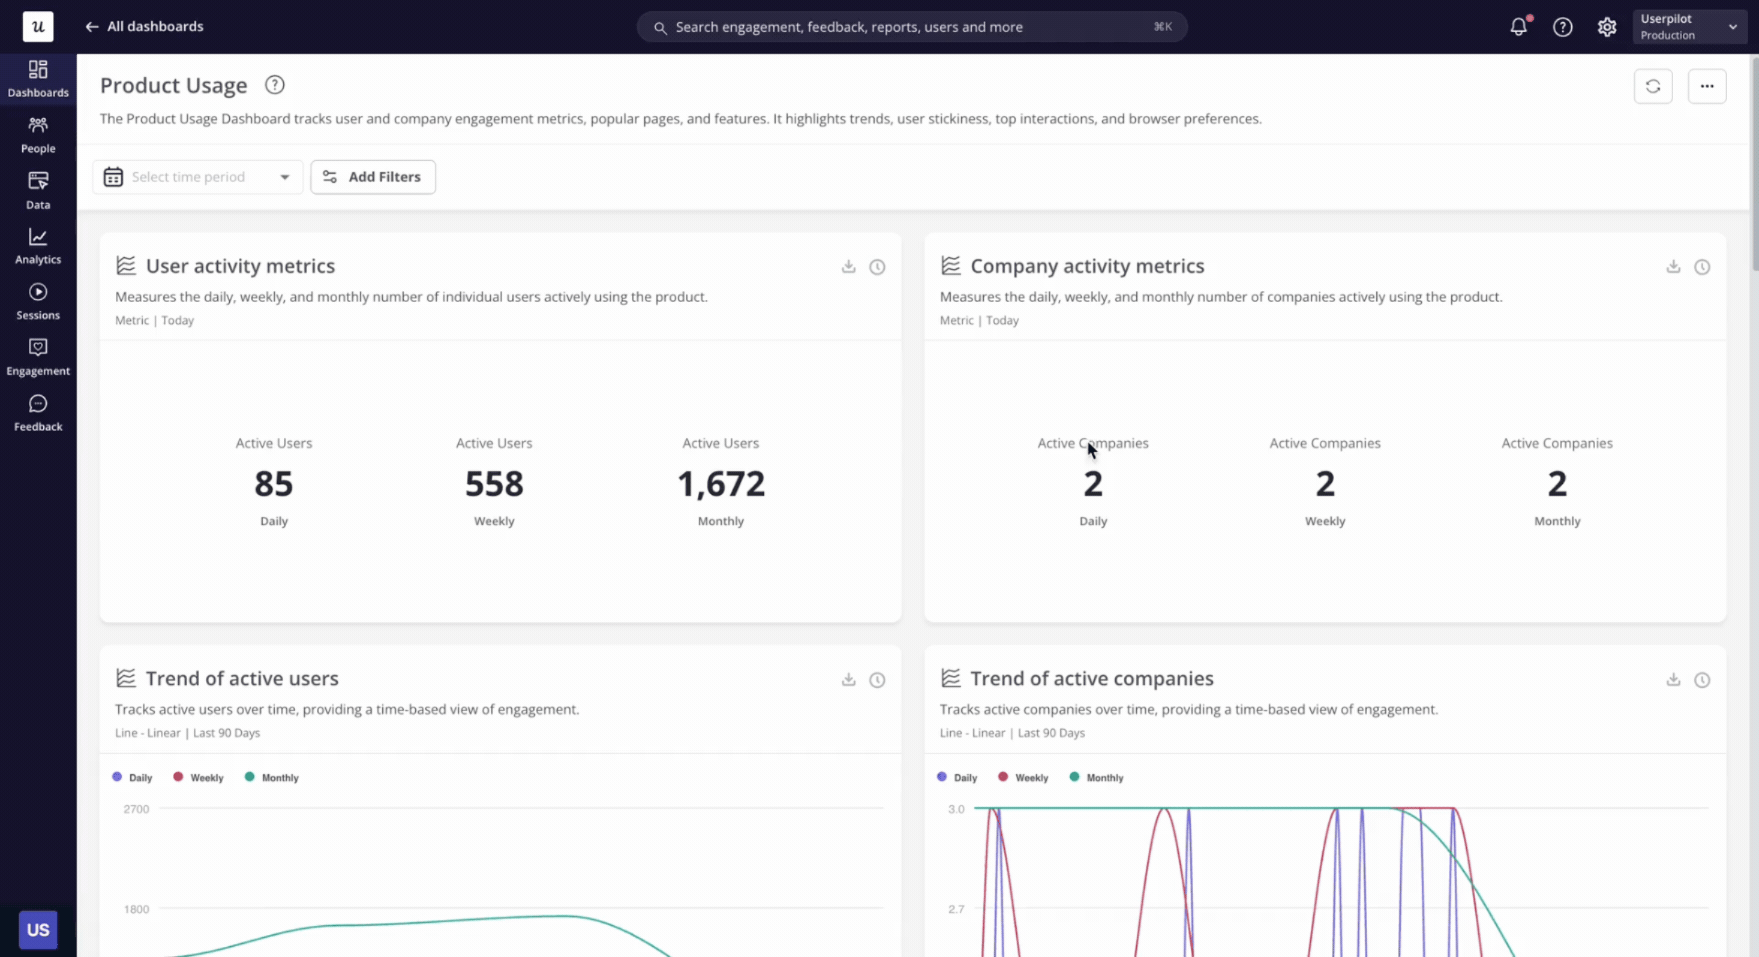
The “adoption rate” of our scheduled-send feature went from 11% to 47% the moment I switched the denominator to “users on a plan that includes scheduled send.”
Layer 2: Adoption and time to first use
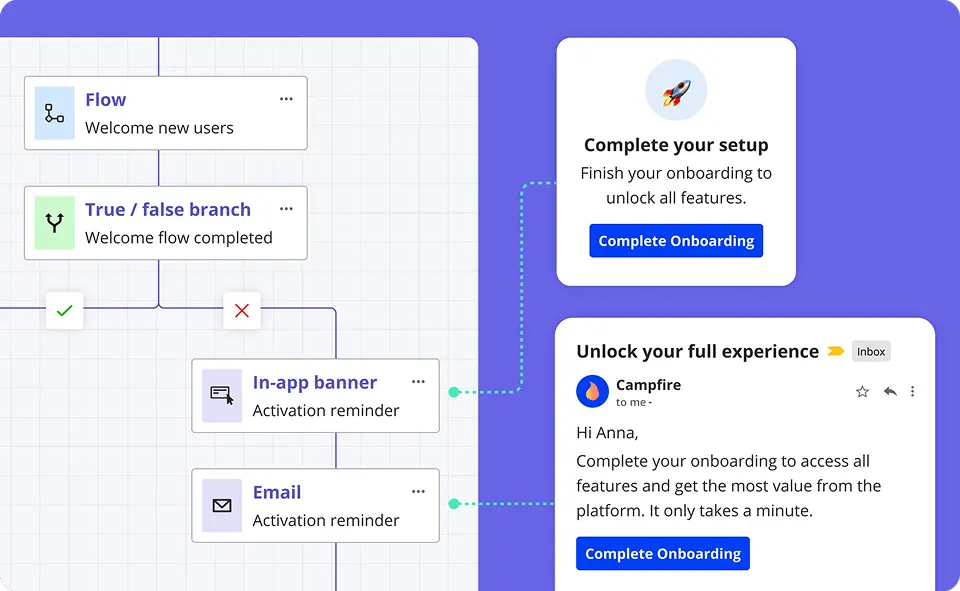
These two feature adoption metrics tell you whether the feature is discoverable and onboarded into the right part of the journey. A strong feature that’s hidden behind a third-level menu often looks like a weak feature in raw adoption numbers.
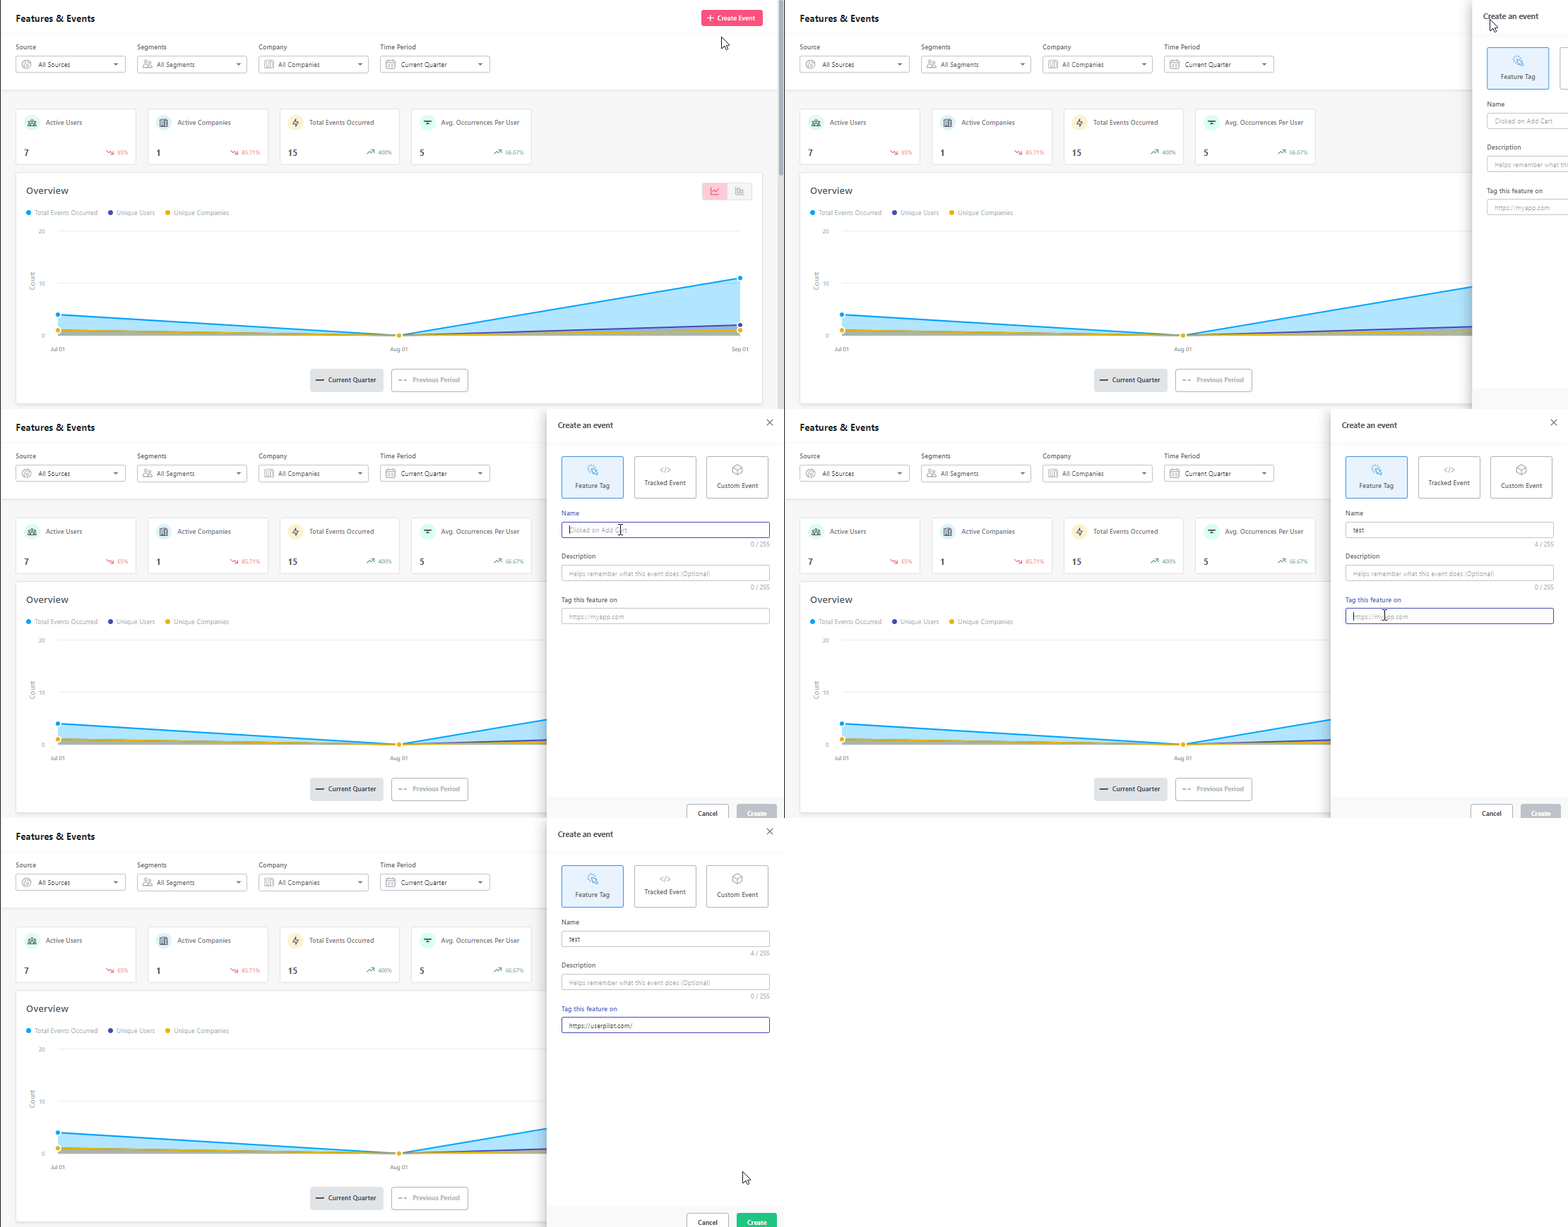
If time-to-first-use is long, the fix is rarely in engineering. The fix is usually in-app guidance, contextual nudges, or a checklist that surfaces the feature at the right moment (in-app user engagement is something Userpilot offers out of the box as well):
Layer 3: Frequency, depth, and simplicity
One-time users tell you a feature is discoverable. Returning users tell you it’s valuable.
Users who go deeper than the surface (apply filters, customize outputs, use the feature in combination with others) tell you it’s habit-forming.
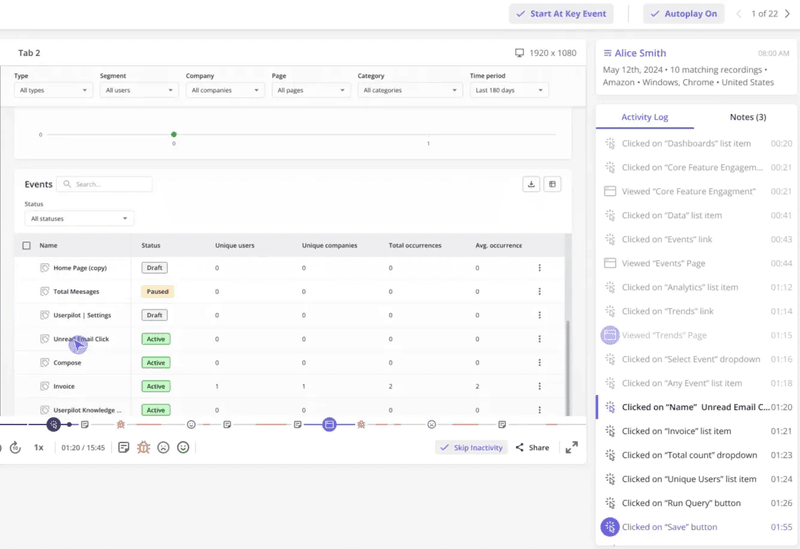
Simplicity matters as much as depth. If your power users go deep but average users bounce off the second click, the feature is gated by complexity, not value.
You can get a good grasp of your feature usage frequency, depth, and simplicity by watching session replays (also available at Userpilot):
Layer 4: Retention, conversion, and behavioral context
This is where most feature analysis jumps straight from “lots of clicks” to “good feature.” The honest version connects feature usage to cohort retention analysis and conversion funnels. What did users do immediately before this feature, and what did they do after?
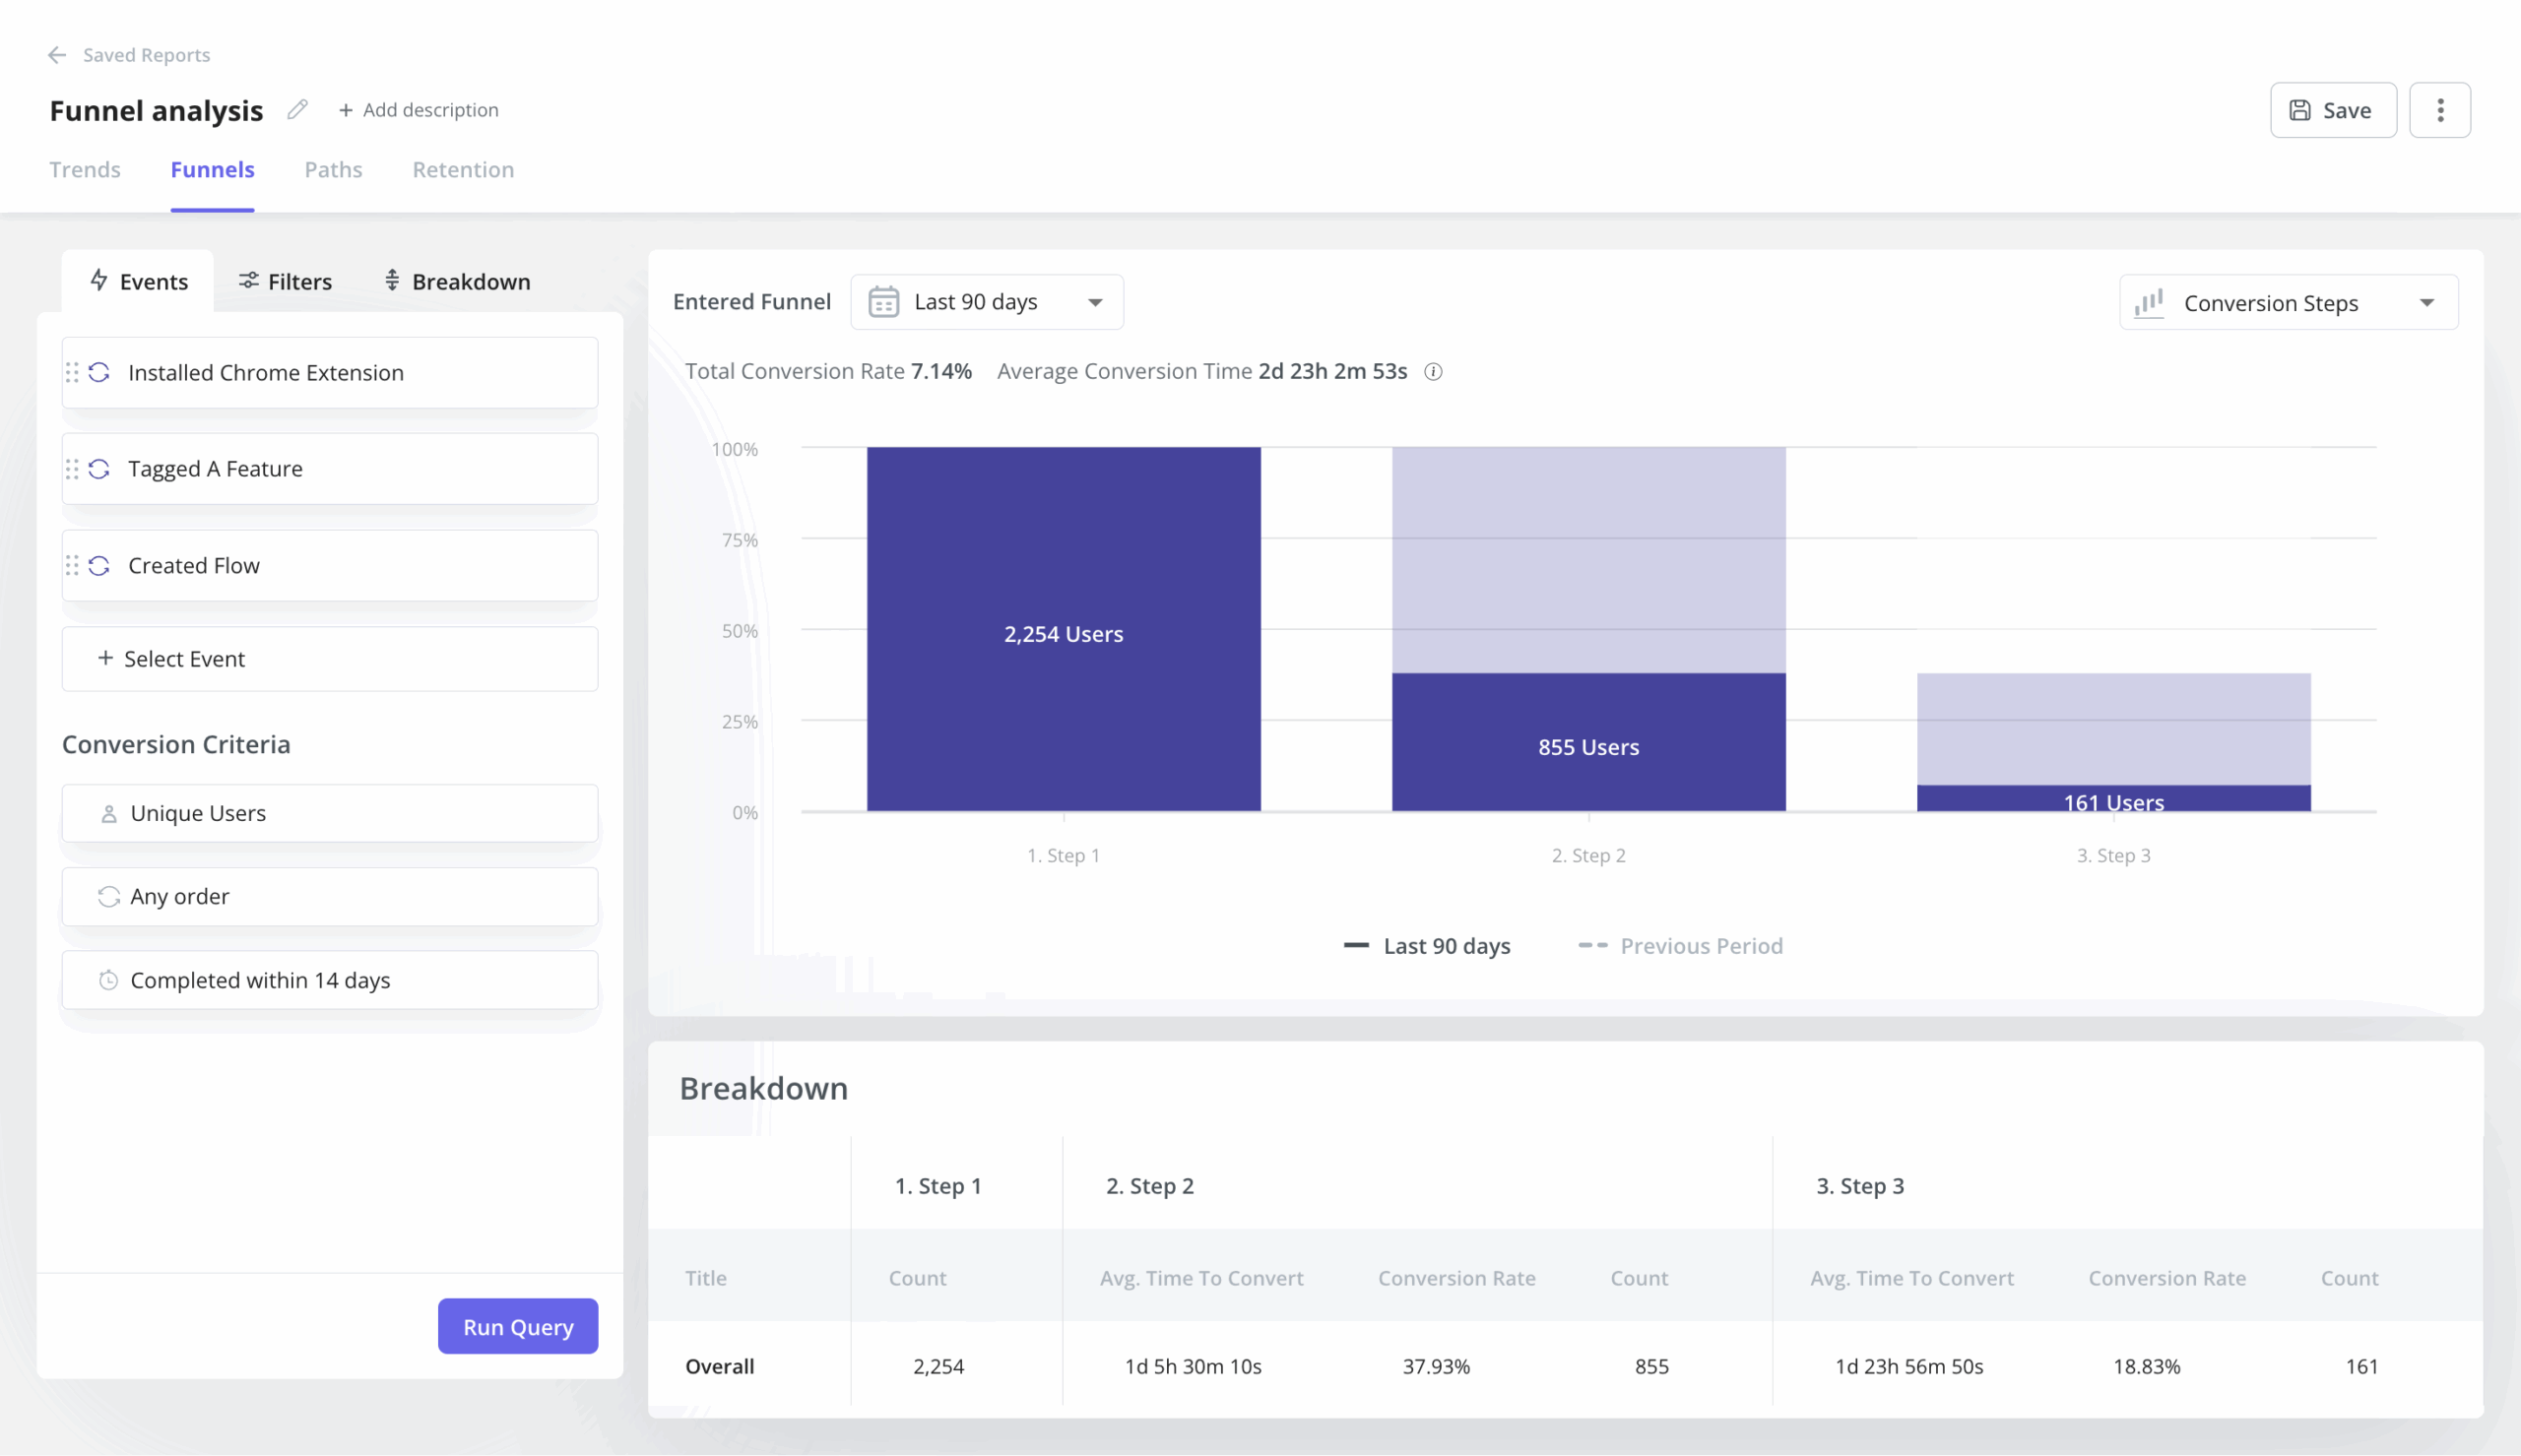
The Human37 framework is useful here. Product value often emerges from combinations of behaviors that create an “Aha!” moment, not from isolated clicks on a single feature.
Layer 5: Monetization, pricing, and support burden
Features carry costs as well as value. A feature that drives upgrades is different from a feature that drives support tickets, and a feature that’s heavily used by free users but never by paying ones is a packaging signal worth treating seriously.
So you should monitor the feature usage by plan:
Layer 6: Composite behaviors and AHA patterns
The best feature is sometimes not a feature. It’s a sequence of behaviors that, together, predict repeat value. Feature analysis should include behavior bundles, not just isolated modules.
Treat any observed lift in retention or conversion as directional until you’ve tested it more rigorously – e.g., with A/B testing:
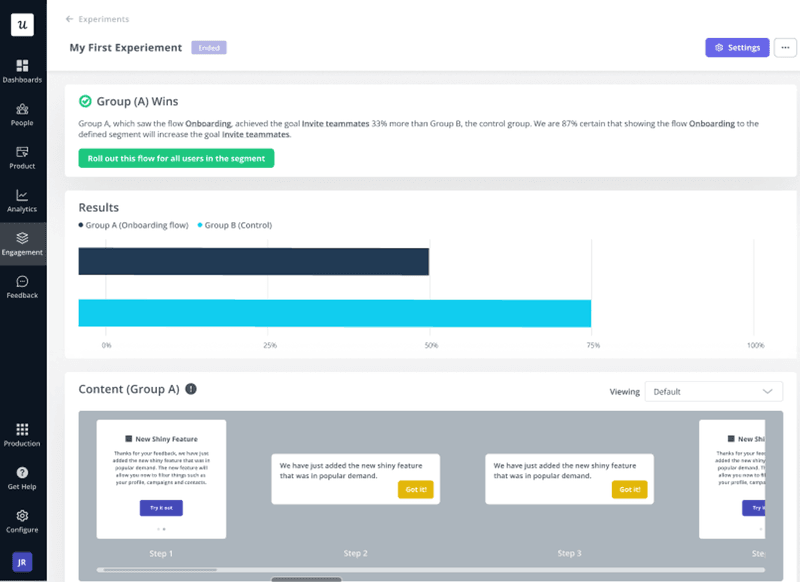
The descriptive layer tells you where to look. Experiments tell you whether you were right.
Again, the A/B testing inside Userpilot allows you to run controlled feature experimentation.
How to measure features when half your users are AI agents
The way you should do feature analysis changes when Agentic users enter the game, as we previously mentioned in our product strategy post.
Several of the six layers of feature analysis we discussed above either break or need replacing once a meaningful share of your users are AI agents.
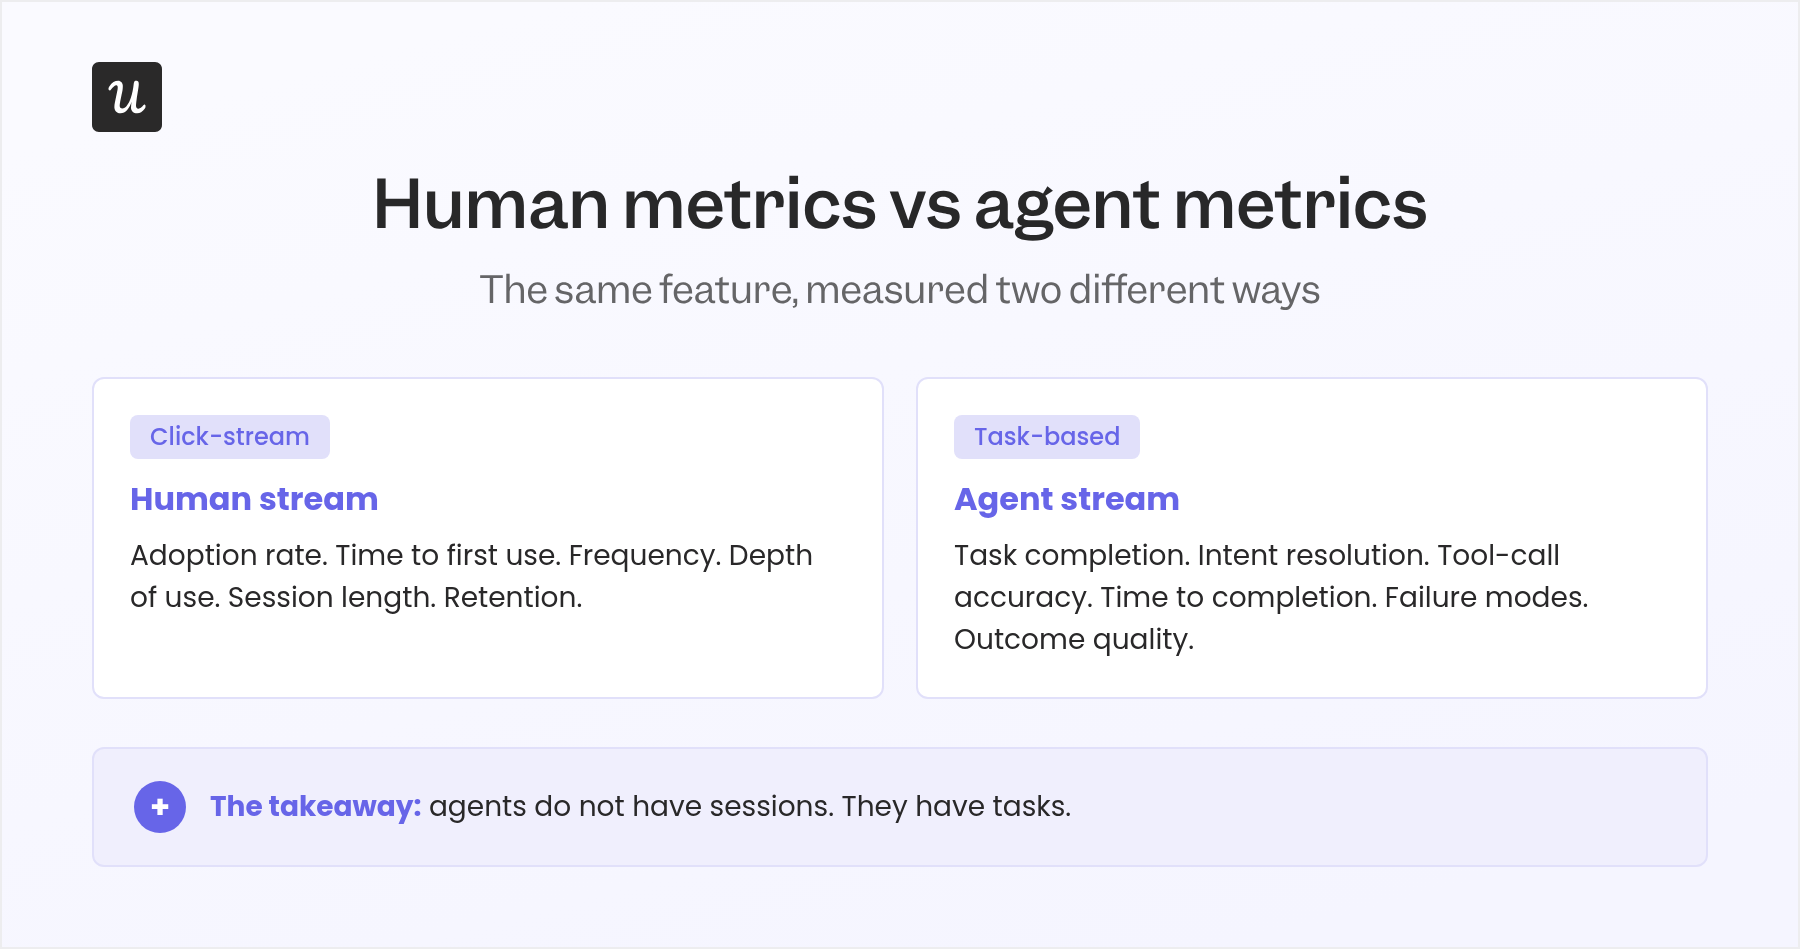
An agent doesn’t have a session, only a task.
Click-stream events, which are the foundation of adoption and frequency metrics, mostly don’t apply.
By the end of 2026, Gartner expects 40% of enterprise applications to ship task-specific AI agents.
For agent traffic, the metrics that actually predict feature success are these:
- Task completion rate: Of the agent calls into a given feature, what share completed the intended task end-to-end?
- Time to completion: How quickly did the agent finish, and how does that compare across versions of the feature?
- Intent resolution: Did the agent understand what the user was asking for in the first place? An agent that completes the wrong task is failing.
- Tool-call accuracy and tool-input accuracy: If your feature is exposed via an MCP server or an API, did the agent pick the right tool, with the right parameters?
- Failure-mode breakdown: When the agent failed, was it a missing capability, a permissions issue, an authentication problem, or a data-shape mismatch?
- Outcome quality: Of the tasks marked complete, what share actually delivered the human-intended outcome?
For features that are AI, a second layer matters: Evals.
Since generative outputs are variable, traditional test methods aren’t going to be enough.
Teams that take this seriously build traces, graders, datasets, and repeatable eval runs into their release process.
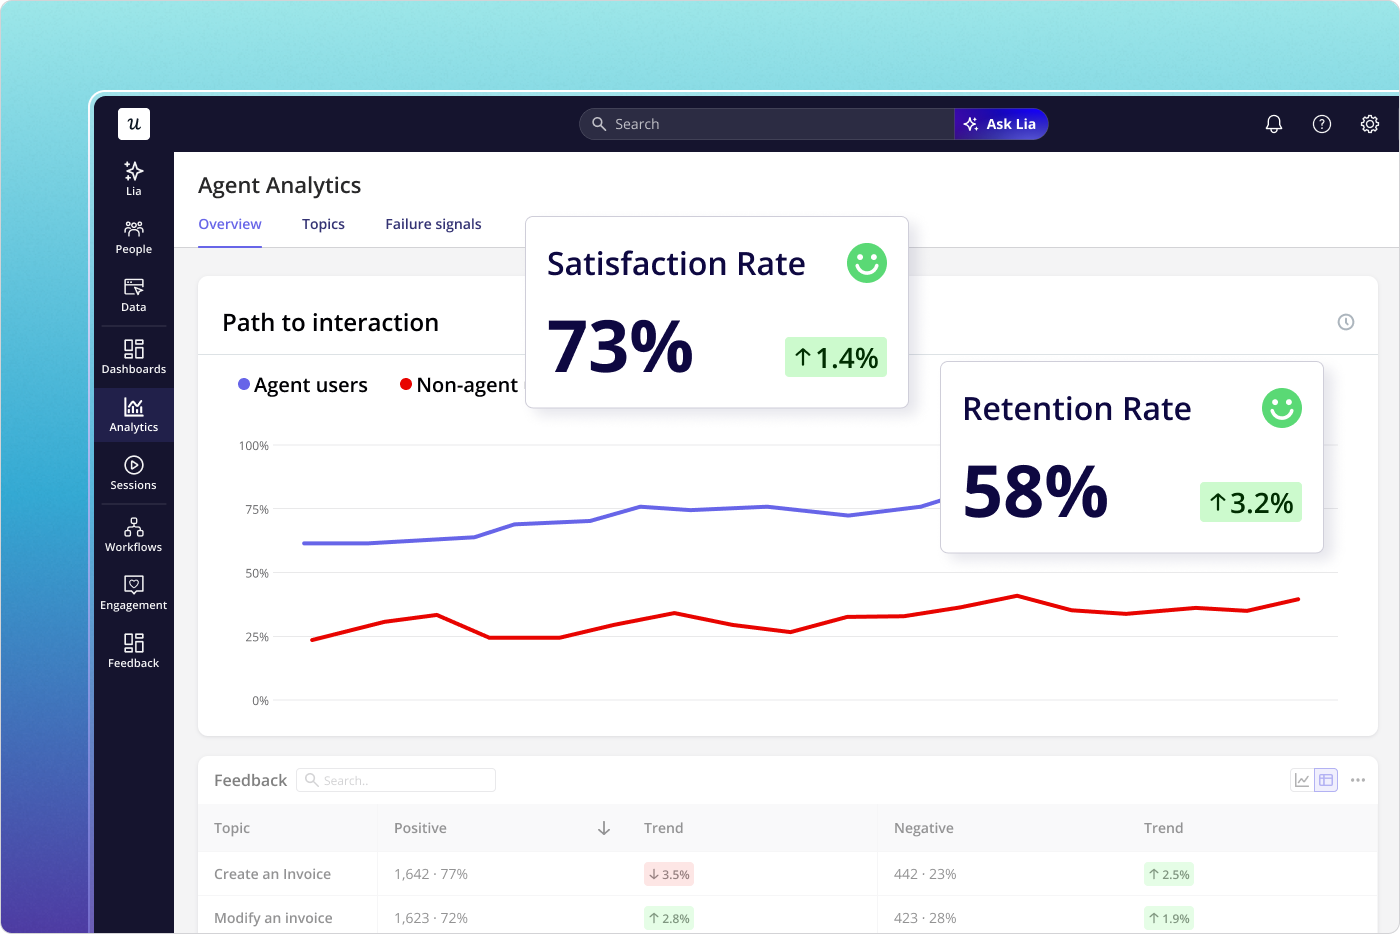
Our Userpilot Agent Analytics dashboard ships the agent-side of this measurement out of the box: agent task usage, satisfaction rate, conversation logs, failure signals, and outcome quality, in the same surface as our human conversion-path analysis.
From data to decision: Build, improve, promote, package, sunset
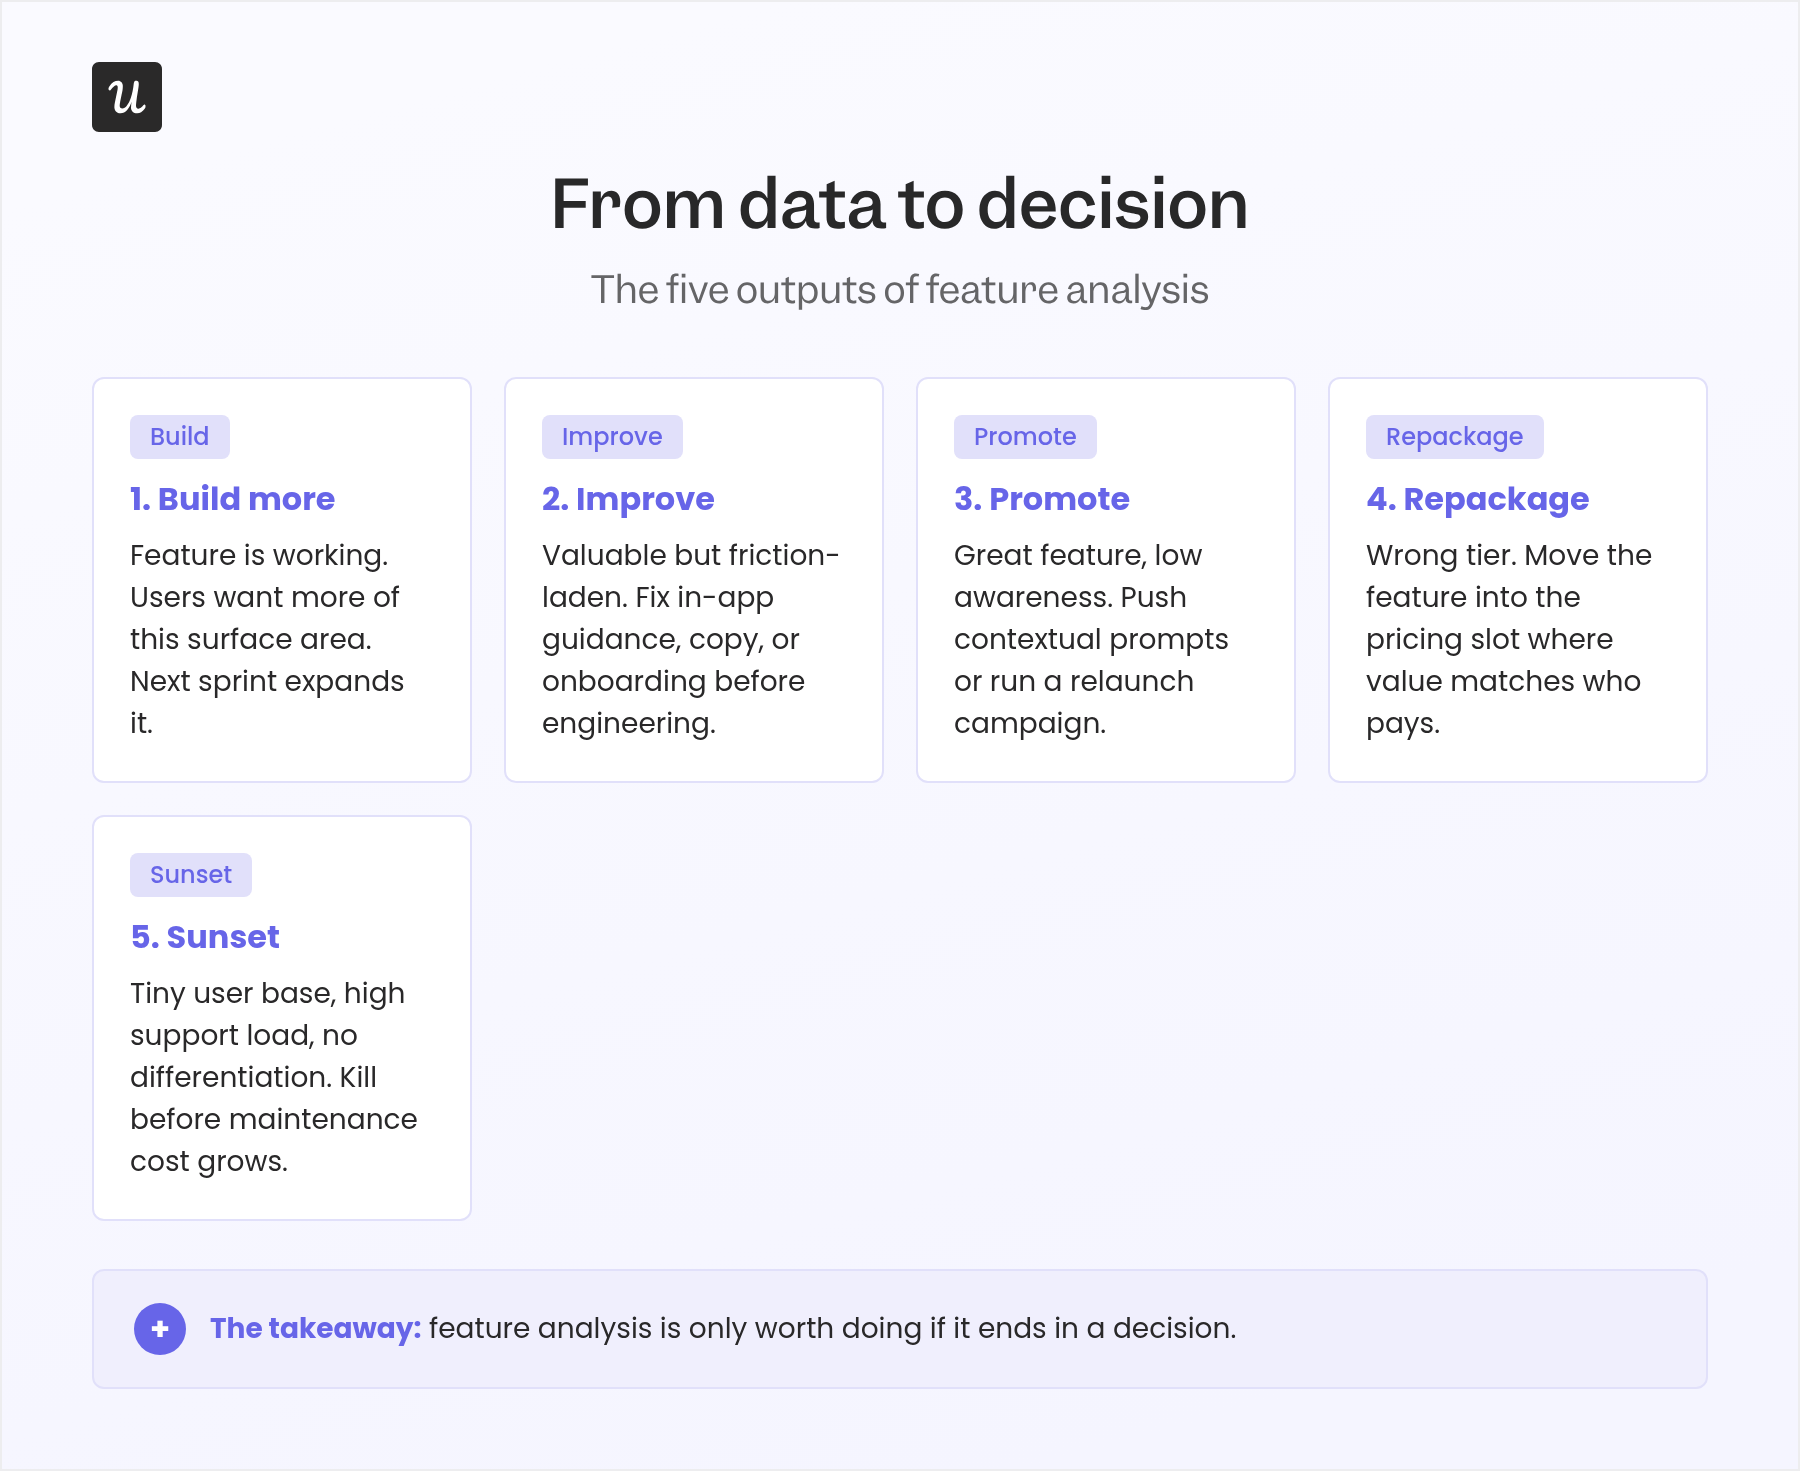
Feature analysis is only worth doing if it ends in a decision. The five possible outputs are these:
- Build more: The feature is working, users want more of this surface area, and the next sprint should expand it.
- Improve: The feature is valuable but friction-laden. Usually the fix is in-app guidance, copy, or product onboarding, not engineering.
- Promote: The feature is great, but most eligible users haven’t found it. Time to push contextual prompts, refresh the resource center, or run a launch campaign for a feature that already shipped six months ago.
- Repackage: Free users are using the feature heavily while paying users barely touch it (or vice versa). Move the feature into the right pricing tier and the value capture follows.
- Sunset: The feature is used by a tiny minority, drives disproportionate support load, and isn’t a competitive differentiator. Kill it before it accrues maintenance costs.
Weighted scoring helps with the call but shouldn’t replace judgment. The practitioner thread on r/ProductManagement got this right: scores need objective linkage to outcomes, multi-goal mapping, and sensitivity checks before you trust them.
Every feature on our roadmap has a documented kill condition before it ships. If usage hasn’t crossed threshold X by date Y, or if the cost-to-serve exceeds Z, the feature gets sunset and the team learns from it. Without this discipline, the product turns into a fossil of half-adopted features.
The cadence I run: Monthly operational, quarterly strategic
Annual feature reviews are dead, for the same reason annual roadmaps are dead. My cadence has two layers, one monthly and one quarterly.
Monthly: Refresh the catalog, review feature health by segment
Every month, I refresh the feature catalog. Event mappings change as engineering ships, ownership shifts, eligibility rules move when pricing changes, and merged or renamed features need their tags updated. If this drifts for a quarter, the analytics layer stops telling the truth.
I also review feature health by segment. For each major feature, I inspect adoption, time-to-first-use, repeat use, retention contribution, support themes, and qualitative feedback. The point isn’t to look at every chart, but to spot the one feature whose curve has changed since last month.
Quarterly: Refresh the matrix, competitor context, scoring sensitivity
Every quarter, I refresh the feature matrix itself. New features get added, sunset features get removed, and the portfolio-level “is this still strategically important?” question gets asked deliberately, not by default.
I also refresh the competitor and integration context. Which features have become table stakes since last quarter, which are now differentiators, and which are showing up on competitor changelogs for the first time? G2 reviews and competitor pricing pages are usually the fastest signal.
For important releases, I use staged rollout and product experimentation rather than full-send launches. Percentage rollouts, guarded rollouts with automatic rollback, and proper A/B tests are now standard for features that can materially affect business goals.
For AI features: An eval review before scale-up
The cadence above doesn’t change for AI features, but a new step gets added before each scale-up gate. Before I roll an AI feature from 10% to 50% of traffic, I review the eval dashboard: traces, graders, regression tests, and the task-completion + intent-resolution numbers from the most recent run.
If task completion drops or intent resolution regresses by more than the threshold we set at launch, scale-up is paused, and the feature is re-evaluated.
How this changes the way we (Product Managers) work
The biggest practical shift is in what I personally spend my week on. Two years ago, a lot of my time went into building reports, pulling event data, and chasing the right denominator. Now Lia, our AI agent, handles most of that operational layer and surfaces the features whose health has changed before I’d have noticed on my own.
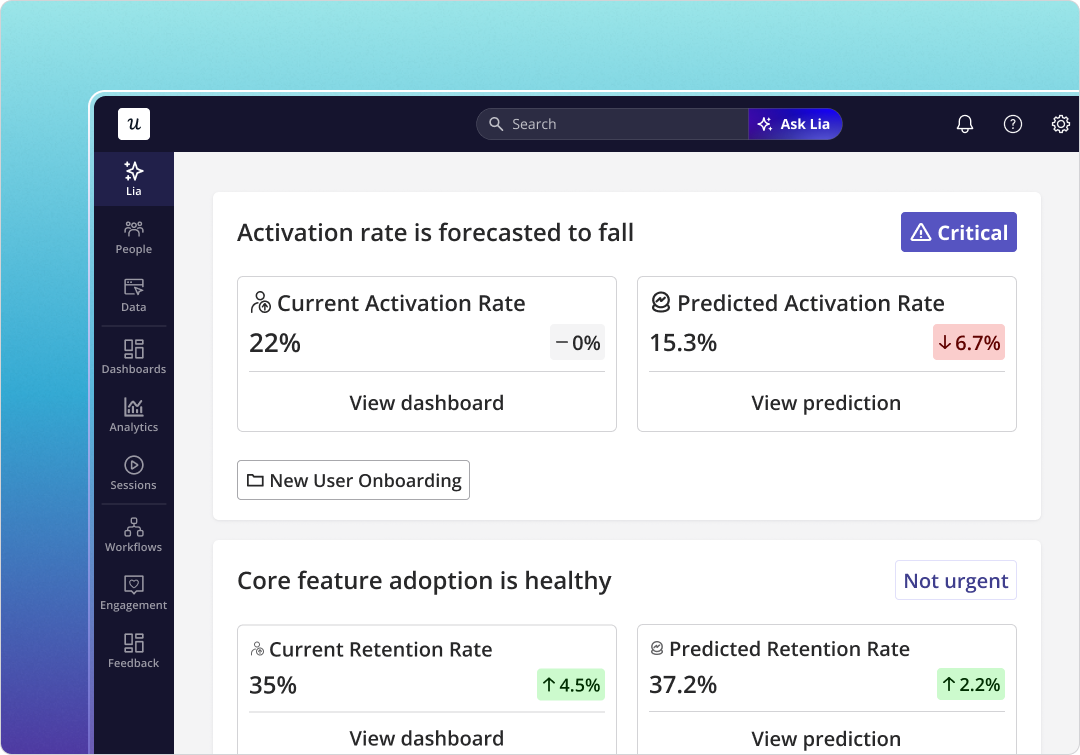
Our CEO Yazan Sehwail described the shift bluntly when I asked him about how Lia changed his view of the PM job:
“You’re no longer operating. The AI is operating. You’re just basically evaluating and monitoring the agent workflow.”
Translated for feature analysis specifically: the layer that used to take days (event tagging, denominator hygiene, monthly review) compresses into a background process.
My judgment time is reserved for the parts that actually need it: which feature deserves a sprint, which experiment counts as a positive result, which trade-off is worth making.
Where product feature analysis is heading
Two trends will keep shaping this practice through 2027.
One is that the feature unit will keep expanding. Once agent workflows connect to tools through MCP, the thing being analyzed is often a prompt-plus-tool-plus-workflow bundle, not a single UI control. Your feature matrix has to learn to represent that bundle as one unit, even when the underlying engineering touches five systems.
The other is that the human and agent streams will keep diverging. Metrics, tooling, and operating cadence for each will mature independently. Teams that build one analytics stack for both will increasingly misread agent-heavy accounts.
The PMs I see winning this are the ones who automate the operational layer, keep their judgment for the strategic calls, and ship analysis that ends in a decision rather than a chart.
If you want to see how this looks inside one platform (the feature catalog, the segment-level health views, the Agent Analytics layer, and our own vertical product growth agent Lia surfacing what’s changed), you can book a Userpilot demo. We’d rather show you the loop than tell you about it.
About the author