User Behavior Analytics Examples And Use Cases


Looking for user behavior analytics examples to get your inspirations rolling?
You’re in the right place. In this article, we broke down different examples and how to implement them for your product.
We’ll also cover behavioral analytics tools you can use to understand users better and create flows to boost product experience.
Summary of user behavior analytics examples
- Behavioral analytics or user and entity behavior analytics is a data analysis process that focuses on understanding how users interact with your product.
Understanding user behavioral data can help to:
- Improve trial-to-paid conversion rate
- Drive product adoption and stickiness
- Identify and remove friction
- Reduce customer churn
- Improve customer experience and satisfaction
The behavioral analytics examples we considered:
- Funnel analysis to understand friction
- Path analysis to shorten time to value
- User behavior trends to improve adoption
- Product usage analysis to increase customer lifetime value
- Cohort analysis to improve retention
- Sentiment analysis to reduce churn
- Customer experience analysis to increase stickiness
- Multivariate testing analysis to increase engagement
What is behavioral analytics?
Behavioral analytics is a data analysis process that focuses on understanding how users interact with your product.
It involves collecting and analyzing user data, from website visits, page views, clicks, and purchases, to in-app behavior like feature usage and navigation, in order to identify patterns and trends.
This information can then be used to improve the user experience, optimize in-app flows, and boost retention.
How tracking and analyzing behavioral data helps SaaS
Understanding user behavioral data can help you:
- Improve trial-to-paid conversion rate: By analyzing customer behavior during the trial period, you can pinpoint actions that lead to conversions. This insight allows you to optimize the trial experience, increasing users’ likelihood of transitioning from free trials to paid subscriptions.
- Drive product adoption and stickiness: Tracking behavior helps you identify which features are popular and which are underutilized. This knowledge empowers you to promote and enhance the adoption of key features, making your product indispensable to your users.
- Identify and remove friction: Wondering why users aren’t progressing as they should through the customer journey stages? Behavioral data highlights where users encounter obstacles or frustrations within the product. You can then take targeted actions to eliminate these pain points, creating a smoother and more enjoyable user experience.
- Reduce customer churn: By monitoring behavior over time, you can detect signs of disengagement or dissatisfaction. This early warning system enables you to intervene with retention strategies, reducing the likelihood of users canceling their subscriptions.
- Improve customer experience and satisfaction: Analyzing user behavior helps you fine-tune your product to meet user needs. This results in a more satisfying customer experience, leading to higher overall satisfaction and loyalty to your brand.
Behavioral analytics examples
Let’s go over some practical behavioral analytics examples.
How to use funnel analysis to understand friction
Every path in the user journey is an opportunity for progress or drop-off, depending on the user experience. Poor UI design, complex forms, bugs, etc., are some factors responsible for in-app friction.
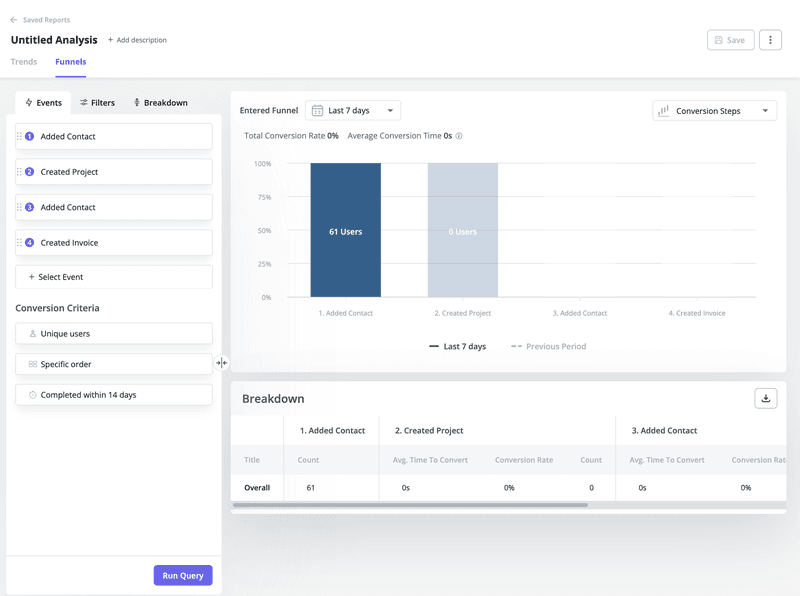
Use funnel analysis to visualize the entire user journey, from initial sign-up to achieving specific goals or outcomes. Identify where different user segments drop off or face difficulties completing essential tasks. Armed with this information, you can trigger in-app experiences to boost the user experience.
For example, below is a funnel using different events (added contact, created project, added contact, created invoice). To optimize this funnel, measure the conversion at each event and check where drop-offs happen, then prompt users to add a project or whatever is next based on the steps where engagement drops.
How to use path analysis to shorten time to value
Path analysis is similar to funnel analysis in many ways, but the latter covers sequential steps, while path analysis allows for a more non-linear exploration of user journeys.
It doesn’t assume a predefined sequence of actions but examines how users navigate freely through your platform, making it a good way to identify the shortest TTV for tasks.
After using path analysis to understand the shortest time to value, build in-app guidance that directs new users to that path and boosts product adoption.
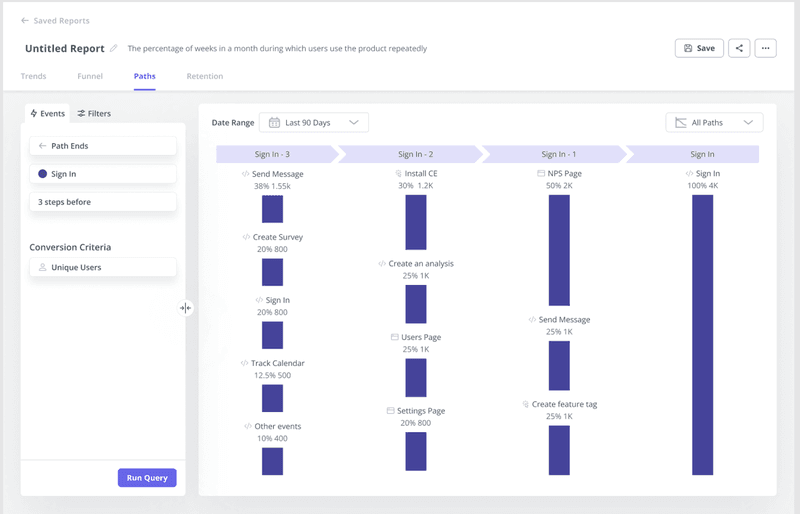
Here’s a path analysis showing the percentage of weeks in a month during which users use a product repeatedly and the paths they took.
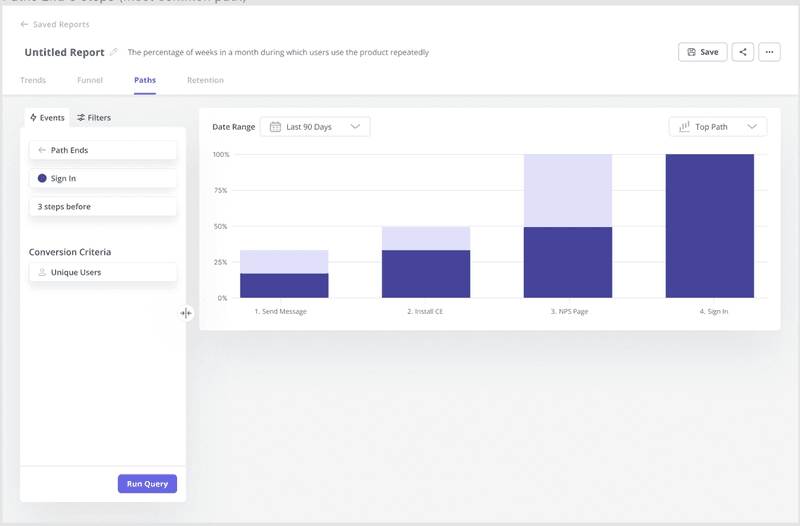
And a compressed version showing the top paths users take:
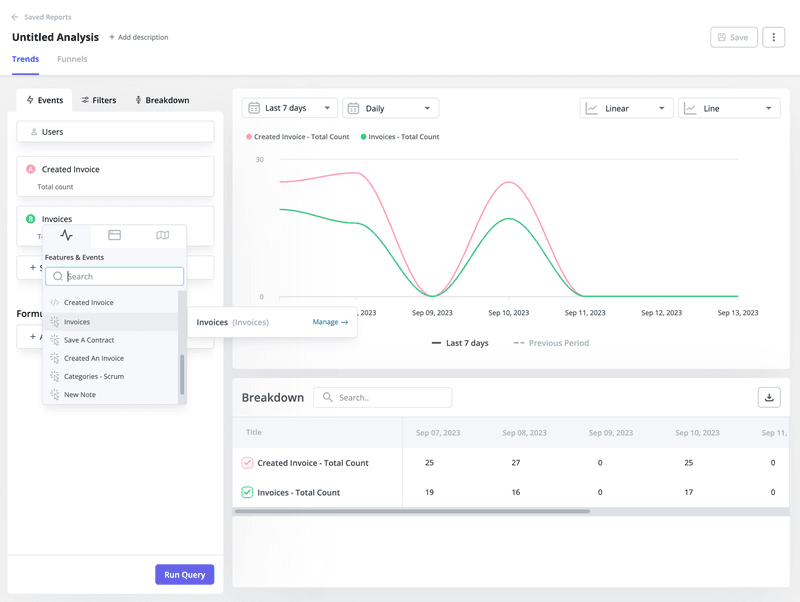
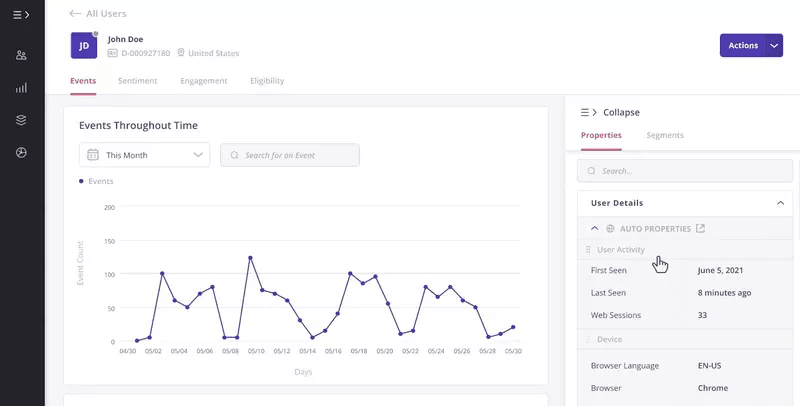
How to use customer behavior trends to improve adoption
Dig into product usage trends and understand how users are interacting with your tool. Then, based on the data obtained, spot ways to improve engagement and adoption.
The example below analyzes users who clicked on the invoice feature and those who actually created an invoice.
It’s a problem if users are clicking the feature but not using it to create invoices. That’s a sign of friction.
You’ll need to investigate further to find and address possible causes. Screen recordings work well for situations like this.
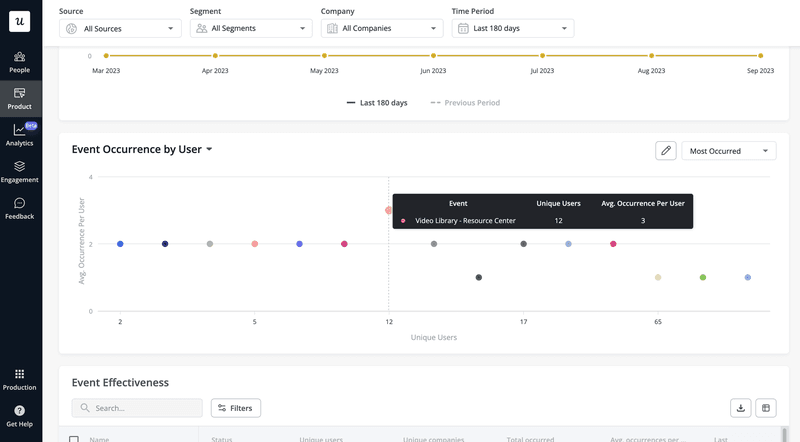
How to use product usage analysis to increase customer lifetime value
By nurturing and retaining existing customers, you can unlock a continuous revenue stream while reducing the high costs associated with acquiring new customers.
The key to getting this right is creating a satisfactory product experience so customers have no reason to consider alternatives.
With product usage analysis, you’ll understand what brings the most value to users. That way, you can focus on providing user experiences that motivate customers to stick with you.
Through your analysis, aim to find the most used features by your power users.
Then, identify users yet to adopt those features and trigger in-app flows prompting them to test the feature. Doing this helps you add more value to users and increase retention.
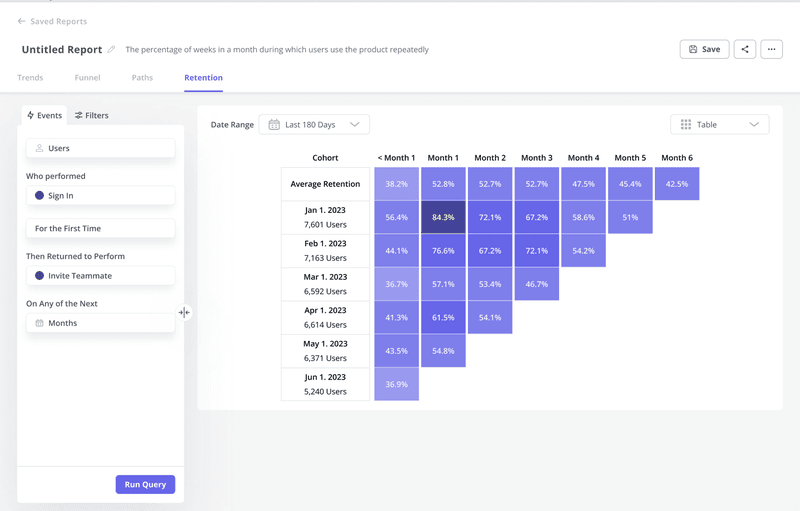
How to use cohort analysis to improve retention
Cohort analysis involves grouping users who share a common characteristic or experience within a specific time frame.
This analysis can reveal how well your product retains users over time. You can see if users acquired in a particular month or through a specific onboarding experience continue to engage with your product.
It also lets you dive deep into user behavior and highlight areas for improvement. For instance, if a cohort of users shows a drop in engagement after a product update, it signals the need for further investigation.
How to get started?
The first step is to define your cohorts. Determine the common characteristics or events you want to analyze. For example, cohorts can be based on sign-up date, acquisition channel, feature usage, or any other relevant factor influencing retention.
Segment users into cohorts based on predefined characteristics and analyze them to gather valuable data. Act on the insights and boost retention for each cohort.
For instance, imagine your analysis reveals users who engage with a certain feature in their first week tend to stick around longer. Highlight this feature during onboarding and offer guidance to encourage early adoption.
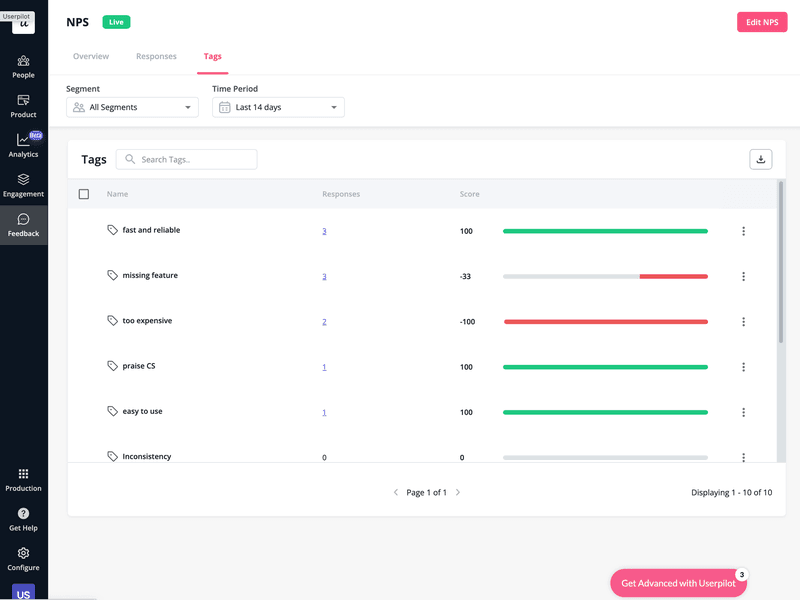
How to use sentiment analysis to reduce churn
By analyzing sentiments expressed in user surveys, you can gauge customer satisfaction and identify areas for improvement. This knowledge enables you to make informed decisions that improve the user experience and reduce churn.
Collect user sentiment data through NPS or any qualitative data analytics and track response themes to understand how users feel. Act on the feedback to encourage further engagement or prevent users from churning.
For example, you can get back to NPS promoters, thanking them for their feedback and asking that they leave a review or complete some important task. Similarly, you can follow up on passives and detractors, acknowledge their feedback, and offer personalized help.
How to use customer experience analysis to increase stickiness
Customer experience analysis is a comprehensive process that systematically evaluates every touchpoint and interaction a customer has with your product.
Its primary goal is to understand, measure, and improve the overall user experience across critical touchpoints in the user journey.
Dig into survey data from CES, CSAT, and customer experience surveys to understand the user experience. You can also pair survey data with engagement data from your analytics tool to gain deeper insights.
By tracking user interactions and feedback, you can tailor your guides, flows, and updates to meet specific user needs.
This personalization boosts user satisfaction and increases the likelihood of users continuing to engage with and advocate for your product.
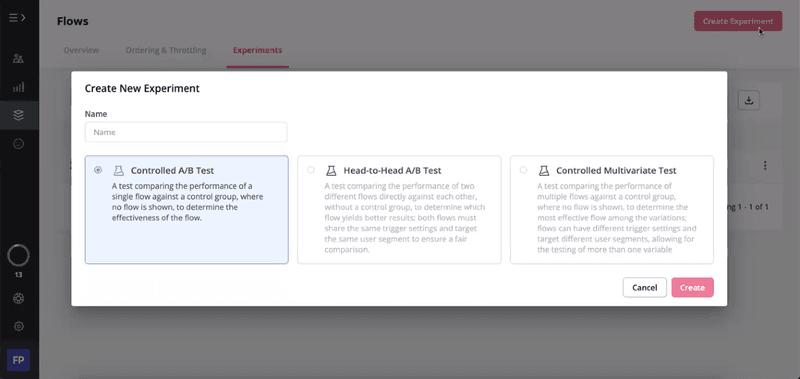
How to use multivariate testing analysis to increase engagement
A/B and multivariate testing help you make data-driven decisions to improve engagement and retention. Wondering if changing your CTA will impact anything or if putting a specific feature upfront during onboarding will improve adoption?
Use A/B or multivariate tests to see how users respond and choose the versions that resonate more with them.
You can use both A/B and multivariate tests to understand user preferences across the customer journey. The main difference is that A/B tests compare two variables, while multivariate tests analyze the influence of more than two factors.
For example, if you want users to click on your new analytics feature and wonder what CTA to use, A/B testing comes in handy.
Your A/B test setup could look something like this:
CTA variation A: “Explore Analytics Dashboard.”
CTA variation B: “Discover Advanced Analytics.”
To understand multivariate tests, imagine you want to optimize user engagement within your in-app chat support system. You could test different elements of the chat experience to find the most effective combination.
Here’s what your multivariate test setup might look like:
Element 1: Chat widget position
- Variation A: Chat widget in the bottom-right corner.
- Variation B: Chat widget in the bottom-left corner.
Element 2: Greeting message
- Variation X: “Hello! How can we assist you today?”
- Variation Y: “Welcome! Need any help?”
Element 3: Icon style
- Variation I: Chat icon with a speech bubble.
- Variation II: Chat icon with a question mark.
You’ll then test all possible combinations (A-X-I, A-X-II, A-Y-I, A-Y-II, B-X-I, B-X-II, B-Y-I, B-Y-II) to see which leads to the highest engagement.
About the author