
Are you making the most out of your customer experience analytics? What’s the value of it?
The data you receive from CX analytics enables you to reduce customer churn, increase customer satisfaction and retention, and help you identify the areas for product improvements.
This results in revenue growth and high user stickiness.
But first, let’s learn how to perform customer experience analytics (CX) in five easy steps and how to read the CX data you get.
Try Userpilot Now
See Why 1,000+ Teams Choose Userpilot

What is customer experience analytics?
Customer experience analytics (also known as CX analytics) stands for gathering all the data about customer engagement across your product to find and eliminate product friction and customer experience gaps to ultimately boost your product growth.
It includes the data collected from metrics such as customer satisfaction score, net promoter score, etc., and customer behavioral data.
What are the benefits of customer experience analytics?
Let’s get more granular and exemplify how you will benefit from customer experience analytics. Fewer buzzwords, more actionable insights!
With customer experience analytics, you can
- Make data-driven decisions based on collected customer data: You can see and understand why customers behave in a particular way and what their current needs are. This will help you prioritize bug fixing, feature updates, and big product tweaks, considering potential revenue growth from each improvement.
- Identify bottlenecks in the customer journey and remove them: You can do this by directly asking customers about their experience via surveys or indirectly observing customer behavioral patterns inside your product.
- Improve customer retention and loyalty: When you understand your customers’ pain points and product imperfections that annoy customers, you can quickly address those problems, therefore, improving customer loyalty. For example, you can trigger in-app guidance for users struggling with onboarding.
Who needs customer experience analytics?
As mentioned, CX analytics combines different types of behavioral analytics and more. That makes it useful and actionable for different teams to act on. Here’s how each role can benefit from customer insights:
- Customer success managers — for improving customer satisfaction and customer loyalty. For instance, they can work on the insights gained from product metrics to identify what user groups are unhappy and proactively contact them to pinpoint and address the issue.
- Product managers — for understanding users’ behavior and identifying bottlenecks. They can collect invaluable insights into how users interact with the product and what stops them from becoming engaged and active customers. The next step would be to take action to solve those problems, for example, by fixing products or providing more in-app support.
- Product marketers — for increasing customer engagement and reducing churn. Product marketers use customer analytics to understand better customers’ needs and what makes customers opt for their products, which can be used for in-app marketing campaigns.
5 most important metrics for customer experience analytics
In this part, we will explicitly describe how to find each vital metric for customer experience analytics and act on it.
Read carefully and try to apply new learnings to your customer data.
Customer Satisfaction Score (CSAT)
You can use metrics to assess the overall customer experience and satisfaction with your product, certain features, customer support, and so on. To calculate it, you divide the number of happy customers by the number of customers asked.
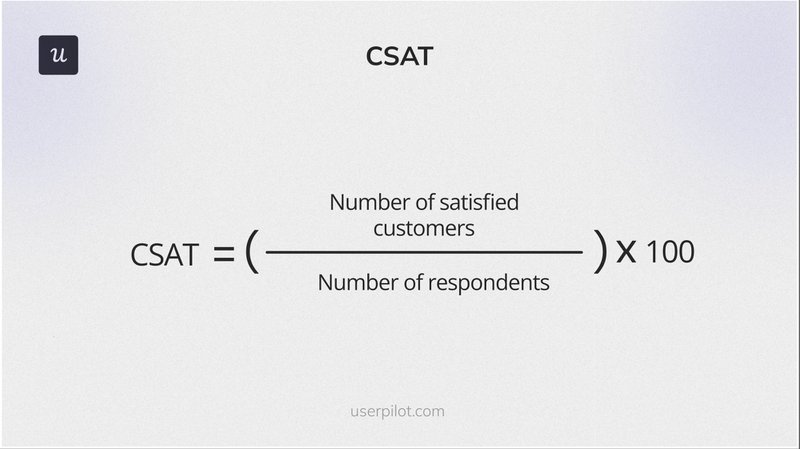
SaaS companies should measure customer satisfaction at different points in the customer journey. By doing so, you will collect valuable insights on why, where, and when users experience changes.
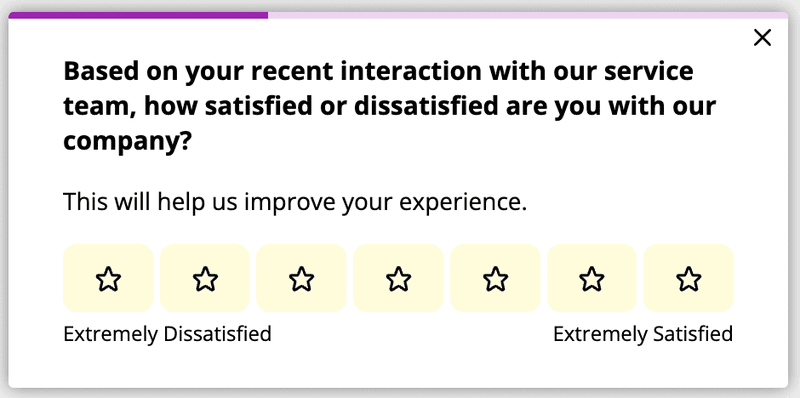
So how to gauge the CSAT score? By simply triggering CSAT surveys using a tool like Userpilot. Check out the example below.
Customer Lifetime Value (CLV)
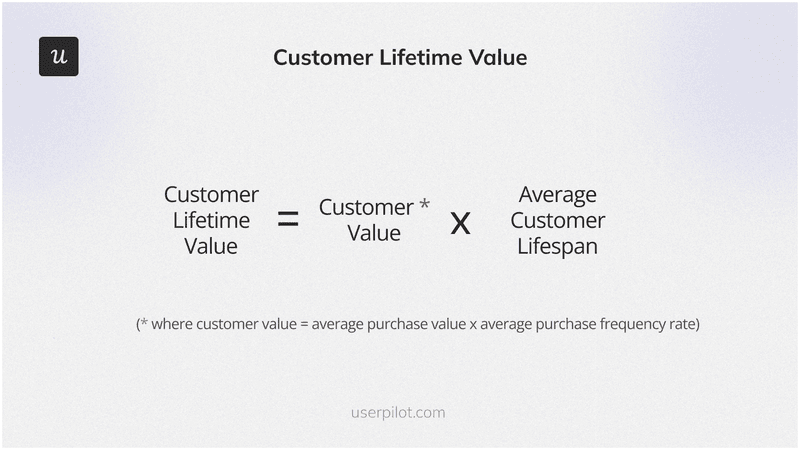
Customer lifetime value (CLV or LTV) says how much money one customer generates throughout their subscriptions.
This CX metric is essential to know as it helps you draw the straight line between customer retention and SaaS profitability. You can also use CLV in predictive analytics for future financial decisions.
Apply this formula to find your CLV: multiply customer value by average customer lifespan.
When applied to different user cohorts, you can recognize which ones generate the biggest profit and which are draining your business. You can go deeper and conduct a customer profitability analysis.
Customer Effort Score (CES)
Do you know how much effort your customers put into reaching out to your support team or completing a specific task using your product?
Among all of the CX metrics, CES was designed to digitize users’ efforts to give product managers data to act on so that they can mitigate product friction and deliver a better user experience.
To gauge this metric, you first need to create CES surveys and link to specific actions in the user journey. In other words, show a CES survey once a user has completed a particular action. For instance, after engaging with a feature for the first time or reaching a milestone in your customer journey.
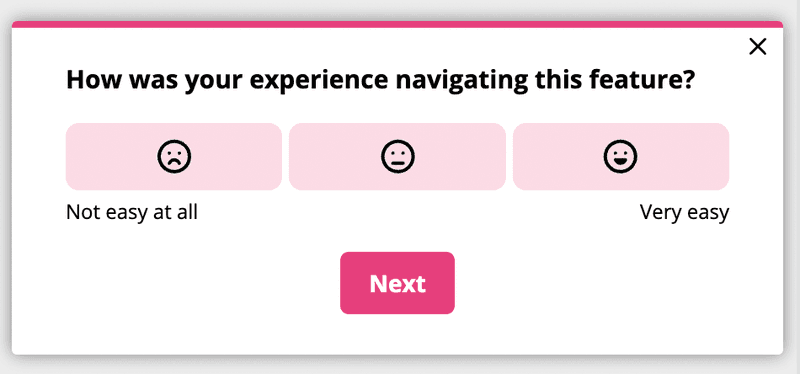
Next, you need to add up the amount of positive or negative responses and divide by the overall number of responses. Voila! You’ve got your CES score!
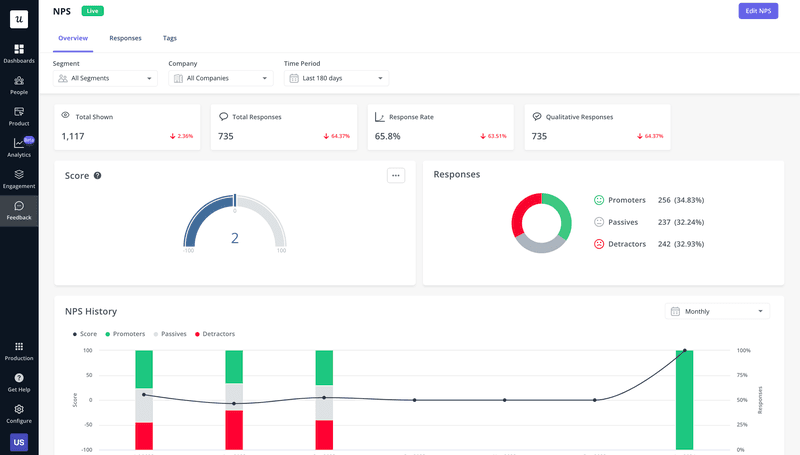
Net Promoter Score (NPS)
While the customer effort score focuses on collecting customer feedback and measuring their satisfaction at a specific moment in the user journey, the NPS score provides data on overall user satisfaction and loyalty.
You should measure the NPS score to timely recognize detractors (unhappy users) and offer them help to eliminate the likelihood of churn.
If you want to calculate your NPS score, simply subtract the percentage of promoters from the percentage of detractors. Or you can use a tool with options to send and analyze NPS surveys.
Customer Retention Rate
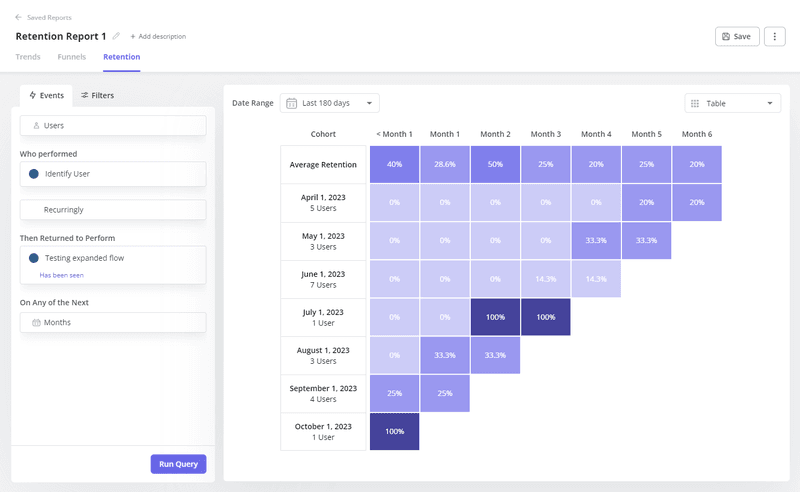
Unlike the customer churn rate, the customer retention rate measures the percentage of paying customers who prolonged their subscriptions out of the total number of paying customers at the end of a month.
If simplified, you will know how many customers are staying with you from month to month. This is an essential metric to keep an eye on because your product remains profitable and valuable as long as customers continue paying for it.
The formula of CRR is pretty simple: taking the number of customers at the end of a timeframe minus the new customers acquired and dividing the number by total users at the beginning of the period.
You can also use an analytics tool to automate retention rate calculation.
How to conduct a customer experience analysis?
We just discussed how to calculate the five most important metrics for CX analytics, but in all cases, we must extract the data from different sources and then interpret it.
Ready to do this? Let’s learn how!
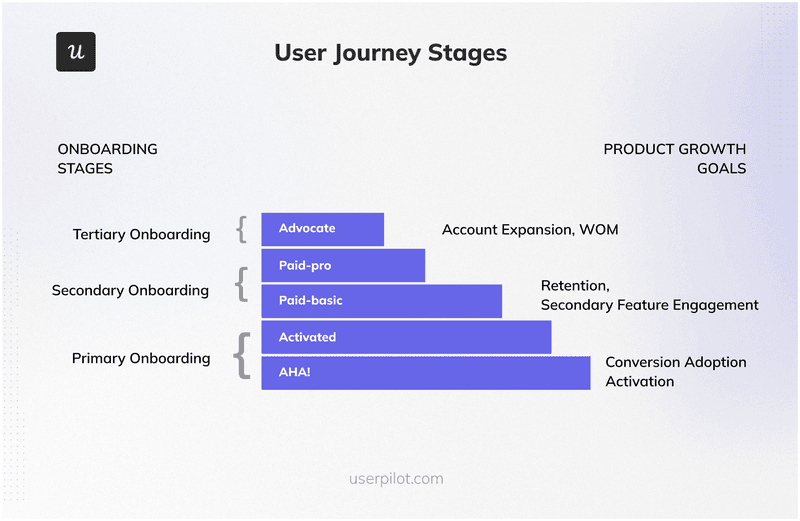
Map out the entire customer journey and divide it into stages
You don’t want to conduct CX analytics for all your customers at once. Doing so, you might end up with insufficient and vague data.
Imagine that you assess the Net Promoter Score (NPS) for the overall customer experience and have got 6 points. What are you going to do next?
Right, you need to dig down and understand the pattern of unhappy users. For example, you can discover that only new customers on the primary onboarding customer journey stage find your product confusing, while paid users give you a high NPS score.
That’s why you need to think globally and make sure you have customer experience analytics tools to map out the customer journey.
In addition, you should map the journey with all touchpoints leading to customer success (what customers hope to achieve using your product) to make it easier to calculate valuable CX metrics like CES or CRR.
Ultimately you will use the customer journey map to build better onboarding experiences based on the data collected.
Segment users in the welcome flow to understand their needs
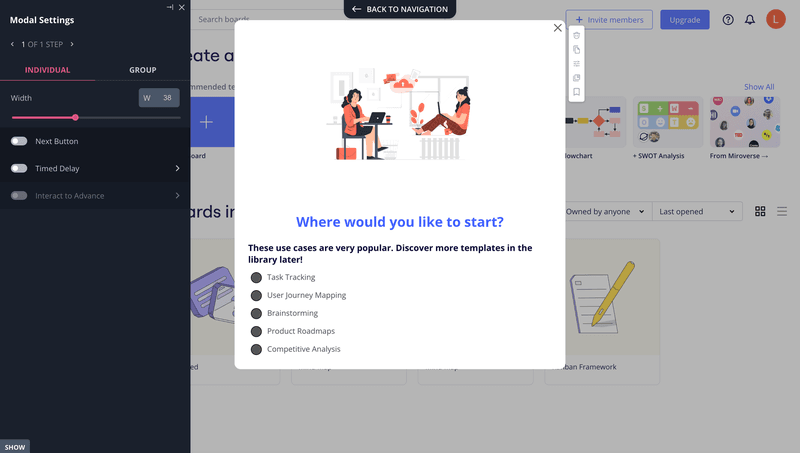
Customer segmentation from the first interactions with your product (once signed up or during the process) will help you understand your customers on a deeper level and learn what they want to achieve with your product.
This will help you create personalized in-app experiences for them that will drastically improve the overall customer experience and user stickiness and result in growing numbers of loyal customers.
To collect this data, you don’t need to code extra elements to embed in the product. Instead, you can install Userpilot’s code-free welcome screens in the welcome flow to ask new customers a few questions about their use cases and learn about their jobs to be done.
Track in-app behavior to monitor customer interactions
The next step in conducting an in-depth customer experience analysis is to track in-app behavior. Tracking users’ in-app behavior allows you to see how customers are interacting with your product, what features the majority of them are using, what customer interactions lead to the low NPS score or vice versa, and so on.
To do so, you can tag features or use custom events to collect customer behavioral data and then identify usage patterns for actionable insights.
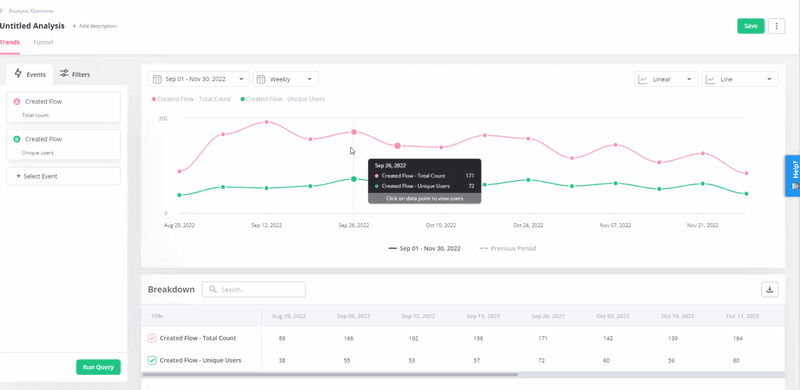
For example, you can track the number of unique users interacting with a specific feature and the total count of feature usage. This way you can look at the correlation between these two values and see if there’s a drop in usage that needs further examination.
Gather customer feedback across multiple touchpoints
Did you know it’s important to analyze customer efforts to identify friction points at every stage of the customer journey? It’s much more than the part of CX analytics.
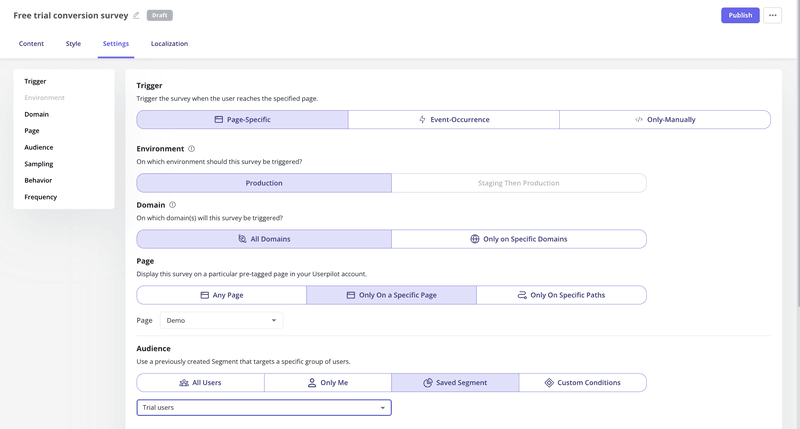
Continually collecting customer feedback via various customer satisfaction surveys at various customer touchpoints such as CSAT or CES will provide you with an opportunity to spot all friction points, eliminate them using feedback, and get back in touch with the customer to close the feedback loop.
You can identify important touch points that you want to collect insights about, then trigger a microsurvey as users interact with your product. This way feedback will be contextual and helpful for your product improvement efforts.
Conduct path analysis to prevent churn
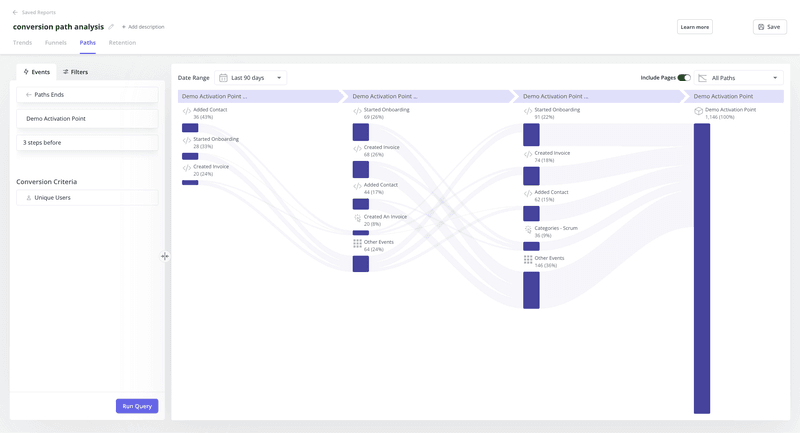
When all customer touchpoints are identified, you can also conduct path analysis to optimize customer experience. By identifying a popular path (or happy path) that helps customers reach a specific milestone, you can plan your interaction and in-app tutorials to help other churning customers.
To do so, you have to define either a starting event or an ending event to see how your users navigate and make progress on their customer journey.
Best customer experience analytics solutions for collecting and interpreting data
In the last part, you will learn how to collect customer data points using three different tools.
We will discuss the benefits and actionable features of each.
Let’s dive deep!
Userpilot
Userpilot is a product growth and adoption platform with data and analytics capabilities for monitoring customer behavior inside your product.
It also comes with options to create in-app experiences tailored to use cases. Here’s what it has to offer:
- Create welcome screens and capture customer information to understand them better and learn about their jobs to be done.
- Different UI elements like tooltips, checklists, modals, etc. to for building flows.
- Track feature usage and in-app behavior to spot your most engaged and active users.
- Segment customers to find your power users and ones who are about to churn (with a low engagement score or stalled users).
- Create surveys (like NPS or CES) and follow-up questions to measure customer satisfaction as well as analyze feedback data.
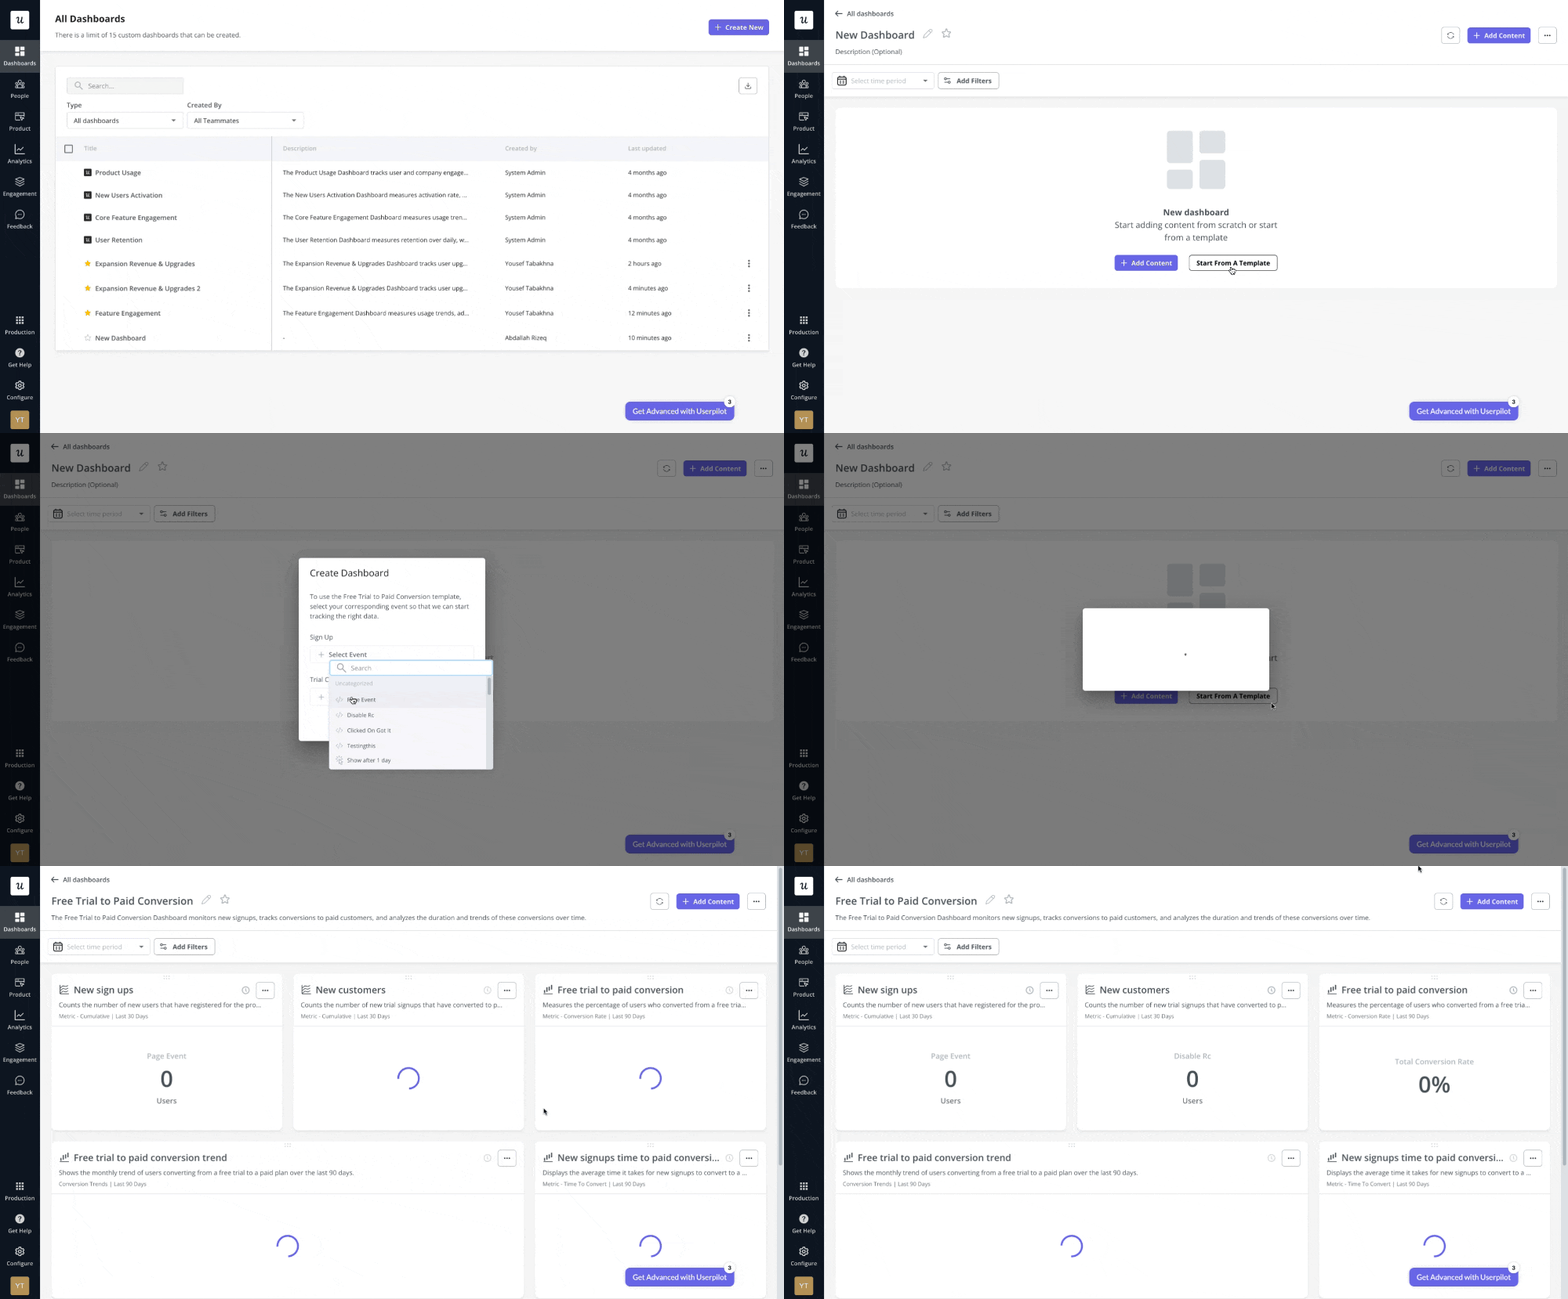
- Have a set of different product analytics dashboards to help you analyze data for actionable insights.
All of these things can be done code-free.
Qualaroo
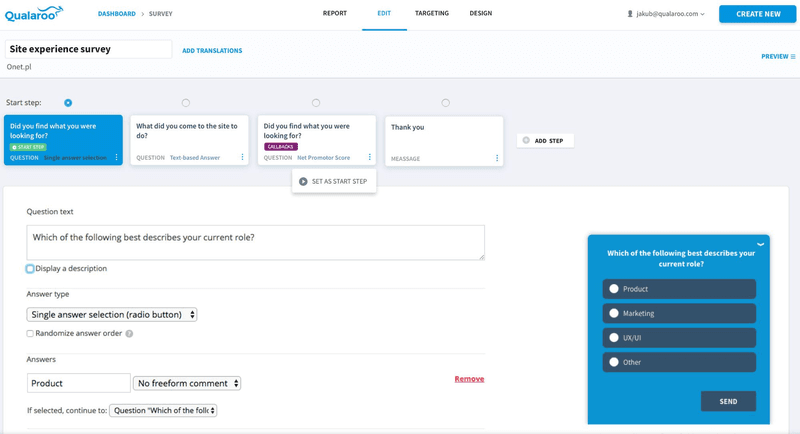
Qualaroo is another tool that helps companies only with gathering customer feedback through various channels — in-app, on the website, iOS & Android app feedback — and via surveys.
You should check out this tool if you need only a solution for collecting user feedback.
Mixpanel
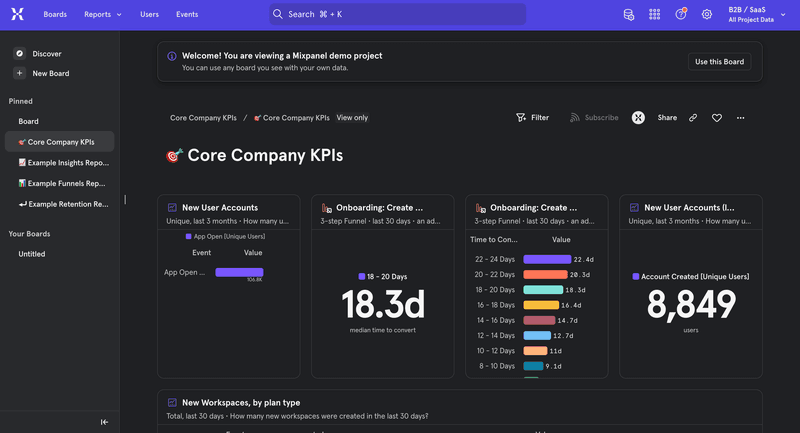
Mixpanel is a customer experience analytics solution that helps SaaS companies analyze each step of the customer journey in nitty-gritty details. It tracks user interactions with web and mobile applications and maps out the user journey steps.
You will see if customers complete milestones and at what stages they churn or stall. This tool is amazing to observe how customers progress through their journey at signups and what blockers they encounter.
Conclusion
CX analytics is the most comprehensive method to figure out what’s going on with your business and get actionable data to make product tweaks.
Ready to carry on customer experience analytics? Get a Userpilot Demo and see how quickly you can access the product data you need to act on.
[/vc_column_text][/vc_column][/vc_row][/vc_section]


