Are You Tracking the Right Mobile App Performance Metrics to Decode User Behavior?


Tracking mobile app performance metrics can feel daunting. One look at your mobile app analytics dashboard, and you just want to shut your eyes and scream in frustration.
You aim to extract meaningful insights to improve app performance and user engagement. But you find yourself puzzled, overwhelmed, and uncertain about which metrics truly matter.
I’ve been there too.
You’ll learn to identify and use the right metrics to make smarter decisions. I’ve also included the key metrics I track and recommend for every product team.
My process for choosing the right mobile app metrics
Now, let’s get straight to business and go over my process for choosing metrics that help you derive actionable insights.
1. Start with your business goals
Every metric you choose to track should have a purpose, which in practice means it needs to be tied to a business goal you are aiming to improve. And that’s exactly where you should start: define a goal you want to achieve. Then, select 3-5 mobile app performance metrics tied directly to it.
For example, when my goal was to reduce first-session abandonment by 20% over a quarter, here are the metrics I focused on:
- Load speed on onboarding screens: Aim for content to finish loading under two seconds to keep new users engaged.
- App latency during signup flows: Target an average response time below 250ms so taps feel instant and frustration stays low.
- Crash rate in the first session: Keep crashes under 1% of sessions to reduce uninstalls and bad reviews.
2. Map metrics to key user journeys
By hit friction points, so you can focus on fixes that boost completion rates at every critical step.
Then, answer the question: What does success look like at each step?
Some of the app flows I outline are onboarding, core feature usage, and upgrade. Ones that track behaviors along those paths.
3. Prioritize metrics that answer specific questions
Avoid looking at vanity metrics that don’t inform your next move. Instead, choose actionable metrics that reflect your app’s unique value, user behaviours, and business model.
To help you decide on what metrics to prioritize, ask yourself these questions:
- What do I want to learn? It could be very basic at first if a customer has never used a mobile growth platform before, maybe you want to validate your hypothesis on what your most popular feature is. Or you simply want to find out more about your users and where they are coming from.
- Will this metric help me identify a problem?
- What decision will this data influence? Data is not fulfilling its value if it is not making an impact on your product. Think about how you determine action based on data. This is harder than it seems and takes skill in analysis.
For example, if you’re working on a fintech app, it would make sense to track the number of successful transfers as a success metric since these on-off actions are the value proposition of your app. However, for a fitness app, the metrics you would usually focus on are weekly active users who log their workout routines.
4. Combine numerical data with qualitative insights
Never trust numbers alone. Quantitative metrics show what you want is happening, but qualitative feedback reveals why it’s happening. Validating one with the other gives you the whole picture and confidence to make decisions that improve users’ experience.
Use these methods to collect qualitative data:
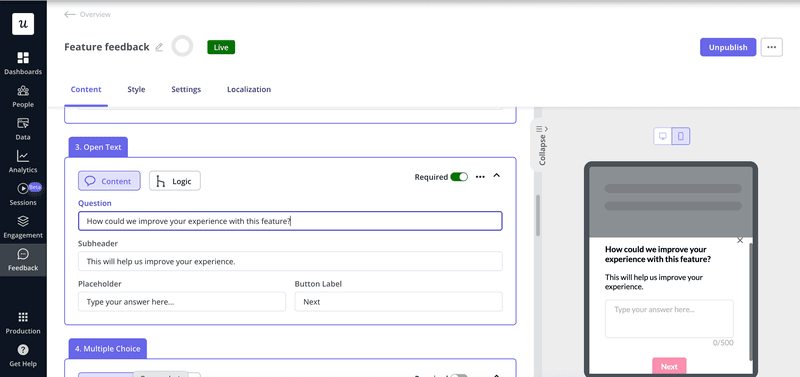
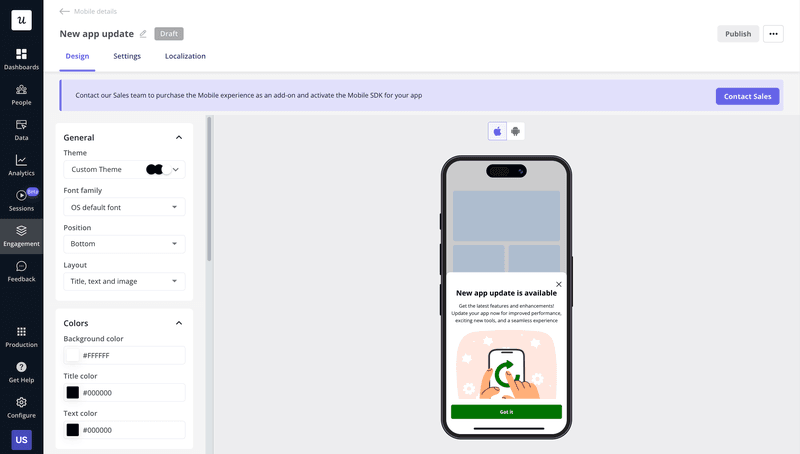
- In-app surveys: A tool like Userpilot lets you trigger surveys in your mobile app based on user behaviour and collect contextual feedback with logic conditioning.
- App store reviews: Monitor review trends (like ratings and comments) to spot recurring praise or complaints. Then, correlate them with your retention and crash metrics to see which issues affect users.
- User interviews: Schedule quick calls or async sessions with cohorts to dig deeper into pain points you’ve identified in your user research.
5. Reevaluate and refine your metric framework
As your app evolves (whether through new features, market shifts, or changes in user behavior), you revisit your chosen metrics to ensure you’re constantly measuring what matters most and can respond quickly to emerging opportunities.
I recommend setting quarterly audits to make sure your tracking plan is relevant. Here’s my exact process for doing that:
- Audit and retire: I review every metric and ask, “Does this still tie to my goals?” I archive ones that don’t.
- Add for new flows: Whenever we launch a feature, I define the success criteria for using it, then add new relevant events for tracking.
- Update dashboards and alerts: I edit my custom dashboards to reflect the new metrics, so I can monitor them at a glance.
Important mobile app performance metrics that product teams should track
Focusing on the important mobile app KPIs separates guesswork from data-driven improvements. I track the following metrics to see clear signals that guide me in adjusting my products’ in-app experiences and increasing user retention.
1. Daily, weekly, and monthly active users
These metrics help you highlight genuine engagement trends beyond only user downloads. For example, if DAUs increase after a new feature release, but MAUs stay the same, the update may have sparked users’ interest, but not driven long-term feature adoption.
Monitoring all three lets you detect when growth slows down, compare different user acquisition channels, and validate feature launches.
It also helps you measure another vital metric. User stickiness.
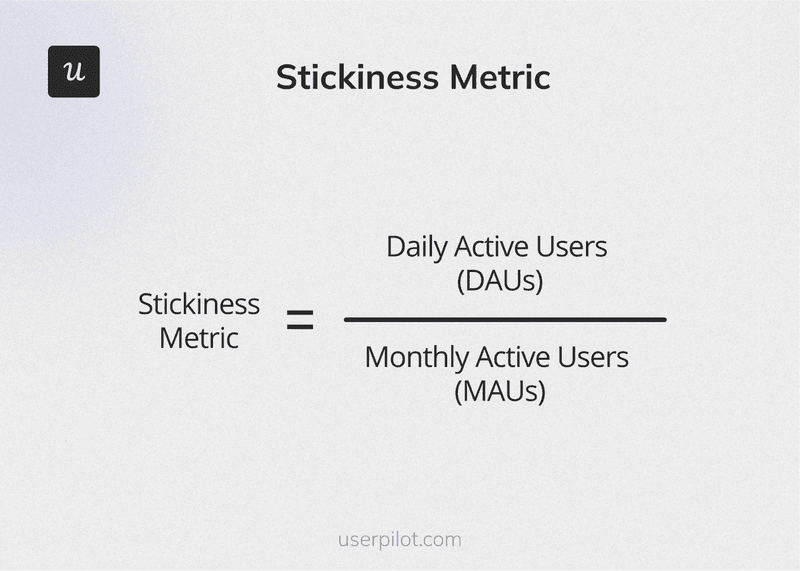
Stickiness measures how many monthly users return daily. Higher stickiness means more unique users engage regularly with your app.
You can calculate stickiness by dividing DAUs by MAUs.
2. Feature adoption rate
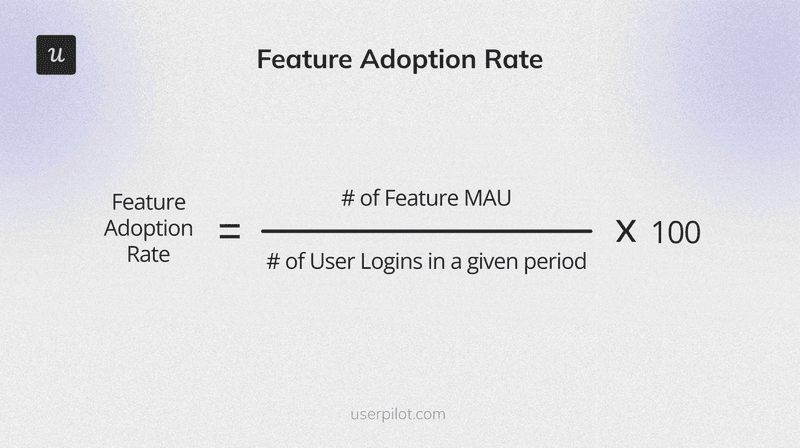
Feature adoption rate is the percentage of active users engaging with a specific feature during a certain period. You can calculate it by dividing the number of a feature’s MAUs by the total user logins over the same timeframe, then multiplying by 100. Our study shows that a 20-30% feature adoption rate is a solid target for SaaS products.
This metric helps you prioritize features and shape your product roadmap. If a newly released feature has about a 5% adoption rate, I know it’s likely that users can’t find it, don’t understand it, or think it’s irrelevant to their needs, and I work on solving that problem. Conversely, if more users adopt it after I added context-sensitive tips, that confirms my in-app guidance works.
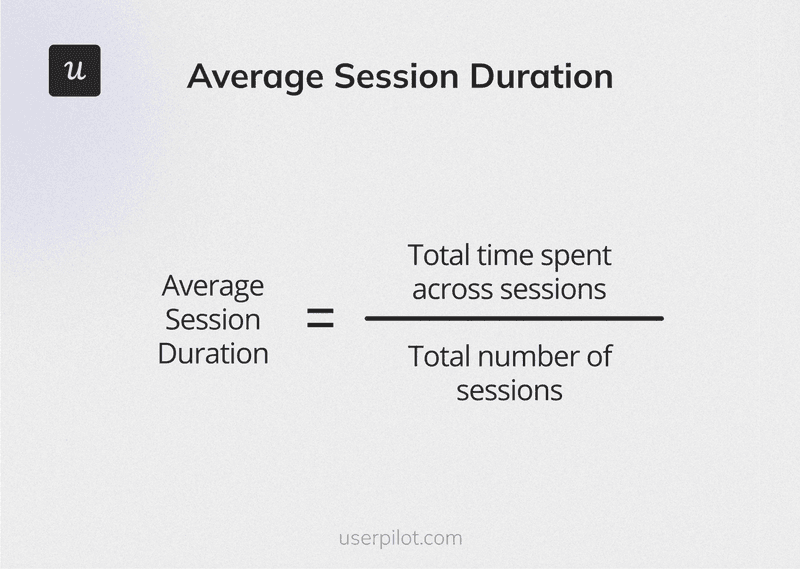
3. Average session duration
Measuring the average session duration helps you evaluate how long users engage with your app each time they open it.
You can calculate this metric by dividing the total time spent across all sessions by the number of sessions within a specific period.
Longer average sessions usually signal that users find engaging with your app valuable and intuitive. If your session length dips after implementing a UX redesign, the flows may be confusing, or you may have slow-loading screens.
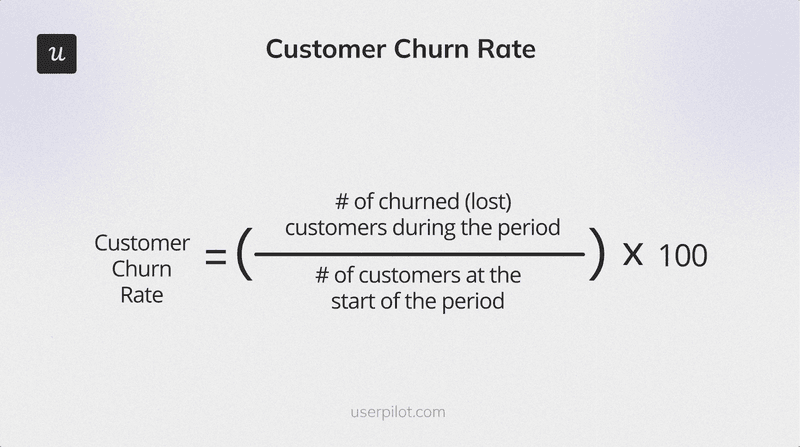
4. Churn rate
The churn rate measures how many users stop using your app. This is one of the mobile app performance metrics you want to keep low.
You can calculate the churn rate by dividing the number of users who stopped using your app during a period by the number you had initially, then multiplying by 100.
By monitoring churn continuously, you catch issues in your app experience before they worsen, retain users, and validate whether product updates make the right impact. For example, if I roll out a new signup screen and see an increase in churn, that red flag indicates the change has backfired and needs reworking.
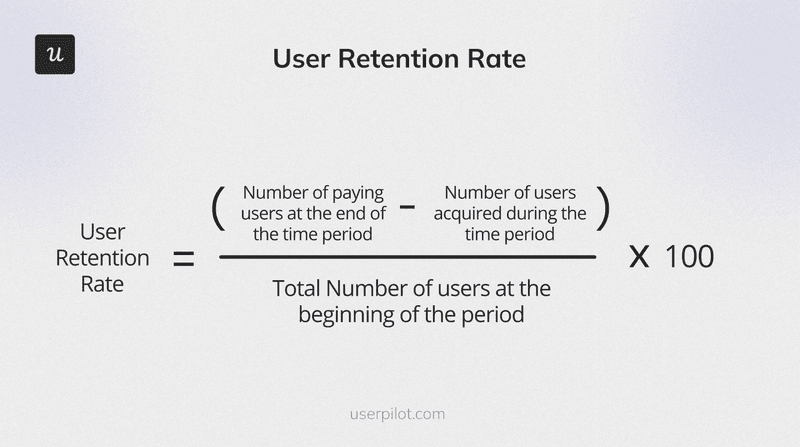
5. Retention rate
Retention rate helps you to measure how many users keep coming back, and whether you’re growing your user base over time.
You can calculate this metric by subtracting the number of users acquired in a period from the number of paying users at the end of the same period. Divide that by the total number of users at the beginning of the period, and multiply by 100.
Tracking your retention rate helps you know if your product updates, pricing tweaks, or engagement campaigns genuinely keep users and generate revenue. For example, you can compare month-over-month retention to see if a specific release or marketing campaign affected your app’s growth negatively or positively.
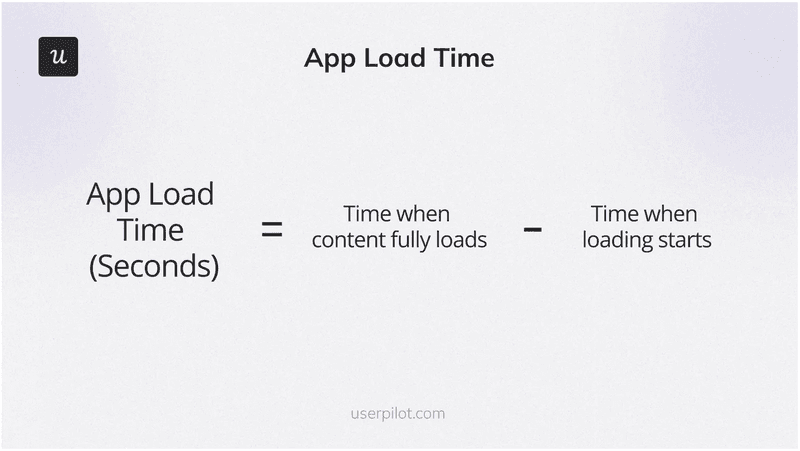
6. Load speed
Load speed measures how long your app’s content takes to completely display after a user opens it. You can calculate this metric in seconds by subtracting when the content starts loading from when it finishes.
Slow load speeds are one of the quickest ways to frustrate users. Each extra second waiting for the content to load increases the likelihood that they’ll leave your app. With Userpilot, you can pinpoint which screens load slowly and prioritize where to optimize to improve onboarding experiences.
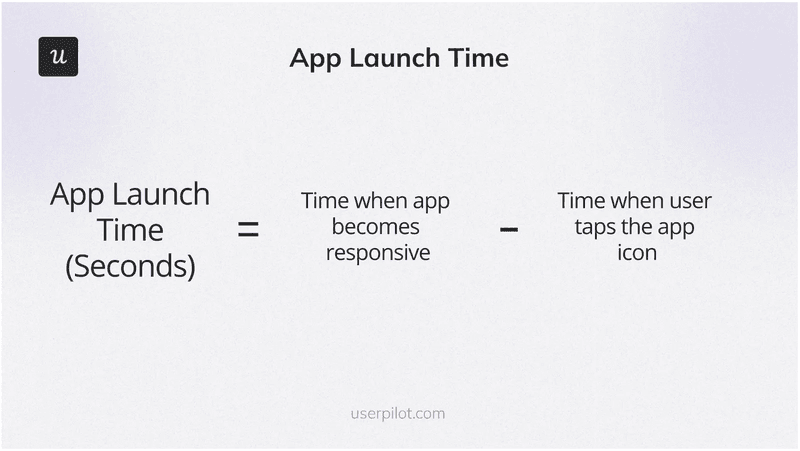
7. Mobile app latency
Latency is the delay between when a user does an action (like tapping a button, submitting a form, or switching screens) and when your app’s UI responds. You can calculate it by subtracting the time it took to tap the button from when the app responds.
Tracking latency across flows like onboarding, search, or checkout helps app developers identify infrastructure bottlenecks that worsen the user experience. If you notice a spike in latency for a loading screen, look into the API or database layer to make changes that improve your user journey.
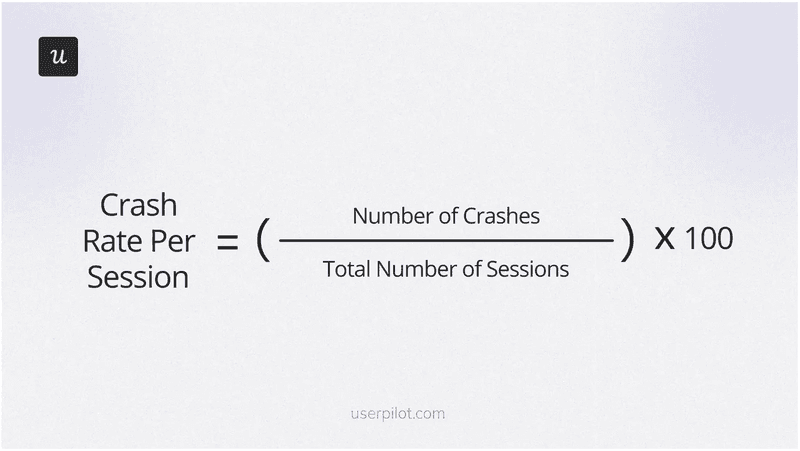
8. Crash rate
Crash rate is the percentage of sessions that end up in an app crash.
An increasing crash rate spells immediate danger. More users uninstall your app, leave one-star reviews, and damage your brand reputation. Catching crashes early helps you prioritize bug fixes and maintain your app’s stability before more users churn.
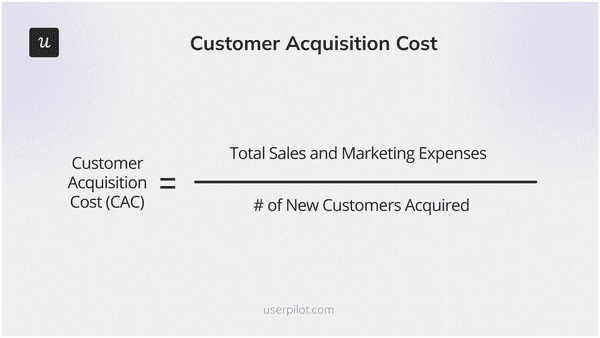
9. Customer acquisition cost
Customer acquisition cost (CAC) is the average money you spend to bring in one new customer. This mobile app marketing KPI helps you understand how efficiently your campaigns increase your user base.
Benchmarking CAC lets you compare channels (like paid and organic search), optimize ad spend, and refine targeting so that every dollar you spend drives the user growth rate. While most mobile app performance metrics focus on how users interact with your app, this one flips the lens and measures your expenses first.
Study each campaign’s performance and adjust your budget accordingly. If one campaign’s CAC is twice your average, find out why it works, experiment with it on other channels, or spend more resources on it to get better results.
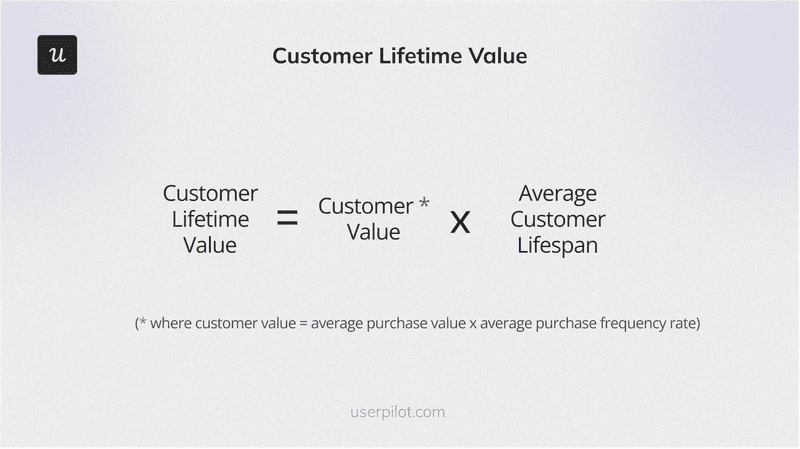
10. Customer lifetime value
Your customer lifetime value (CLV) helps you understand how much revenue a user will likely generate over the entire time they use your app, and spot which segments are worth investing in.
By segmenting users based on projected CLV, you can prioritize high-value cohorts for upsells, tailor your CAC budgets, and ensure you maximize long-term ROI rather than chase low-value signups.
Here’s how you can make the most of this metric:
- Use Userpilot’s behavioral segmentation to group users by predicted spend and expected time they’d spend with your app (compare their engagement patterns and feature usage).
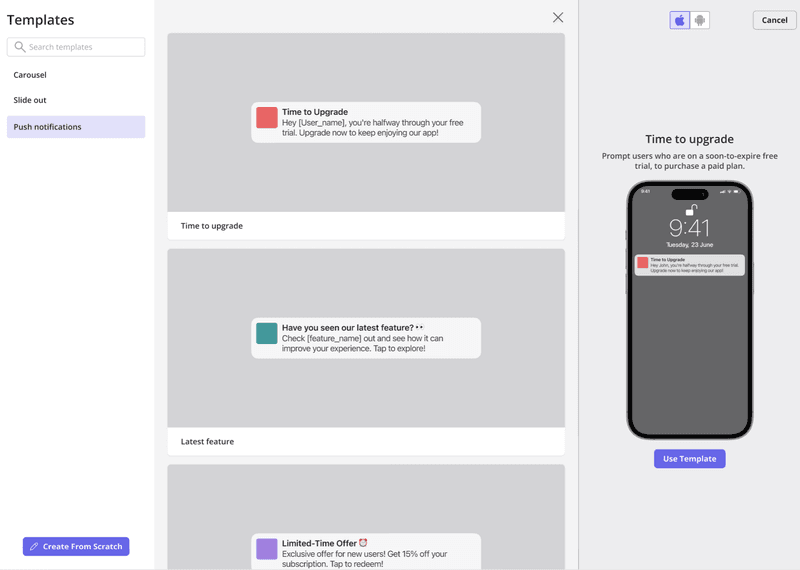
- For top-CLV cohorts, trigger a personalized carousel or slideout that nudges them to make more in-app purchases.
- Use in-app surveys to ask high-usage segments what advanced features they’d pay for.
Beyond the numbers: Turning metrics into action
Numbers alone won’t build loyalty, reduce churn, or increase your revenue. It’s what you do with those numbers that counts.
Userpilot combines all this into one code-free platform. With features like autocaptured events, contextual surveys, and swipeable carousels, you can build, measure, and optimize in real-time without hopping between tools.
Book a demo today, and let’s put your data to work, so you spend less time guessing and more time delivering the experiences that users enjoy.
About the author