Product analytics isn’t just another dashboard. It’s how we catch issues faster, like sudden activation dips after a rollout, and fix them before they turn into churn.
As Head of Product at Userpilot, I’ve learned the hard way that you can’t build what users want without understanding how they use your product. Gut feelings won’t cut it. You need accurate behavioral data tracked across every touchpoint, from your onboarding flow to feature adoption.
In this guide to product analytics, I’ll walk you through how it works, what metrics to focus on, and how to use tools like Userpilot’s product analytics to turn usage data into product decisions that matter.
Try Userpilot Now
See Why 1,000+ Teams Choose Userpilot

What is product analytics?
Product analytics is a business intelligence tool that captures user interactions and usage patterns across web and mobile apps through event tracking, properties, and behavioral patterns.
But from my experience, raw usage data isn’t enough. The real value of product analytics lies in its ability to turn behavioral data into actionable insights.
In my talk at Product Drive last year, I explained how your product analytics system should act as an ongoing feedback loop, not just reporting what happened but helping you understand why it happened, what to do next, and how to avoid repeating the same analytics mistakes.
What is a product analytics example in SaaS?
When I talk about the power of actionable product analytics, our customer, Beable Education, is a prime example.
What’s particularly relevant here is how they’ve effectively used Userpilot to gain deeper user insights. For instance, they used page tagging to closely monitor feature engagement, such as the usage of their Educator Academy. This gave them concrete data to validate feature impact, which is a key challenge for many product teams.
They also employed funnel analysis to track student engagement with content, which is crucial for optimizing the learning experience.
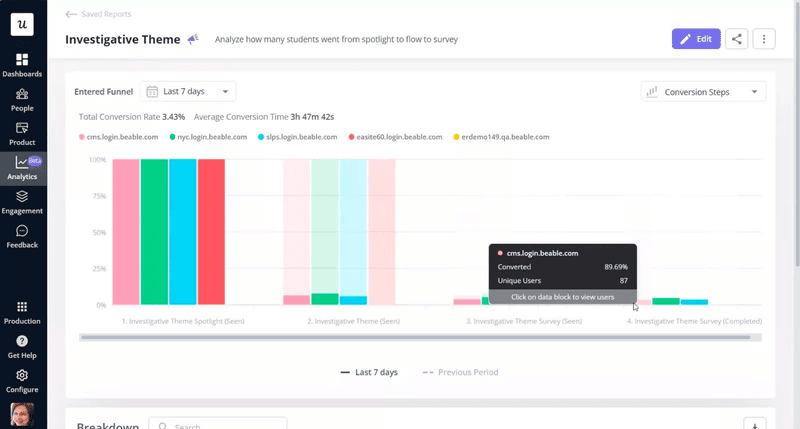
And significantly, they leveraged in-app surveys to gather feedback and saw a notable 77% increase in student participation.
Why does product analytics matter?
I’ve worked on products with zero analytics and others drowning in dashboards. Both fail in the same way: they don’t lead to action.
The real value of product analytics lies in its ability to surface key performance indicators and behavioral data that directly inform what you build next. It’s how we move fast at Userpilot: iterate with purpose and optimize measurable outcomes like improving onboarding efficiency and boosting long-term engagement.
What’s your biggest product analytics challenge right now?
How mature is your current product analytics process?
What is your primary goal for improving your product analytics?
You’re ready to turn insights into action.
Userpilot’s product analytics helps you understand user behavior, drive adoption, and grow your business without writing complex code.
Gain insights into user interactions
If you’re serious about building high-performing digital products, understanding how users interact with them is non-negotiable. Product analytics gives you that visibility. You can see what users do in real time, where they hesitate, and which features they actually use.
It helps you identify friction in workflows, measure the success of individual features, and uncover the exact steps that lead to engagement or drop-off. Instead of guessing or relying only on user interviews, product analytics shows you what’s working and what’s not.
Drive product performance and optimization
Product analytics helps you move beyond tracking metrics; it helps you act on them. You can see which features users engage with, where they drop off, and how different segments behave over time. This makes it easier to spot friction, prioritize fixes, and ship updates that actually move the needle.
Instead of guessing what needs improvement, you’re working with data that ties directly to outcomes like activation, retention, and customer success. That’s how we continuously optimize performance without wasting cycles on the wrong things.
Who will benefit from product analytics?
I get this question a lot, and the short answer is: almost every team that touches the product. I’ve seen that product analytics only works when everyone uses it, and not just product managers. Here’s how it supports the different teams I work with.
- Product teams use product analytics to prioritize features, track adoption, and spot drop-offs in real time. It gives them a feedback loop that’s faster and more reliable than customer interviews alone. Product managers can validate whether users are doing what they intended.
- UX designers use behavioral data to analyze how users flow through interfaces, identify hesitation points, and determine which elements aren’t performing well. This insight is critical for refining flows and optimizing usability.
- Growth strategists use analytics to build and test hypotheses and then measure what’s working. From onboarding funnels to targeted campaigns, they depend on user behavior data to boost conversion rates and scale engagement.
- Customer success teams track usage patterns and feature adoption to spot at-risk accounts, reduce churn, and proactively offer support. It’s how they go from reactive to strategic.
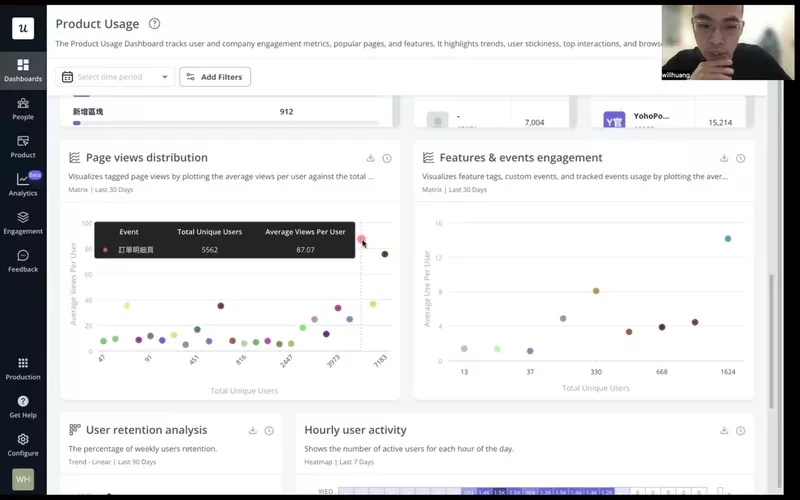
One example that stuck with me is our customer, Cyberbiz, a major e-commerce player in Taiwan. Their product team used Userpilot’s analytics to improve their admin panel. They didn’t just guess what to fix: they looked at page views to understand what mattered most, then tracked session duration to measure whether their changes sped things up.
What types of analyses can you run for product analytics?
When most product managers think about product analytics software, they picture a dashboard full of graphs. However, to truly analyze user behavior and optimize product performance, you need to break that detailed data down through specific types of analysis.
When I review product data, I don’t start with graphs; I start with the question. Each analysis method exists to answer a specific question.
Funnel analysis report
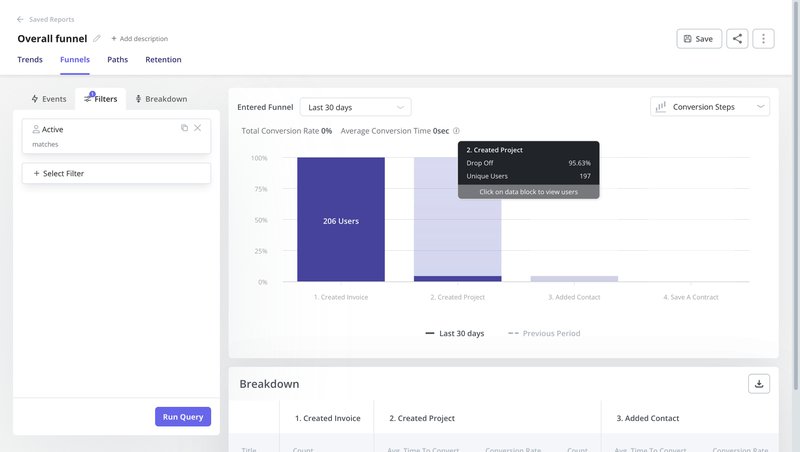
Funnel analysis lets you track user actions across key flows like onboarding, feature adoption, and upgrade journeys. It is ideal if you are tracking conversion and pinpointing friction or abandonment stages.
It will help you answer:
- Where are users dropping off in the onboarding funnel?
- Which step blocks conversion from trial to paid?
- Do users on different plans convert at different rates?
- Are activation flows working across mobile apps and the web?
In Userpilot, you can create funnels using tracked or autocaptured events. You can then filter by user properties or segments to compare performance across groups and pinpoint where users get stuck. This kind of analysis helps you improve retention, boost activation, and reduce churn with confidence.
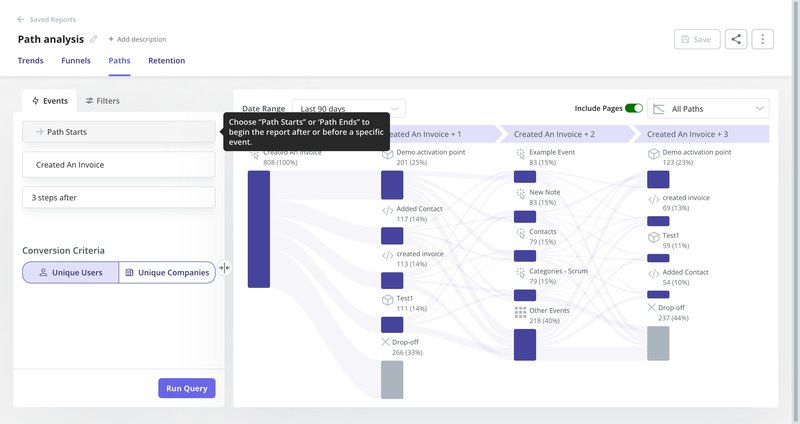
Path analysis report
Path analysis shows you the most common paths users take before or after a specific event. It helps you understand how users actually navigate your product versus the flow you expected.
You can use path analysis to answer questions like:
- What happens right after a user signs up?
- Are users following the guided onboarding path?
- Which sequences lead to feature adoption or churn?
- Do active users behave differently from drop-offs?
In Userpilot, you can define a starting point, such as “Login” or “Start free trial,” and track up to ten steps before or after that event. This gives you a clear view of unexpected paths and helps you spot areas where the user experience can be improved.
Cohort analysis report
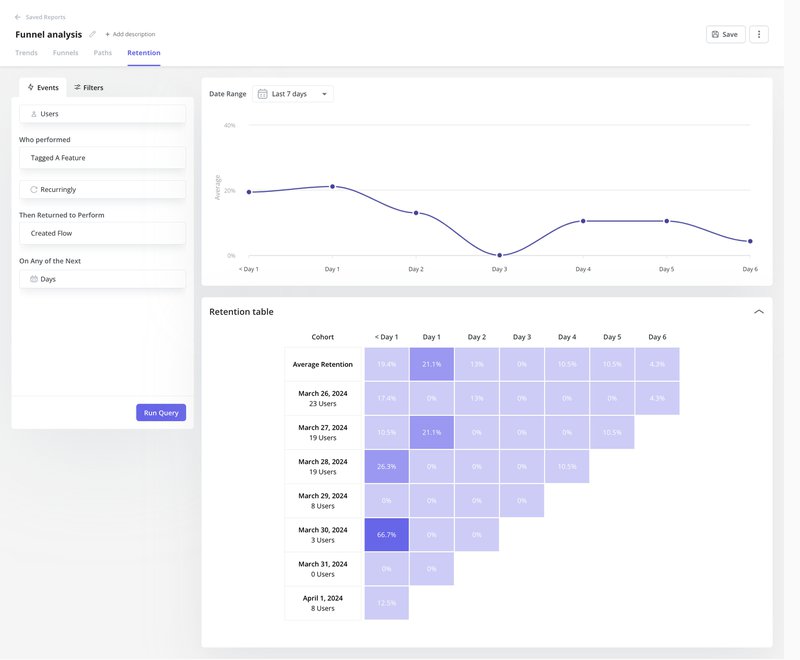
To understand how different types of users engage with your product long-term, use cohort analysis. This method groups users based on shared traits, like their signup date, plan type, or how they were acquired, and then tracks their behavior over time.
It’s the go-to for understanding customer lifetime value trends and loyalty drivers.
This will help you answer:
- How well do acquisition cohorts retain month over month?
- Which features are sticky for long-term users?
- Are trial users converting better after recent updates?
- Do users from specific channels churn faster?
In Userpilot, you can define a qualifying event (such as “Signed up”) and a retained event (like “Used core feature”) to generate retention curves. This helps you uncover high-value behaviors, prioritize features that support loyalty, and strengthen your customer success strategy.
Trend analysis report
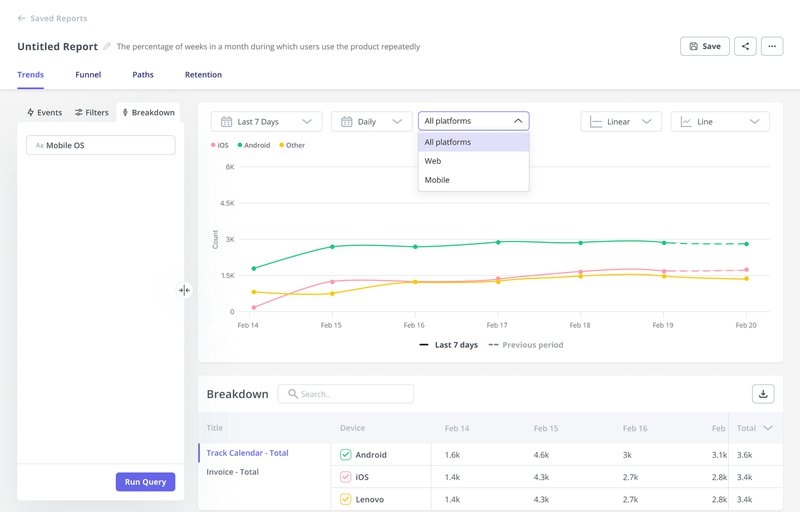
Trend reports help you track how feature usage and engagement change over time. It’s especially useful for monitoring adoption, spotting shifts in behavior, and deciding where to focus your next product update.
You can use trend reports to answer questions like:
- Are users still engaging with a recently launched feature?
- How does usage vary by pricing tier or user segment?
- Are power users increasing or declining?
- What are the adoption trends across mobile apps vs the web?
In Userpilot, you can track trends across daily/monthly active users, key events, and feature usage. Filtering by plan, segment, or lifecycle stage gives you deeper insight into what’s driving engagement, and where there’s room to grow.
User/Company profile report
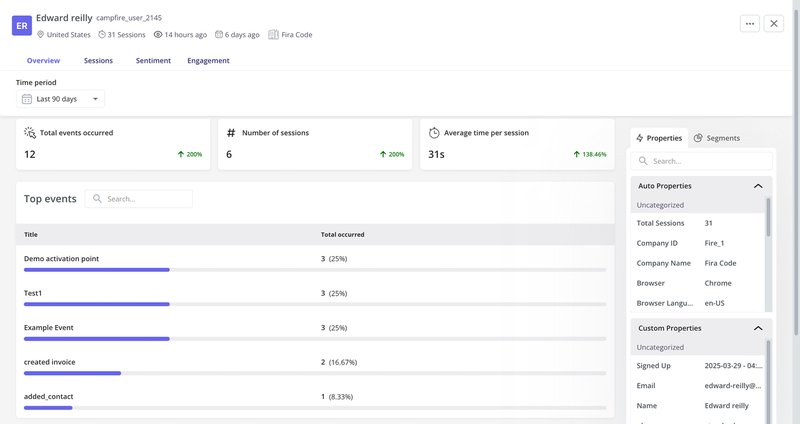
These reports help you zoom in on individual users or accounts. They’re key for personalization, high-touch customer success, and understanding how high-value customers behave.
You can use it to answer:
- What are this user’s top events or visited pages?
- Have they engaged with critical features?
- What’s their survey history?
- Are they active across mobile and web platforms?
Userpilot profiles show you recent activity, survey data, session logs, and company-level insights. You can use them to deliver personalized experiences, upsell opportunities, and boost customer satisfaction.
Segmentation
Segmentation lets you organize user groups based on behavior, usage patterns, or attributes. It’s essential for tracking trends, reducing churn, and running targeted campaigns.
This will help you answer:
- Is the size of churned users shrinking?
- Are enterprise users adopting features faster than SMBs?
- Which segments respond to onboarding better?
- Who’s most likely to upgrade?
In Userpilot, you can segment users based on events, properties, survey answers, or lifecycle stages. Segmentation powers better personalization, smarter targeting, and more effective product messaging.
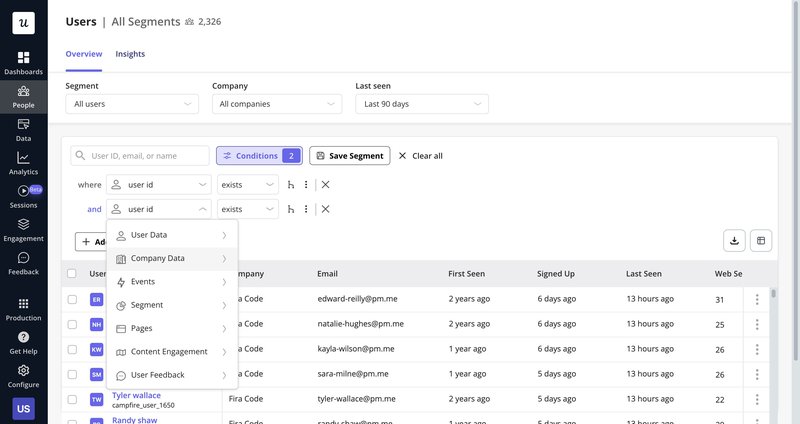
Session replay analysis
Session replay lets you watch real user sessions to observe behavior inside the product experience. It’s beneficial for investigating friction and validating qualitative data insights with real user behavior.
We can use it to answer:
- What did the user do before submitting a low NPS score?
- Why are users abandoning onboarding?
- Did a bug block the upgrade flow?
- Are users engaging with the new UI as expected?
In Userpilot, you can segment users like NPS detractors and watch full replays. You can also leave comments, tag your team, and turn sessions into action items. It’s one of the fastest ways to debug and improve the digital product experience.
What types of data can you track with product analytics tools?
At Userpilot, I rely on five core data types to guide product calls. If the inputs aren’t right, the insights won’t be either.
At Userpilot, we track events, user properties, page views, survey responses, and more across web and mobile. This gives us a complete picture of user behavior across platforms and touchpoints to improve the customer journey.
Event tracking
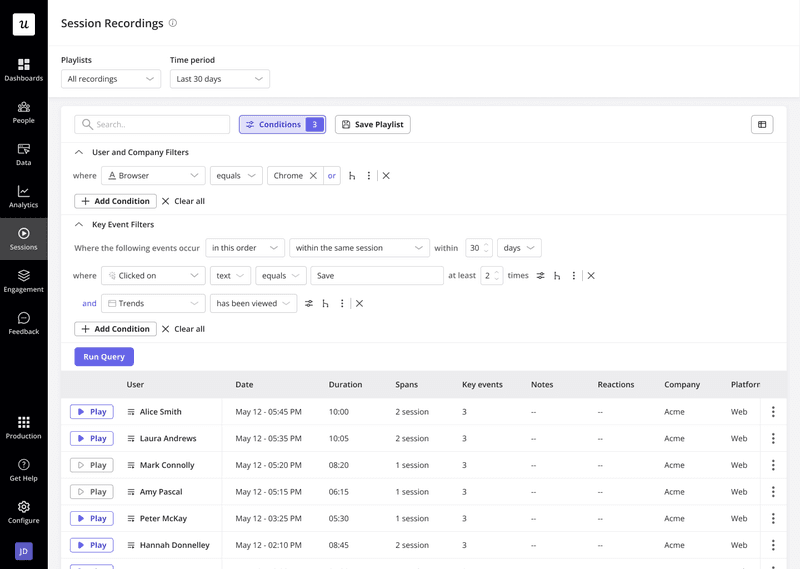
Event tracking captures specific user actions within your product. It’s the core of any product analytics solution and shows you what users do, not just where they go.
In Userpilot, you can track events across both web and mobile platforms:
- On web apps, autocapture collects common UI interactions automatically. You can also add tracked events for custom actions and server-side activities.
- Once the SDK is installed and your token is connected, tracked events record in-app behaviors such as screen views, taps, and key feature usage on mobile.
This data powers everything from funnel analysis to adoption tracking, giving you a clear view of user behavior.
Page analytics
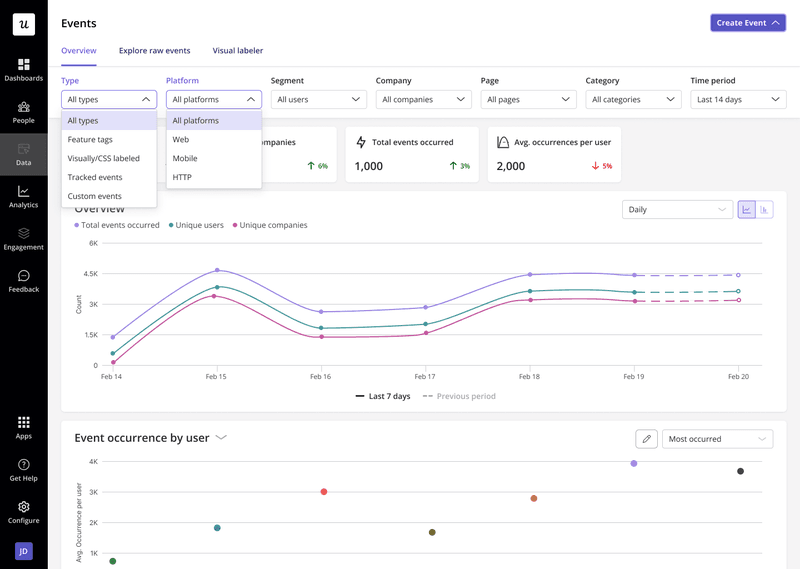
Page analytics shows which parts of your product users visit most. It captures total page views, unique visitors, and your most popular pages or screens.
In Userpilot, you can track both web pages and mobile screens to understand how users navigate your product. This helps you identify high-traffic areas, spot underused pages, and prioritize improvements based on actual usage patterns.
User properties
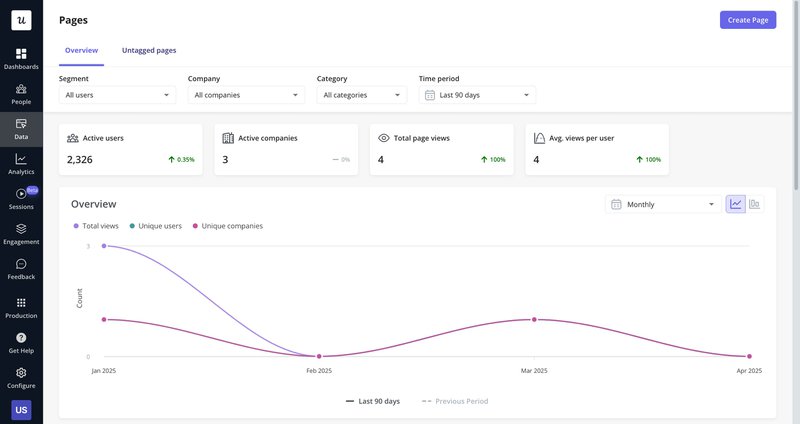
User properties are the attributes tied to each user or account. They help you filter, segment, and analyze data more effectively across your product analytics reports.
In Userpilot, you can use many properties, including user ID, browser, country, pricing plan, number of web sessions, and more. Company-level data and event-based properties are also available.
These properties act as filters across reports, funnels, trends, and segments, making personalizing experiences and uncovering patterns across user groups easier.
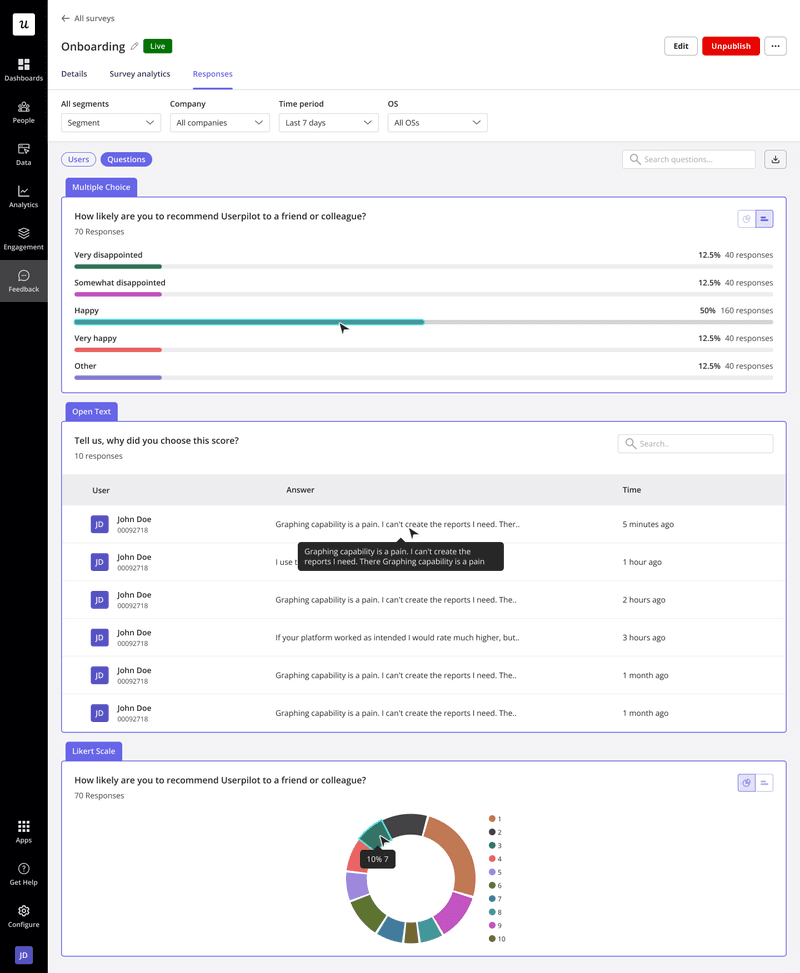
Survey data
Survey data helps you measure user sentiment and capture insights that raw numbers can’t reveal, primarily through open-ended responses.
In Userpilot, you can collect and analyze NPS, CSAT, CES, and custom survey results. You’ll see the percentage breakdown of answer choices and can visualize trends over time to track satisfaction, loyalty, or friction point shifts.
This data type complements behavioral analytics, giving you both the “what” and the “why” behind user actions.
What types of product analytics metrics should you track?
When I think about product analytics metrics, I always start with one question: Why are users coming to us in the first place? That reason should shape what we measure.
It’s not about tracking everything; it’s about tracking what matters. At Userpilot, we align key metrics with actual user outcomes. We start with how customers use our product to do their job, then use analytics to measure how efficiently we’re helping them succeed.
Here are the high-level metrics I rely on to make data-driven decisions and tie product usage patterns to revenue goals and user outcomes:
- Daily and monthly active users (DAU/MAU): Show baseline engagement and help track trends across user segments.
- Customer lifetime value (CLV): Tells us which users drive the most value over time.
- User retention: Measures whether users keep returning, which is essential for tracking product stickiness.
- User engagement: Shows how often and how deeply users interact with key features.
- Product usage: Helps us prioritize based on how different cohorts use the product.
- Growth rate: Tracks acquisition and activation trends over time.
- Revenue metrics: MRR, ARPU, and NDR help connect product performance to business value.
Not all of these are leading indicators, but when combined, they give me the complete picture I need to tie behavior to ROI and decide what’s next.
What does product analytics look like for companies at different stages?
How you apply product analytics depends on where your company is. In early-stage startups, it’s about creating visibility. In mature organizations, it’s about optimization and strategy. Based on what I’ve seen at different stages of growth, here’s how product analytics usually evolves.
- Early-stage startups: Focus on laying the groundwork, tagging events, tracking product usage, and helping product managers answer “What’s happening and where?” You’ll spend most of your time building reports, monitoring key results, running deep dives when something spikes or breaks, and doing quick opportunity sizing based on usage data. You need a lightweight product analytics platform that supports fast iteration and surfaces key user behavior without heavy setup.
- Medium-sized companies and enterprises: Product analytics becomes more strategic. You’ll design and analyze A/B tests, measure feature impact, track advanced interactions, and partner with data engineering. It also involves recommending features based on usage patterns, segmenting high-value customers, and supporting roadmap decisions across teams. These organizations need a scalable analytics platform to support complex journeys, experiments, and cross-platform behavior.
Is Google Analytics enough for product analytics needs?
Short answer? No.
Google Analytics is built for marketing analytics, not product teams. It’s great for traffic sources and conversion goals, but it falls short when you need detailed insights into how users engage with your product.
Here’s why my team doesn’t rely on it:
- Limited depth on user behavior: GA focuses on pageviews and sessions, not granular in-product actions. It aggregates data in ways that miss the nuance of how users interact with features or complete workflows.
- Lacks true product analytics tracking: You can’t easily track feature usage, onboarding completion, or behavior tied to product milestones. Most event tracking requires custom setup and still lacks context.
- Opaque processing logic: Google uses proprietary rules to group sessions and identify users across devices. You don’t get control or visibility into how the data is calculated, which makes it risky to rely on it for product decisions.
You need a dedicated product analytics platform if you care about understanding user behavior, driving feature adoption, or making data-driven product decisions.
What product analytics software should you consider?
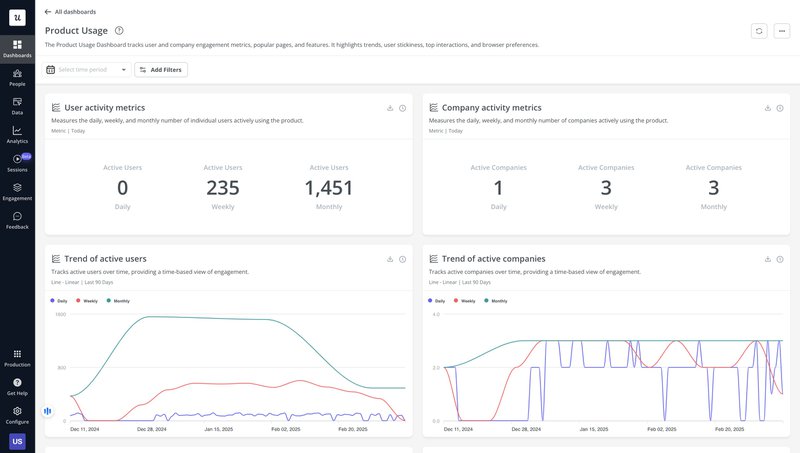
There’s no shortage of good product analytics tools, but not all of them solve the same problem. If you’re looking for an all-in-one platform to track user behavior across web and mobile apps while also powering engagement, surveys, and self-service, Userpilot is built for that.
- Supports cross-platform analytics for mobile and web apps.
- Tracks events automatically (autocapture) and manually (custom events).
- Offers page and screen analytics with no-code setup.
- User and company-level profiles show full activity histories.
- Includes trend, funnel, path, and cohort reports.
- Built-in session replay and segmentation for deep behavioral insights.
It’s what I use every day. Not just because we built it, but because it solved the problems I kept running into with other tools.
Aside from that, there are a couple more product analytics tools you can consider:
Amplitude
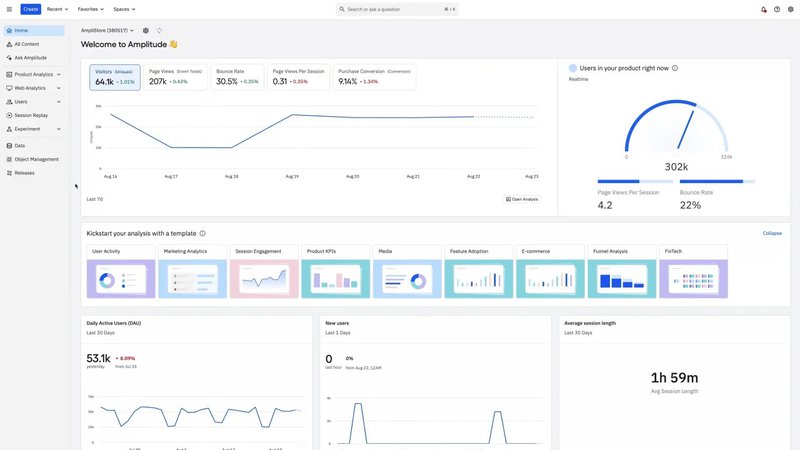
Amplitude is ideal if your team is focused on running experiments and modeling complex product behavior at scale.
- Strong event modeling capabilities.
- Built-in support for A/B testing and feature experiments.
- Custom dashboards for tracking advanced workflows.
- Behavioral cohorts and predictive analytics.
- Integrates well with data pipelines and warehouse tools.
It’s a solid pick for data-heavy teams that need powerful analysis beyond out-of-the-box reports.
Mixpanel
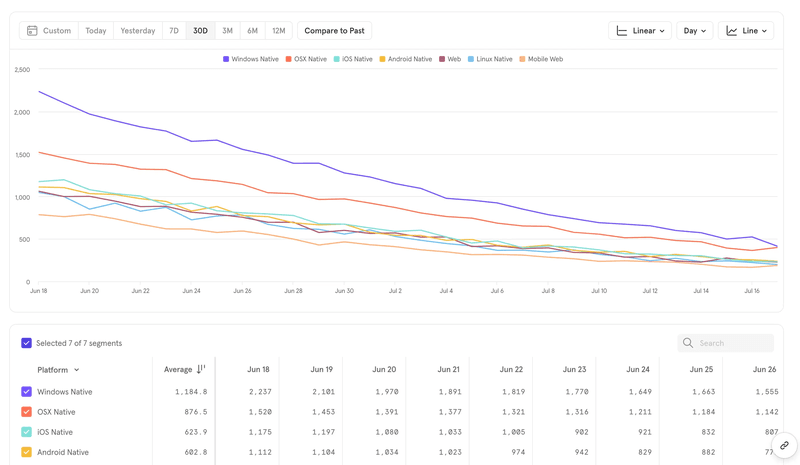
Mixpanel is great if your primary focus is understanding user actions and trends across flows, funnels, and retention.
- Clean UI with easy-to-build funnels and cohorts.
- Real-time event tracking and segmentation.
- Retention and churn analysis tools.
- Useful for identifying power users and drop-off points.
- Integrates with product, growth, and marketing tools.
It’s perfect for teams that want a quick view into how users behave without needing deep customization.
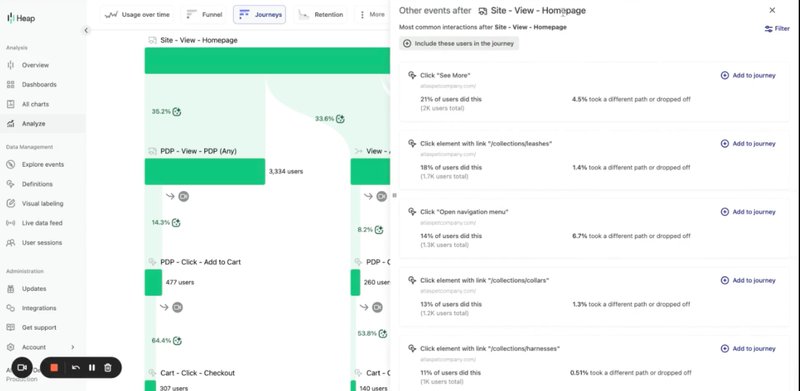
Heap
Heap is best suited for teams that want automated tracking of digital experiences without heavy setup.
- Autocaptures all clicks, page views, and form inputs by default.
- Retroactive analysis lets you build reports on past data.
- Funnels, paths, and heatmaps built on top of captured behavior.
- Ideal for early-stage teams or non-technical product managers.
- Works well for mapping full digital product interactions.
Heap is a strong option if you want analytics coverage without much upfront instrumentation.
Why choose Userpilot for product analytics?
Tools like Amplitude, Mixpanel, and Heap are powerful but often require extensive setup and engineering to obtain fundamental insights.
We built Userpilot as the ideal product analytics solution to give product managers real-time visibility into user behavior, adoption, and friction without the overhead.
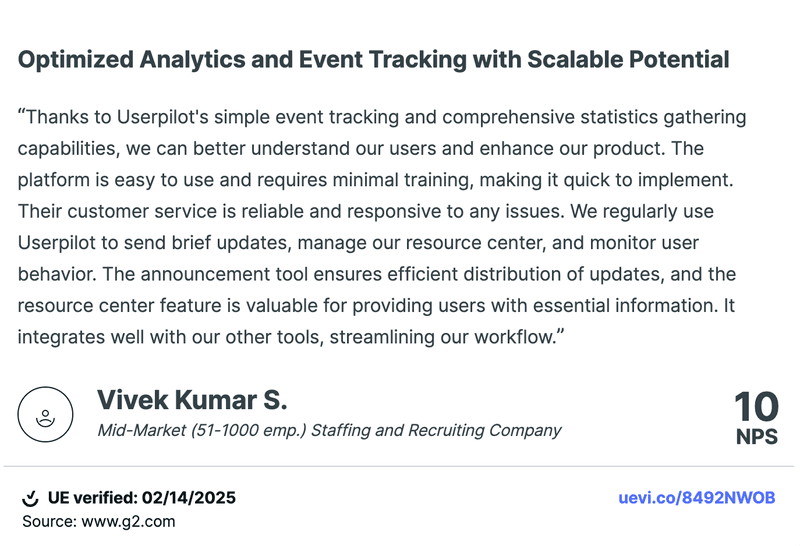
As one of our customers put it:
What we rely on daily:
- Funnel, path, trend, and cohort reports tied to key product metrics.
- Autocapture for instant behavioral data.
- Session replays to understand user drop-offs and friction.
- Segmentation by usage, plan, or feedback.
- A unified view of product usage, in-app engagement, and user feedback.
Userpilot helps product-led teams move faster, optimize user journeys, and make better data-driven decisions. Curious if it fits your workflow? Book a free demo and see for yourself.
FAQ
What is the difference between data analytics and product analytics?
Data analytics is a broad field used to interpret data across business functions. Product analytics is a focused approach to understanding in-product interactions, usage trends, and behavioral patterns within digital products. It helps product managers make informed decisions to improve the user experience and drive outcomes.
What are the 4 types of data analytics?
The four types of data analytics are: descriptive analytics (what happened), diagnostic analytics (why it happened), predictive analytics (what’s likely to happen), and prescriptive analytics (what action to take). These methods support smarter planning across product and business strategy.
What are the levels of product analysis?
Product analysis operates on three levels. User-level analytics track individual user interactions and retention. Feature-level analytics measure how users engage with specific features. Business-level product analytics connect usage data to revenue metrics, customer lifetime value, and overall growth impact.


