10 Practical Strategies to Reduce Churn Rate and Boost Customer Retention


Jason Lemkin, Founder of SaaStr, explains why you must reduce churn rate:
“In most SMB SaaS, churn will eventually drag your growth down to zero.”
Churn occurs when acquisition keeps running, but users never reach the product’s value. That gap burns cash and masks real product issues.
The upside is that churn follows patterns. Teams that improve early activation see clear gains. Userpilot’s SaaS Product Metrics Benchmark Report 2025 shows,
A 19.2% onboarding completion rate, which indicates a major drop-off before users reach their ‘Aha!’ moment.
In this blog, I’ll walk through 10 practical strategies to reduce churn rate and improve retention. Catch pre-churn signals, guide users with contextual onboarding, and use behavioral data to intervene.
What is churn rate?
Churn rate is the percentage of customers or subscribers who stop using your product over a specific period. In SaaS, it’s tracked monthly or annually as the customer churn rate.
The calculation is simple: Churn rate = (Customers lost ÷ Customers at the start of the period) x 100
For example, if you start with 1,000 users and 50 leave during the month,
Churn rate = 50/1000 x 100 = 5%. That’s 5% churn.
While churn shows how many users left over a specific period, retention shows how many continued using the product. When users leave, it usually means one of three things happened earlier:
- Users never reached their ‘Aha!’ moment.
- Key actions were too hard to complete.
- They stopped seeing ongoing value.
This is why acquisition without customer retention becomes wasted capital. Scaling traffic while users fail to activate burns budget and distorts product data, making it hard to tell if the problem is the product or the audience.
One of the biggest mistakes I see teams make is treating churn as a cancellation issue. Ask yourself:
- When did this user first get stuck?
- When did their usage start dropping?
- When did they stop logging in regularly?
Churn reflects earlier product decisions around onboarding, engagement, and value delivery. That’s why I consider churn as a system failure, not a UX flaw.
Voluntary churn vs. involuntary churn
Companies report a 12% annual churn rate on leading platforms. Now, the question is: is it their product or just a payment hiccup? Understanding this is key to focusing your retention efforts.
Broadly, churn falls into two categories:
Voluntary churn (behavioral)
This is the churn that really matters to product teams. It’s when users actively decide your product doesn’t deliver value. Maybe they never hit their Aha moment, skipped key actions, or got frustrated with friction. This is where activation, engagement, and value delivery make a real difference.
Involuntary churn (mechanical)
Involuntary churn occurs when users leave for reasons outside your product, such as failed payments, expired cards, or billing errors. Even if users find value in your product, failed subscriptions prevent you from collecting revenue.
Note: This article doesn’t cover pricing churn, ICP mismatch, or sales-driven churn, because no amount of onboarding fixes a bad fit. 😇
10 Practical, product-led strategies to reduce churn
Churn hits revenue long before it shows up in dashboards. The 10 strategies below reflect what I’ve learned from diagnosing disengagement patterns before cancellation ever happens.
1. Use analytics to diagnose churn patterns
Before I try to save users, I want to see churn forming. That means looking at behavior patterns early and spotting the moments when users start losing momentum.
Cohort analysis helps me see which groups retain and which drop off. For example, 70% of users who completed onboarding were still active after one week, compared to 45% of users who didn’t. This tells me I need to improve onboarding completion and nudge users toward their first key action.
I rely on trend reports to spot “login gaps.” For instance, if historical data shows that 80% of users who haven’t logged in for 14 days eventually churn, you have identified your intervention point. Move from asking “Why did they leave?” to “What are they doing right now that signals they will leave?”
Using cohort analysis, I track these pre-churn signals across time:
- Incomplete onboarding flows or skipped tutorials.
- Partial feature adoption.
- Sudden drop in logins.
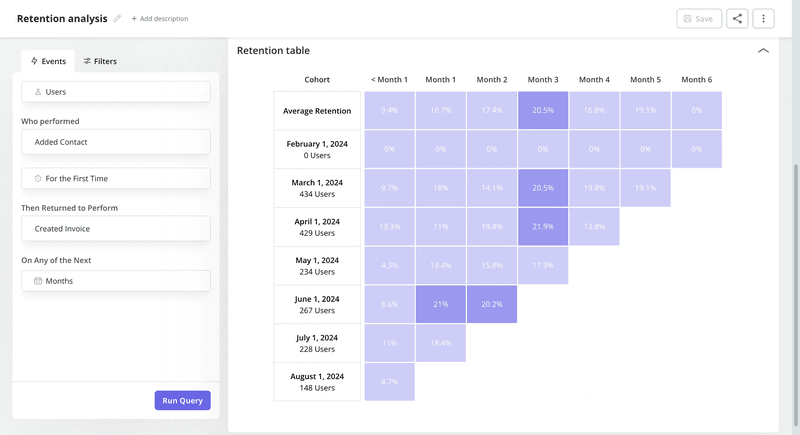
Because cohorts update dynamically, I can see how changes in onboarding flows, checklists, or in-app guidance affect customer retention trends week over week.
2. Speed up onboarding to deliver early value
High churn rate in the first 30 days usually isn’t a retention problem; it’s an activation problem. About 55 % of new SaaS users churn within the first 30 days because they don’t find value.
Segment-specific onboarding fixes what generic flows can’t. Different personas get guided in ways that matter to them. For example, when a growth manager signs up, they want proof that your product will move a metric they care about. So the onboarding flow is built around reaching that proof fast.
On first login, they answer one goal-setting question. The onboarding checklist then adapts to guide them toward a single outcome, like tracking a key event or launching their first in-app experience.
Micro-workflow for a new user:
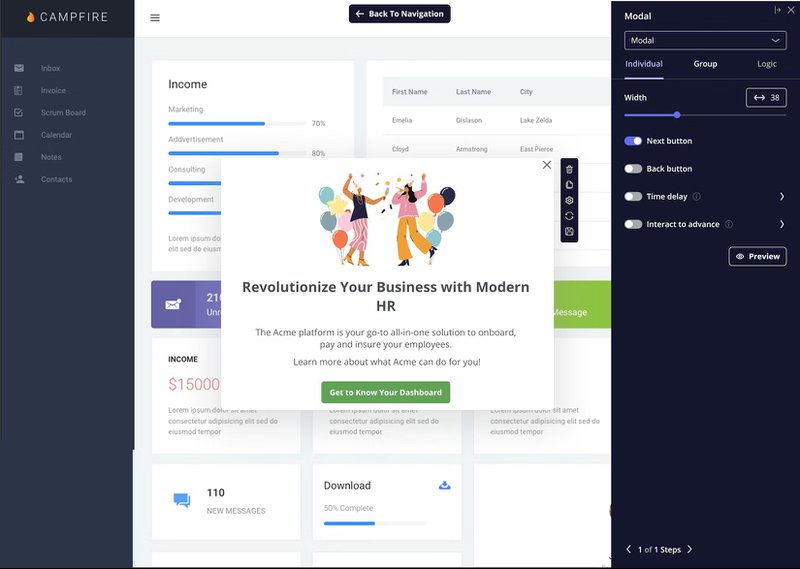
- First login: Greet them with a friendly welcome modal.
- Guided checklist: Show 2–3 critical actions to deliver value.
- Feature highlight: Use spotlights and hotspots to draw attention to the most impactful feature.
After designing segment-specific onboarding and micro-workflows, the way to know what works is to A/B test onboarding flows.
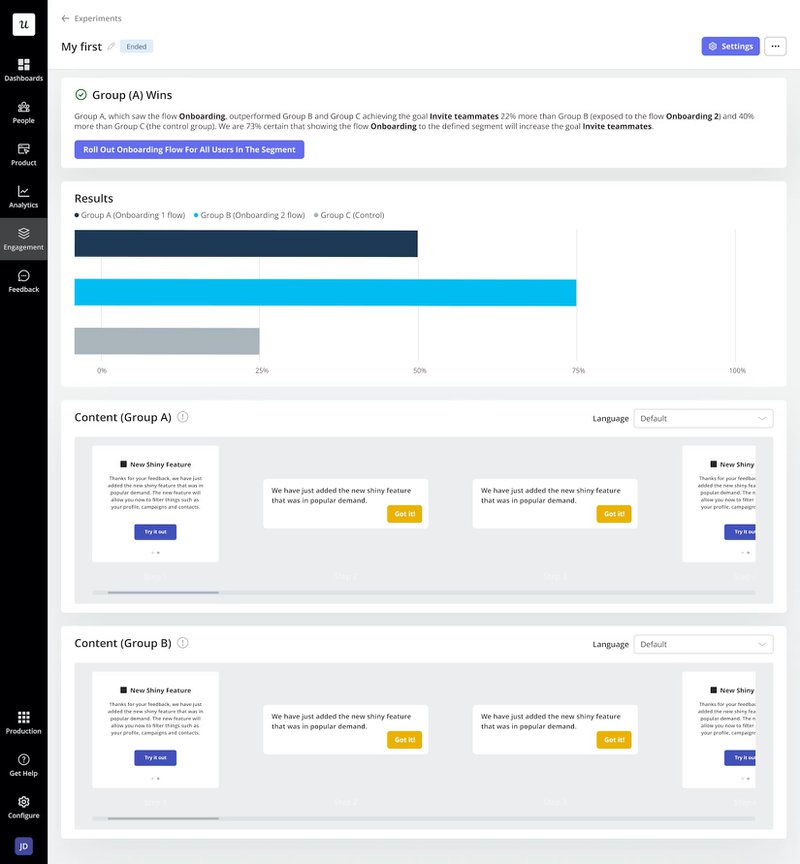
Split new users into two groups: Group A sees a more guided checklist with tooltips, while Group B follows a lighter path with fewer prompts.
If Group A drives a 10% higher activation rate, the more guided flow wins.
How Kontentino increased new user activation by 10%?
Kontentino realized that most drop-offs happened before users completed two critical actions: connecting their social accounts and scheduling their first post. Without those steps, activation stalled and retention suffered.
To tackle this, Kontentino built an interactive onboarding experience. Tooltips and driven actions showed users exactly what to do and where to click, helping them connect accounts and schedule posts. Along the way, small touches like a friendly welcome screen and celebration GIFs after completing a step added a bit of delight and motivation.
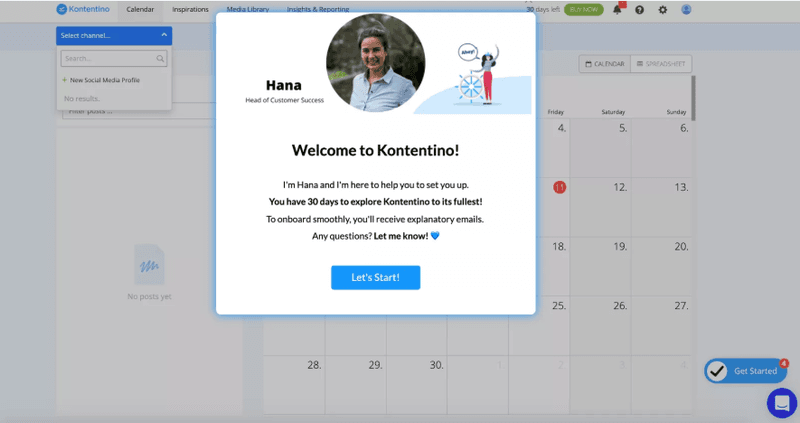
By aligning onboarding with the core activation moments, the product became stickier and increased engagement. Within the first month of launching this guided experience, Kontentino saw a 10% increase in new user activation.
3. Segment users for contextual engagement
I segment users based on behavior, not demographics or account type, so every message meets users where they are. Behavioral segments help me act on intent.
- A stuck user needs guidance.
- A user who is exploring needs momentum.
- A user who goes quiet needs a reason to return.
Here are the three segments to rely on most:
Trial users: These users are still evaluating fit. I segment them by whether they’ve completed early activation actions, like creating a project or connecting an integration. If they haven’t, the goal is simple: guide them to one clear win fast. Early success keeps them hooked.
Inactive users: Inactivity is an early warning, not a dead end. I segment users who stop logging in or skip key actions, then re-engage them with prompts tied to exactly where they stalled. Timing here is what separates recovery from churn.
New feature adopters: Shipping features to everyone rarely works. I target users most likely to benefit based on behavior, and surface guidance only when it’s relevant. Adoption improves without overwhelming the rest.
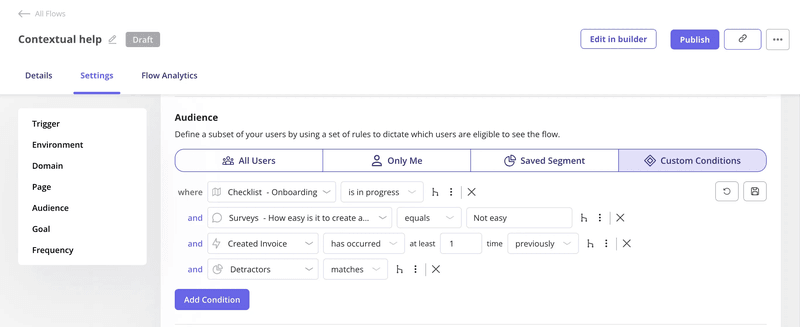
To do this effectively, I use segmentation feature. It lets me define groups based on precise actions and events, combine multiple conditions, and deliver context‑aware experiences exactly when users need them.
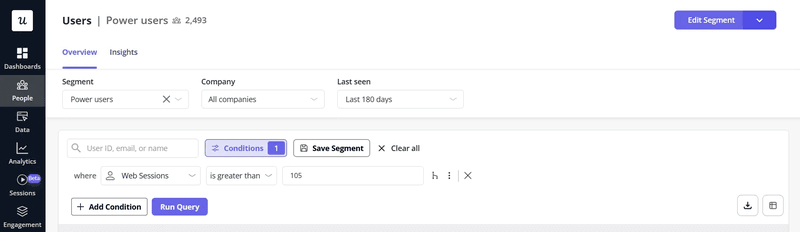
For example:
- Combine conditions: Users who signed up 7 days ago and haven’t completed onboarding.
- Target by events: Track using custom events like Task_Completed or Project_Created to see what users have or haven’t done.
- Use lifecycle stages: New users, at‑risk users, or power users, based on behavior patterns.
- Tie segments to experiences: Launch modals, tooltips, or checklists for a segment at the exact moment they hit a trigger.
This way, you are not guessing. Engagement becomes contextual, measurable, and proactive!
4. Re-engage inactive users with triggers
I’ve learned that waiting until a user cancels is too late. Instead, track pre-churn signals like a sudden drop in logins, and trigger contextual onboarding with relevant nudges to bring users back.
Detecting inactivity is all about defining behavioral thresholds. For example, I look for:
- No login in 7 days: The user hasn’t opened the app in a week.
- Key action missed: They started onboarding but didn’t complete a crucial task.
- Feature abandonment: They interacted with a feature once but haven’t returned.
When these triggers fire, I send messages or show in-app modals that feel timely and relevant. It could be a “Welcome back” checklist, a native tooltip guiding them to an unfinished task, or a small incentive.
I can set up these triggers based on specific events or time-based inactivity. The platform lets me automatically target prospects and deliver experiences at the right moment.
5. Capture continuous feedback at key moments
The smartest way to catch issues early is to collect feedback as users engage with the product. Doing it at the right moments gives context and shows why a user hesitated or dropped off.
I usually focus on key milestones, like:
- Inviting a teammate for the first time.
- Hitting a login streak milestone (e.g., 7 days in a row).
- Attempting an export, integration, or automation.
For instance, if a user struggles to upload a file, a short in-app survey asking “Did something block you?” can reveal confusion, missing guidance, or feature gaps.
Typical in-app survey response rate in 2025 was 27.52%, meaning even a fraction of users can give actionable insights. A single piece of feedback at the right moment helps pinpoint friction before it turns into churn.
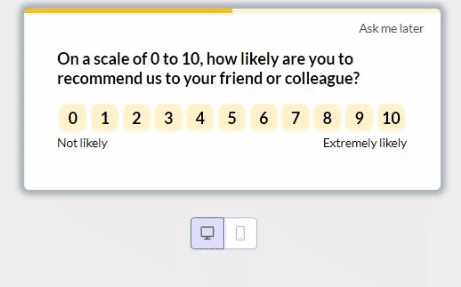
Ideally, the tool classifies responses into Promoters, Passives, and Detractors based on their score.
- Promoters (9-10): Loyal customers who actively promote your product.
- Passives (7-8): Satisfied but not enthusiastic customers.
- Detractors (0-6): Dissatisfied customers who may churn and spread negative feedback.
Over time, these signals form a feedback map. I can spot patterns across cohorts, see which steps consistently cause hesitation, and prioritize fixes that improve activation and retention.
How Unolo reduced customer churn by up to 1% with NPS survey
Unolo saw its churn holding around 3% month-over-month, and the team knew something had to change. Email and chat surveys weren’t yielding insights because users weren’t responding.
Unolo implemented in-app NPS surveys, which appeared while users were actively engaged with the product. Monitoring responses through the NPS dashboard enabled Unolo to quickly identify at-risk users and act on negative feedback before it led to cancellation.
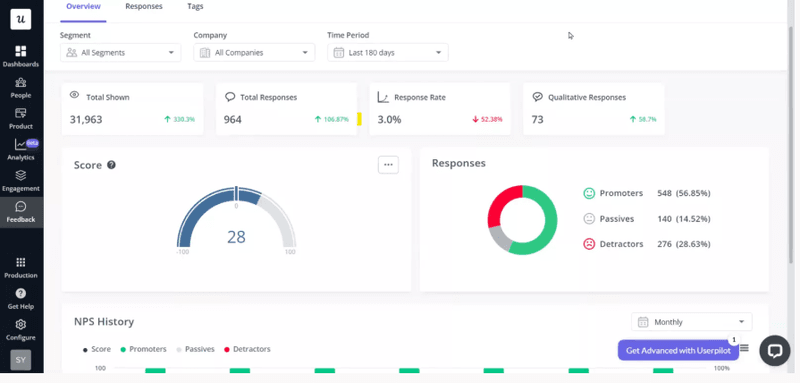
Within a month of introducing in-app NPS, Unolo reduced its churn by up to 1% and saw a 44% survey completion rate.
6. Turn path analysis into optimization plans
Path analysis helps map real user journeys step by step. Not the happy path we design, but the messy paths users take in production.
If most retained users follow one sequence of actions and churned users break away at a specific step, that step becomes the focus. That skipped or abandoned step is where cognitive load spikes or value becomes unclear. Once the friction point is clear, the next move is simple:
- Remove unnecessary steps.
- Reorder actions to surface value earlier.
- Add just-in-time guidance at the exact moment users stall.
For example, if users who complete Action A and Action B within the same session retain at a much higher rate, optimize the experience to guide users through that sequence. That might mean collapsing steps, simplifying copy, or making the next action unmistakably obvious.
You can also compare paths across segments. New users, power users, and at-risk users rarely behave the same way.
Path analysis shows the sequence of actions users take before or after a key event. You pick a milestone, like completing onboarding, publishing a report, or scheduling the first post, and path analysis maps the steps around it.
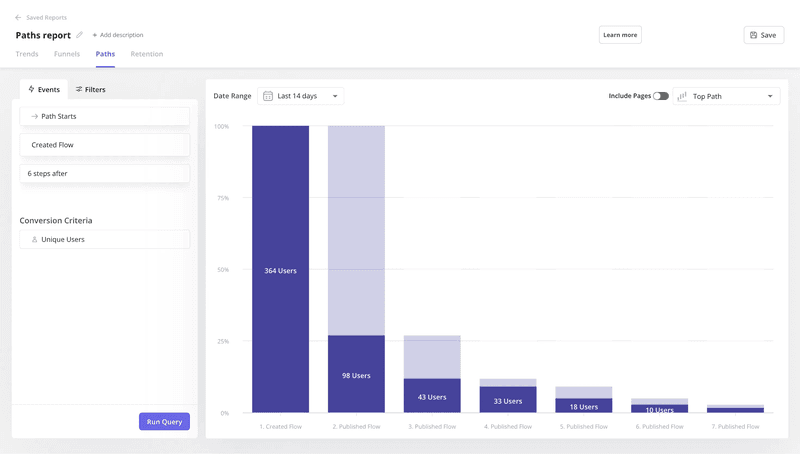
Here’s why that’s useful for reducing churn rate:
- Reveal entry points: Understand where users first land and whether that leads them toward value.
- Track next actions: See what users actually do after signing up.
- Spot drop-off steps: Identify exact moments where users abandon a journey.
- Uncover activation drivers: Discover which sequences lead to valuable outcomes so you can reinforce them.
7. Reduce cognitive load at the exact moment users feel smart
Another churn rate driver I’ve seen is this: new customers feel competent, and we overwhelm them with more options. They finish a key action, feel a small win, and the product responds by throwing five new features at them. Confidence peaks, clarity drops, and usage quietly reduces.
From a retention lens, this moment matters more than it looks. New customers have reached their “I get it” moment, but they haven’t yet built a habit.
Design this phase around intentional restraint. Once a user hits the activation event tied to the North Star Metric, slow everything down, so momentum doesn’t collapse under cognitive load.
Pro tip: Friction kills engagement. Embed your knowledge base article directly into your app via a resource center so users can unblock themselves instantly.
The rule here is, “less is more.” Practically, that means:
- Limiting feature exposure immediately after activation.
- Using progressive disclosure instead of full feature reveals.
- Guiding attention to one reinforcing action, not the entire product surface.
For example, after new customers complete a core workflow, avoid launching another walkthrough. Instead, validate the win and surface a single, contextual next step that deepens the same behavior.
Use interactive flows that guide users to complete specific, value-driving actions rather than subjecting them to a lecture. By setting up flows that depend on user milestones, you can delay advanced feature education.
- Trigger flows only after a user completes a meaningful action.
- Hide advanced features until users show readiness through behavior.
- Reinforce the same successful action before introducing a new one.
That means no unsolicited tours right after activation. Just the right cue at the right moment.
8. Use micro-commitments to increase long-term stickiness
“Small commitments lead to bigger future engagement,” says Robert Cialdini’s Consistency Principle.
In SaaS, this plays directly into stickiness. The degree to which users habitually return and engage with your product. Stickiness matters because it signals ongoing value realization and predicts long-term retention.
To harness this, focus on designing micro-commitments throughout early and mid-stage user journeys. They don’t demand deep effort upfront, but they create a sense of ownership and progress.
Examples of effective micro-commitments:
- Asking users to set preferences or choose topics they care about during onboarding.
- Prompting users to build a custom dashboard or default view.
- Letting users tag a few items as favorites or areas of interest.
- Encouraging a quick profile setup choice, like selecting a role or use case.
When someone invests just a little, “Yes, this is how I want it set up,” they begin to internalize the product as “their” tool.
I design guided flows that ask users to personalize or configure something meaningful. These flows are placed at moments of momentum, such as right after setup or a small win.
- Flows appear only when the context makes sense.
- Users act because it feels helpful, not because they’re being pushed.
That’s how small choices turn into habits and habits turn into long-term stickiness.
9. Make retention a cross-functional metric
Retention is a shared outcome, informed by signals that show up long before churn rate does.
That starts with shared visibility. When product, marketing, support, and sales look at the same retention view, conversations become transparent. Instead of asking “Why did churn spike last month?”, teams ask “Where are users slowing down right now?”
Focus on leading indicators, such as activation rate, time to first value, or usage depth after onboarding. These signals create a common language.
- Product team sees friction.
- Customer support notices confusion.
- Marketing perceives mismatched expectations.
And teams can act on the same signals before churn shows up.
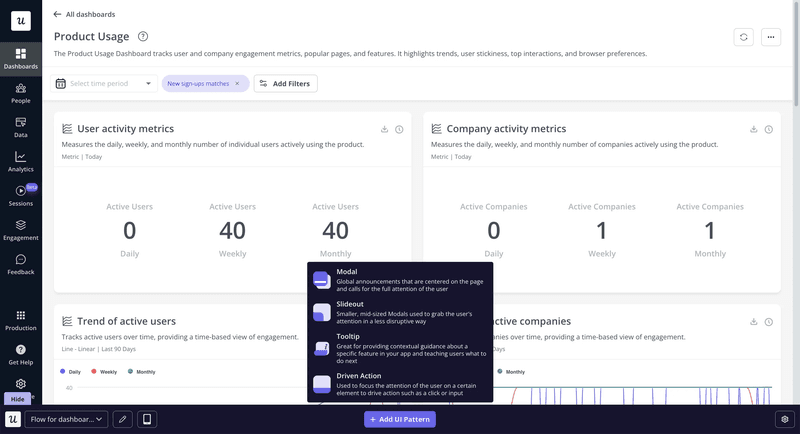
Custom analytics dashboards let me align teams around the same leading indicators.
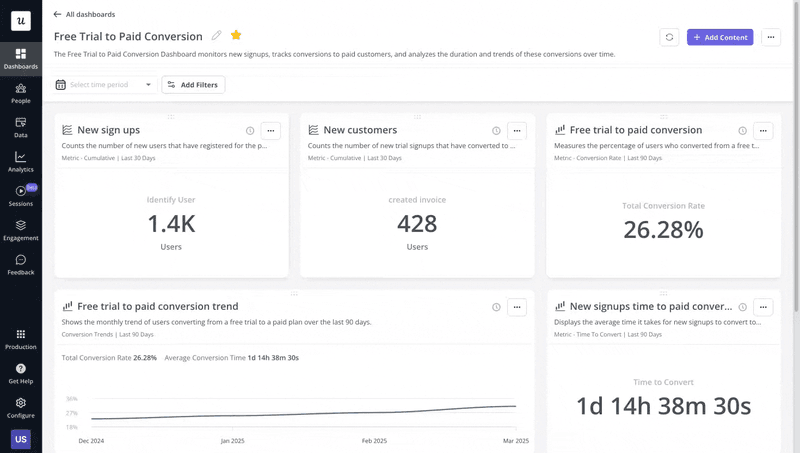
- Free trial to paid conversion: Define a signup event and a trial conversion event to track new signups, paid conversions, and how long users take to convert over time.
- Feature engagement: Monitor usage trends, adoption rates, and retention tied to specific features.
- Expansion revenue and upgrades: Track upgrade events to understand expansion patterns and user behavior before and after upgrades.
When these metrics live in a shared dashboard, retention conversations move from blame to action.
10. Close the loop with qualitative and quantitative insights
Always cross-reference survey responses with product behavior. A low NPS score on its own is vague. That same score tied to usage patterns becomes actionable.
For example, if detractors consistently struggle to reach a key activation event or drop off after the same step, the problem is no longer “customer satisfaction.” It is a specific experience or value gap I can fix.
The workflow is simple and repeatable:
- Start with feedback at moments of intent.
- Group responses by behavior.
- Look for overlap between friction points and negative feedback.
Say users who rate the product 6 or below skip a core feature or abandon setup halfway. That combination tells where to focus: onboarding clarity, feature discoverability, or perceived value.
Enter session replays. Session replays let you see real user behavior tied to real feedback.
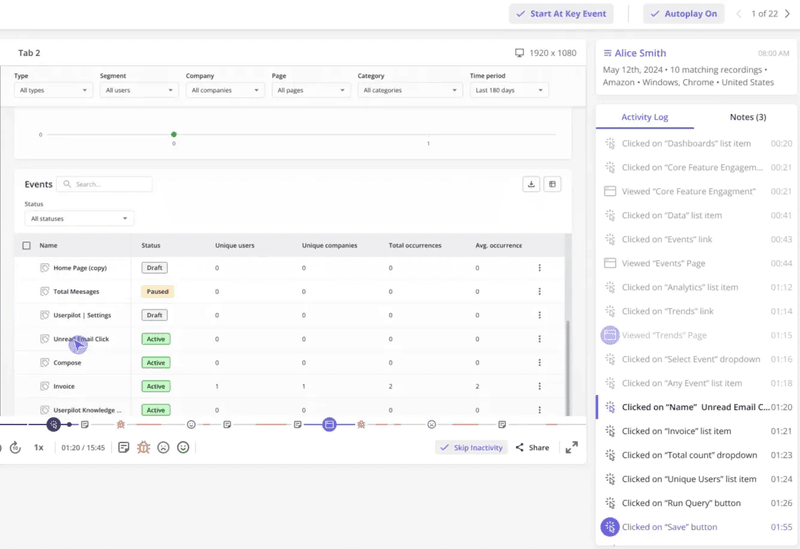
Here’s how I use it in practice to reduce customer churn:
- Watch sessions of detractors right before they submit low NPS or CSAT.
- See cursor movement, rage clicks, hesitation, and abandoned actions.
- Spot where users loop, stall, or misinterpret an interface element.
- Connect those moments back to analytics events and survey responses.
If I joined a new product tomorrow, here’s what I’d do…
I wouldn’t start with new features or big roadmap ideas. I’d start with retention, and keep it extremely practical. This would be my personal playbook:
- Review 30/60/90-day retention cohorts
I’d track how many users remain active 30, 60, and 90 days after signup to pinpoint where engagement drops and value breaks down. - Identify the first value action
Pinpoint the one action users must complete to feel the product “click.” One clear moment that correlates with higher Week-1 retention. - Audit onboarding segmentation
Review user activation metrics to see which segments reach the first value action and which ones stall early. Different personas need different paths to value. - Pick one inactivity trigger
I’d choose a single, high-signal moment like no login in 7 days or a skipped tutorial. - Align on one leading indicator
Pick a single metric that signals retention before churn hits. Activation rate, key feature adoption, or time-to-value, and get the team aligned on it.
If you get these five things right, retention stops being a mystery and starts becoming something you can actually influence.
You don’t fight churn, you design it out
From what I’ve seen, churn isn’t caused by one big failure. It shows up where users stop finding value, where experiences stall, and where onboarding steps are skipped.
Reducing churn is a continuous loop of hypothesis, implementation, and measurement. Analyze your funnel reports, identify where users drop off, fix the issue, and track the results.
Setting up Userpilot lets you capture behavior insights, deliver the right guidance at the right moment, and turn retention from a reactive scramble to a proactive system. When you design for value instead of fighting churn, every tweak compounds.
Users stay, engage, and grow with your product naturally. Book your free Userpilot demo today!
FAQ
What does a 20% churn rate mean?
A 20% churn rate means that 20 out of every 100 customers you had at the start of a period stopped using your product during that period. Here’s how it’s calculated:
Churn rate = (Customers lost ÷ Customers at the start of the period) × 100
Let’s say:
- Customers at the start of the period = 500
- Customers lost = 100
Therefore, churn rate = 100/500 x 100 = 20%
How to reduce customer churn in the first 30 days?
Focus on activation and early value to retain customers:
- Guide users to their first Aha moment quickly.
- Segment onboarding flows by persona.
- Track key actions and intervene if users stall.
- Deliver contextual support to prevent early drop-offs.
Is churn a KPI?
Yes. Churn is a leading indicator of retention health, helping teams measure whether users are finding ongoing value. It’s best paired with activation, engagement, and feature adoption metrics for actionable insight.
What is a healthy churn rate?
A healthy churn rate is one where your product consistently retains users who find value. It’s a measure of whether your retention efforts and onboarding are working effectively. A healthy churn rate is considered to be 5% across industries.
About the author