Try Userpilot Now
See Why 1,000+ Teams Choose Userpilot

The different stages of the SaaS conversion funnel
First off, the conversion funnel consists of several stages—each critical for the entire sales process.
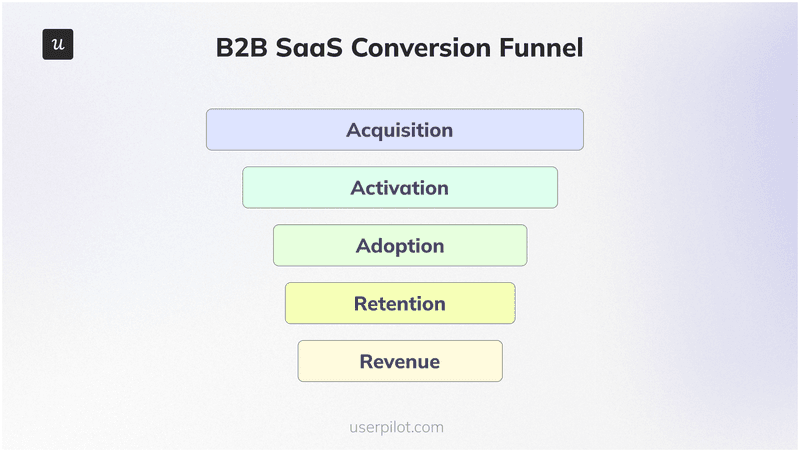
Tracking metrics from these stages will allow you to monitor performance, identify bottlenecks, and optimize for higher sales funnel conversion rates.
That said, let’s explore each of them:
Acquisition
Acquisition is the top of the funnel, where prospects become new users.
The goal is to attract high-quality traffic and convert a website visitor into a trial user, marketing-qualified lead (MQL), or sales-qualified lead (SQL). And it involves marketing strategies, promotions, and outreach efforts to create awareness and generate leads.
Key metrics to track at this stage include:
- Website conversion rate: Percentage of website visitors that convert into leads or trial users.
- Customer acquisition cost (CAC): The amount you spend in marketing and sales efforts to acquire each lead or customer.
- Lead-to-trial conversion rate: The percentage of leads that start a product trial.
Activation
Activation is the stage where new users take the first meaningful action with your product and convert it into active users through onboarding processes or live demos.
At this stage, the focus is on ensuring users realize the core value of your product quickly, for which you need to monitor the following metrics:
- Activation rate: Percentage of users who take a meaningful first step and experience an AHA! moment (e.g., completing onboarding or using a key feature).
- Time-to-value: The time it takes for a user to experience the core value of your product.
- Onboarding completion rate: Percentage of users who finish the onboarding process.
Adoption
Adoption refers to the phase where customers start using your product regularly, making it critical for long-term customer retention and product stickiness.
The focus here is on enhancing the customer experience and providing proactive support. For which you want to monitor key metrics like:
- Feature adoption rate: Percentage of users actively using a key feature of your product.
- Product engagement rate: How frequently users interact with your product over a given period.
- Number of active users: Total count of users regularly engaging with your product.
Retention
Retention measures how effectively you’re keeping users over time. A high retention rate indicates strong product value, while a lower rate may suggest issues with user experience.
Improving retention can involve continuous customer support, updates, mobile onboarding and secondary onboarding—as well as keeping track of metrics like:
- Customer retention rate: Percentage of users who continue using your product after a given period.
- Churn rate: The percentage of users who stop using your product within a specific timeframe.
- Cohort retention analysis: Illustrates the retention of different user groups over time.
Revenue
Revenue is the bottom of the funnel, where your sales process converts engaged users into paying customers. Here, customers are encouraged to upgrade their plan with your sales team and share their positive experiences with others with referral programs and communities.
This stage also focuses on maximizing revenue through upselling, cross-selling, sales performance, and MRR expansion strategies.
Key metrics to track here include:
- Average revenue per user (ARPU): The average amount of revenue generated per user.
- Customer lifetime value (LTV): The total revenue you can expect from a customer during their time using your product.
- Free-to-paid conversion rate: Percentage of freemium users who upgrade to a paid plan.
Important B2B SaaS funnel conversion benchmarks to know
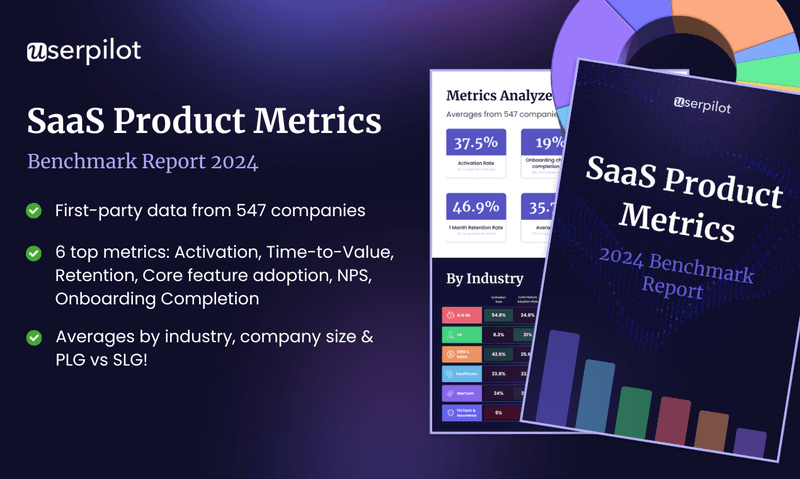
Userpilot’s SaaS metrics report shows the benchmarks of multiple metrics like time-to-value and activation rate in different industries and revenue sizes—you should check it out to guide your decisions.
Now, let’s go over the industry benchmarks so you can gauge how competitive your product is in the market.
Website conversion rate
Top B2B companies have an average conversion rate of 11.70%.
This means that for every 100 visitors to their website, about 12 will convert into leads or trial users.
Achieving the conversion rate of top companies is not only about having a well-optimized website with clear CTAs, engaging content, and user-friendly design. It’s also about building such a brand reputation that makes most visitors have a pre-made idea of what your business is about.
Activation rate
According to Userpilot’s product metrics benchmark report, the average activation rate across SaaS businesses is 37.5%.

If your activation rate is lower than this benchmark, it might be time to think about how you can provide more value during the onboarding process.
However, when looking deeper at the report, you’ll find that about 80% of the companies that had over 50% activation rate included a video, GIF, or animated image in their onboarding flow—why not try it?
Freemium conversion rate
Freemium models typically see conversion rates ranging between 1% and 10%, according to OpenView’s benchmarks.
While this might seem like a low percentage, it’s expected, given that many freemium users never intend to pay.
However, if you focus on delivering more value early and triggering upgrade prompts at the right moment, you can push this rate closer to the 10% benchmark.
Feature adoption rate
In Userpilot’s benchmark report, the average feature adoption rate is 24.5%.

A low feature adoption rate could indicate that users are not engaging with your product’s most valuable elements. This can be due to poor onboarding, unclear product UI, or lack of customer education.
However, adoption rate is a metric that can vary a lot depending on your industry. Here’s how different industries compare:

Retention rate
The Userpilot’s benchmark also reports that the average month-1 retention rate in B2B SaaS is 46.9%.

A lower retention rate might suggest that your product doesn’t feel valuable in the long term, or there may be issues with user experience that lead to churn.
But just like adoption rates, retention can also vary from industry to industry (especially when you compare healthcare with insurance).

How can SaaS companies optimize funnel conversion rates?
Once you start tracking the entire funnel and compare its key metrics with our benchmarks, you’ll be able to find bottlenecks and start optimizing your funnel conversions.
For this, here are some valuable tips that can significantly improve your product performance and help you meet or exceed industry benchmarks:
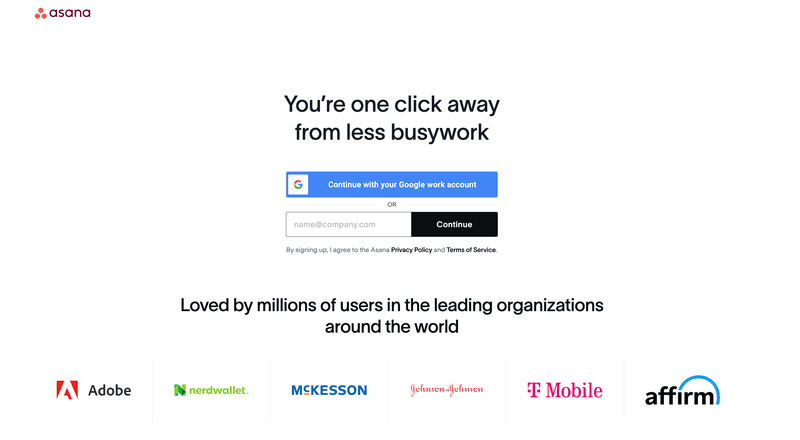
- To improve acquisition, minimize form fields during signup to create a frictionless signup process.
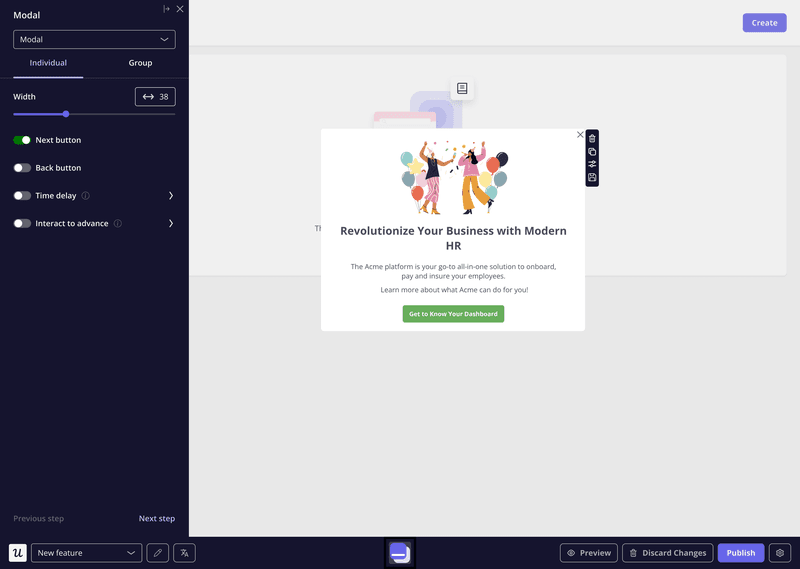
- Implement interactive walkthroughs to guide users through key features and ensure they experience value early on for better activation rates.
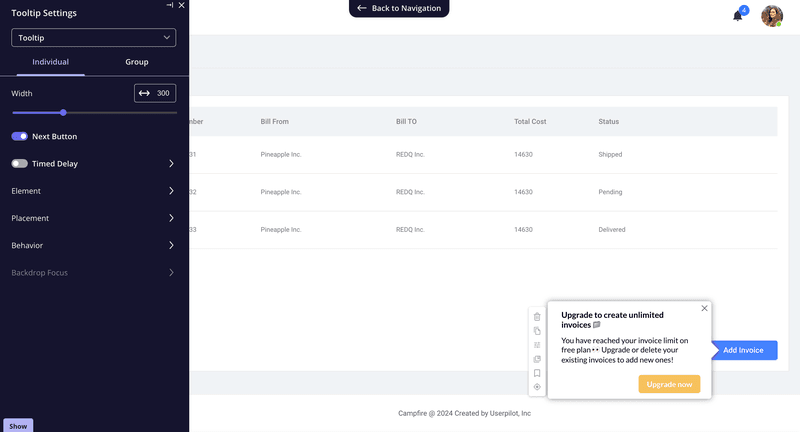
- To increase revenue, use a user engagement tool (like Userpilot) to trigger upgrade messages at the right time and encourage free users to convert into paid customers.
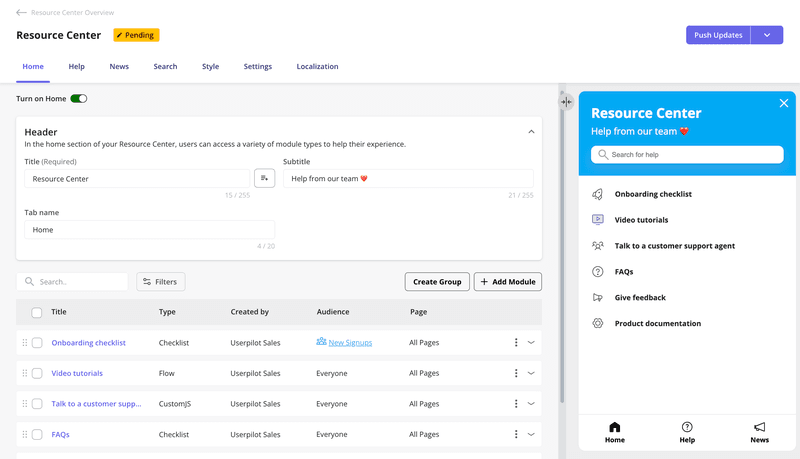
- To enhance retention, anticipate user needs, and provide proactive support before users encounter issues—improving retention.
Conclusion
The B2B SaaS funnel conversion benchmarks can help you optimize your business and stay competitive.
Remember, by monitoring the different stages of the funnel and aligning your performance with industry benchmarks, you can identify the right areas to optimize and drive better results.
Want to see how Userpilot can help you monitor your conversion funnel without code? Book a demo to add videos to your onboarding flows and trigger upgrade prompts!
FAQ
What is a funnel conversion?
A funnel conversion refers to the process of moving a lead or user from one stage of the funnel to the next, such as from visitor to lead, lead to user, or user to paying customer.
Why monitor funnel conversion rate benchmarks?
Monitoring benchmarks helps you understand how your funnel performs compared to industry standards. It might highlight areas that need improvement and ensure your business remains competitive.
What is a good B2B funnel conversion rate?
A good B2B funnel conversion rate depends on the stage. Based on current industry benchmarks, a website conversion rate of around 5% and an activation rate of 37.5% are great targets to aim for.


