SaaS User Retention Calculation: Formula, Examples and Tips


Two SaaS teams can report the exact same 40% Day 7 retention rate — and mean completely different things by it. One counts a login as retained. The other counts a user who published a project. One measures from signup. The other measures from activation. Same formula, different inputs, different story.
Retention rate has one core formula, but three distinct ways to calculate it, depending on what you’re trying to measure. This guide walks through each with a worked example, so you know exactly which one fits your product.
You’ll also learn:
- The benchmark to compare your numbers against.
- The calculation mistakes that quietly skew retention rates.
- How to connect retention rate to revenue impact.
Let’s start with the formula.

The retention rate formula — and two decisions to make first
The formula itself is simple: users retained divided by users at the start of the period, multiplied by 100.
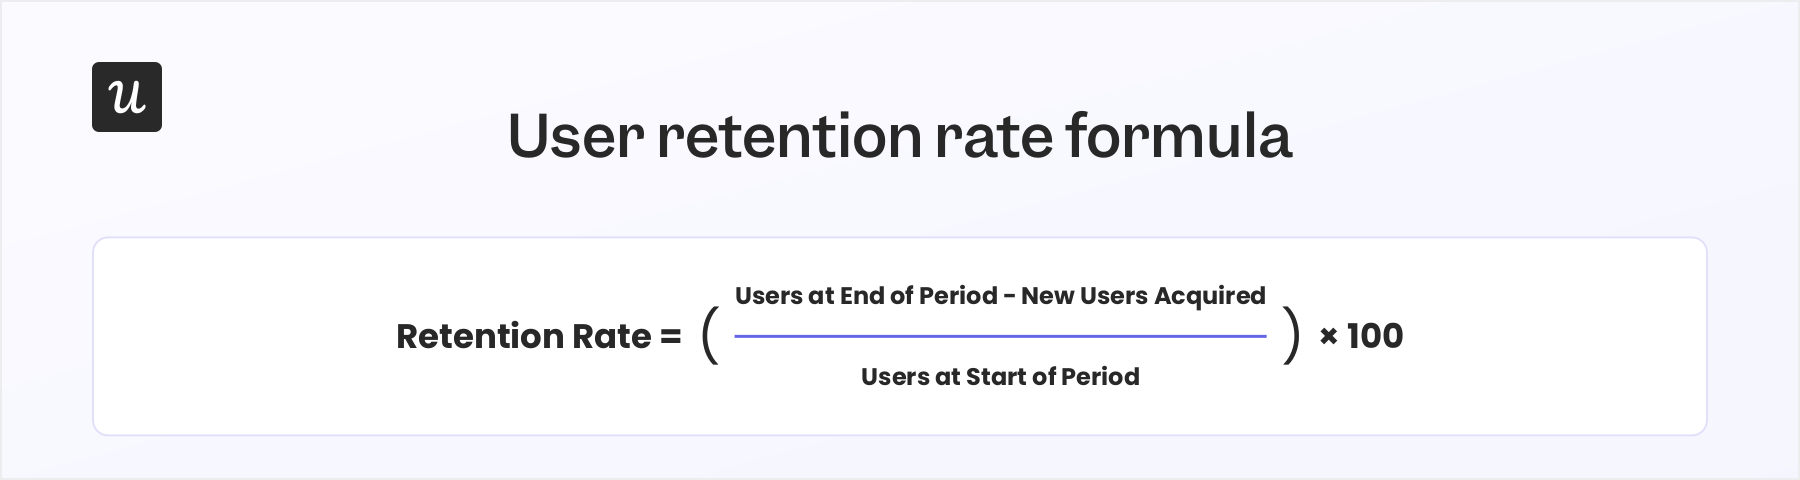
But before you calculate anything, decide two things:
- What counts as a retained user? A login might be enough for some products; others need a specific in-app action, like publishing a project. Pick whatever best reflects real usage of your product.
- What time frame are you measuring? Daily-use products are usually tracked weekly or monthly. Less-frequent products need quarterly or annual windows. Match the time frame to how customers naturally use your product, or you’ll mistake a normal usage gap for churn.
3 Ways to calculate SaaS user retention
Here’s the same example, calculated three different ways:
Quick summary of the methods:
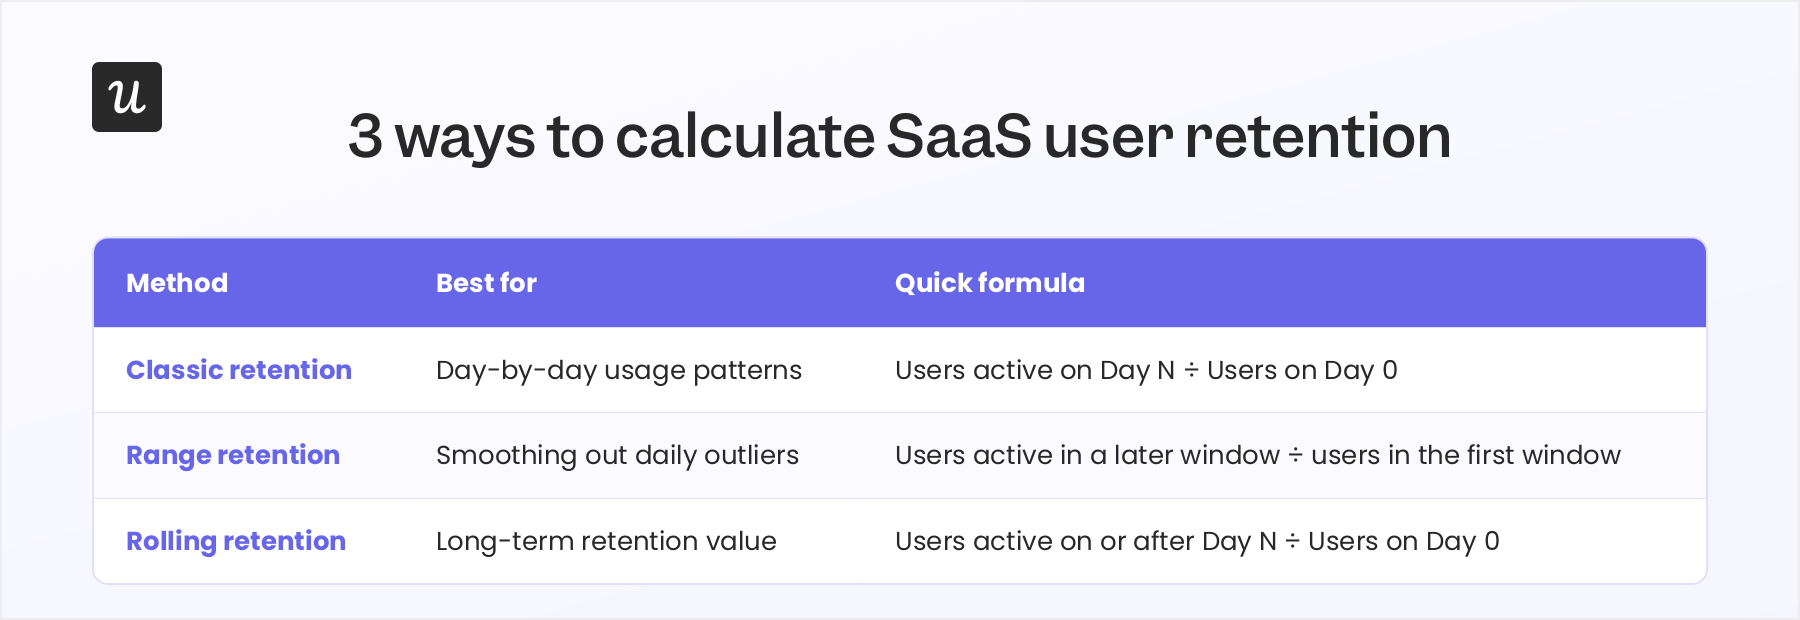
1. Classic retention
Classic retention measures the percentage of your original users still active after a specific period, comparing every future period against the same starting cohort.
How it works: The signup day becomes Day 0, and each following day is Day N. Divide the number of users active on Day N by the number active on Day 0.
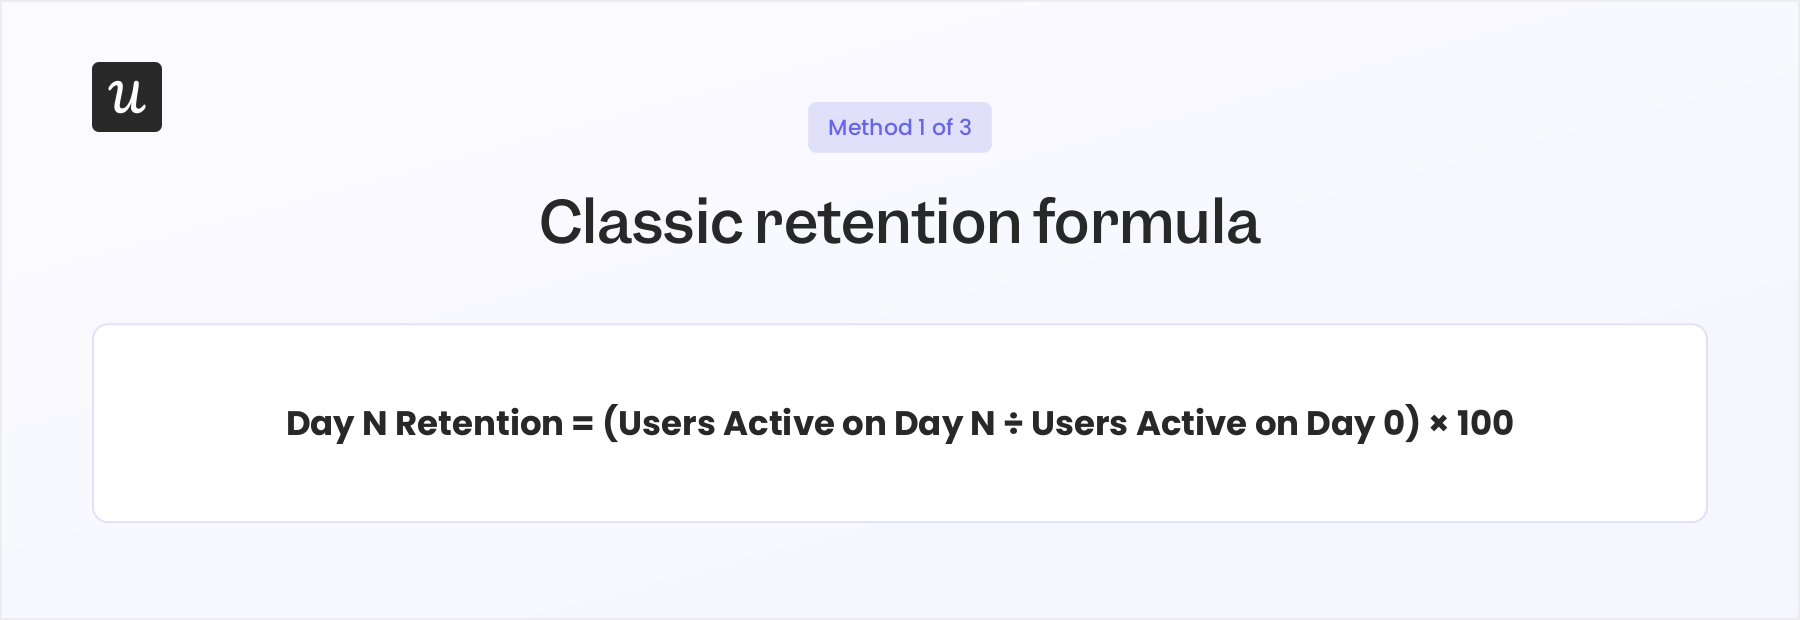
For LoopWise: Day 0 = 1,000 users, Day 7 = 400 active users, Day 30 = 280 active users. That gives you:
- Day 7 retention: (400 ÷ 1,000 × 100) 40%
- Day 30 retention: (280 ÷ 1,000 × 100) 28%
When to use it: daily (or exact-date) retention tracking and benchmarking.
2. Range retention
Range retention measures the percentage of original users who return within a window, rather than on one specific day. That makes it less sensitive to blips: weekends, holidays, a product outage.
How it works: Define two equal time windows, e.g., one week each. Then compare how many users from the original window were active again during the later window.
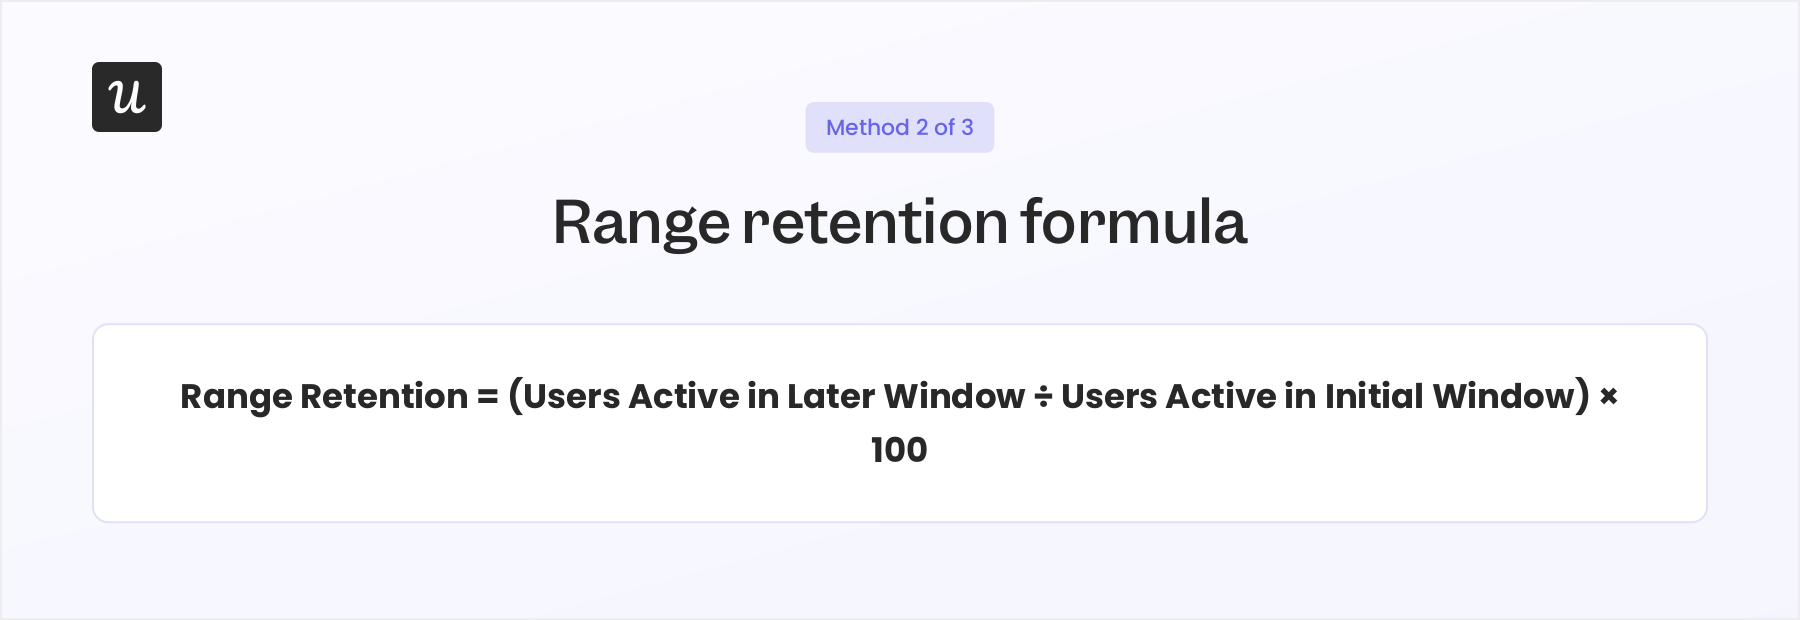
For LoopWise: all 1,000 users were active during the initial window (June 1–7). Four weeks later, in the window June 29–July 5, only 260 of those same users were active. Range retention for that window: (260 ÷ 1,000 × 100) 26%.
When to use it: measuring cohort retention over weekly or monthly windows, especially for products people don’t use daily.
3. Rolling retention
Rolling retention measures the percentage of original users who return on or after a specific day. Unlike classic retention, users don’t need to be active on the exact day you’re measuring — they just need to come back eventually.
How it works: Pick a retention milestone, like Day 7, then count everyone active on Day 7 or any day after. Divide that number by users active on Day 0.
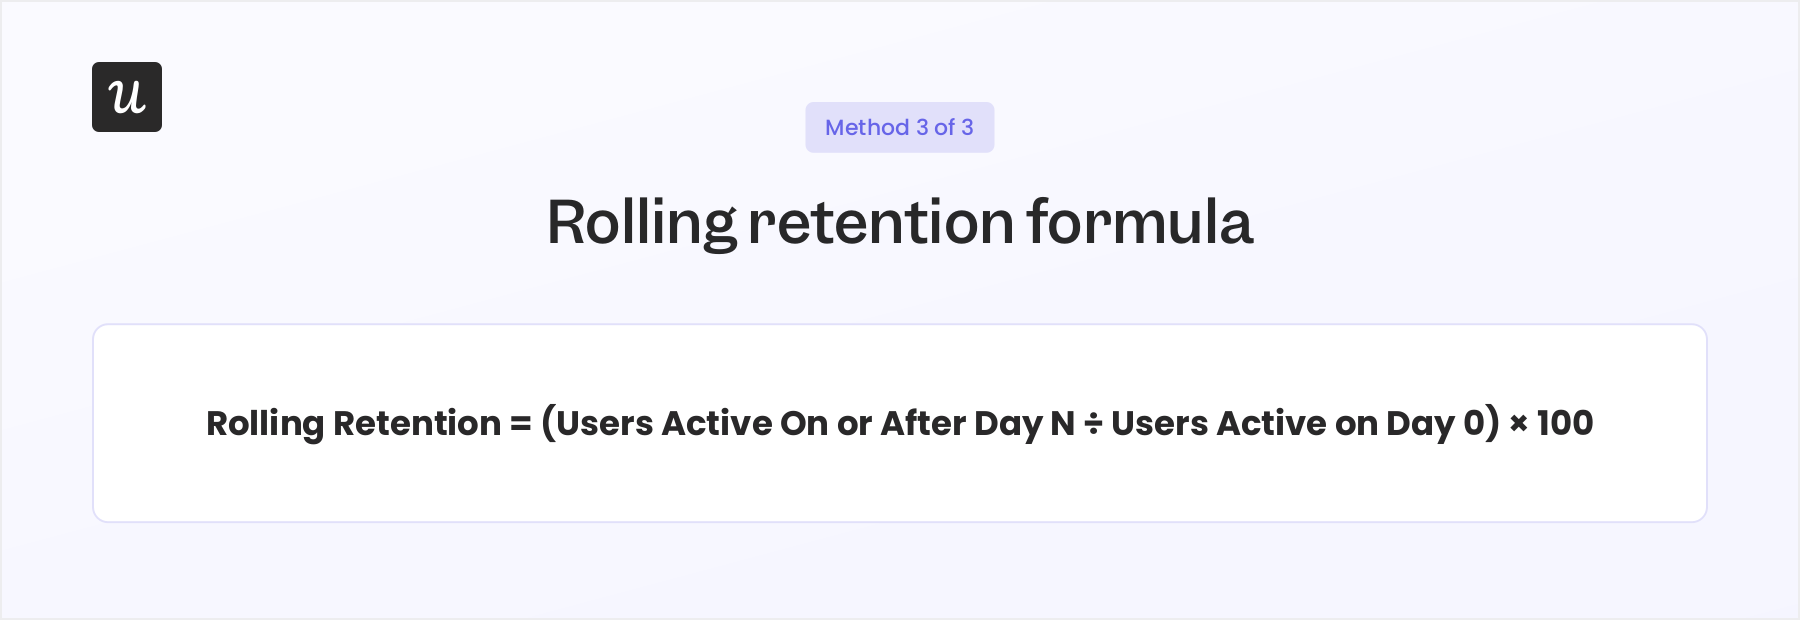
For LoopWise: 400 users were active on Day 7. Another 150 returned sometime between Day 8 and Day 17. Rolling retention counts anyone active on or after Day 7, so that’s 550 retained users: (550 ÷ 1,000 × 100) 55%.
When to use it: products with irregular usage patterns, where users don’t need to return on a specific day to count as active.
Classic, range, and rolling retention are the three standard methods. But what if retention isn’t actually your problem — what if users never reached your product’s first value moment in the first place?
Here’s how to check.
BONUS: Measure retention from activation, not signup
This method uses the same formula as the others. The only change: Day 0 becomes the activation event instead of the signup date.
How it works: Day 0 becomes the moment users complete the action that proves they’ve experienced real value. For LoopWise, that’s creating a first project.
For LoopWise: 650 of the 1,000 signups created a first project within seven days. By Day 30, only 280 of those activated users were still active. That gives you two very different numbers:
- Signup-based Day 30 retention: (280 ÷ 1,000 × 100) 28%
- Activation-based Day 30 retention: (280 ÷ 650 × 100) 43%
When to use it: to separate an activation problem from an actual retention problem.
So what counts as a good retention rate?
It depends entirely on how often people use your product. A messaging app needs far higher retention than accounting software people open once a month.
Benchmark against products with similar usage patterns, not the industry at large. Our Benchmark Report found the average Month 1 retention across B2B SaaS companies is 46.9% (median 45.25%).
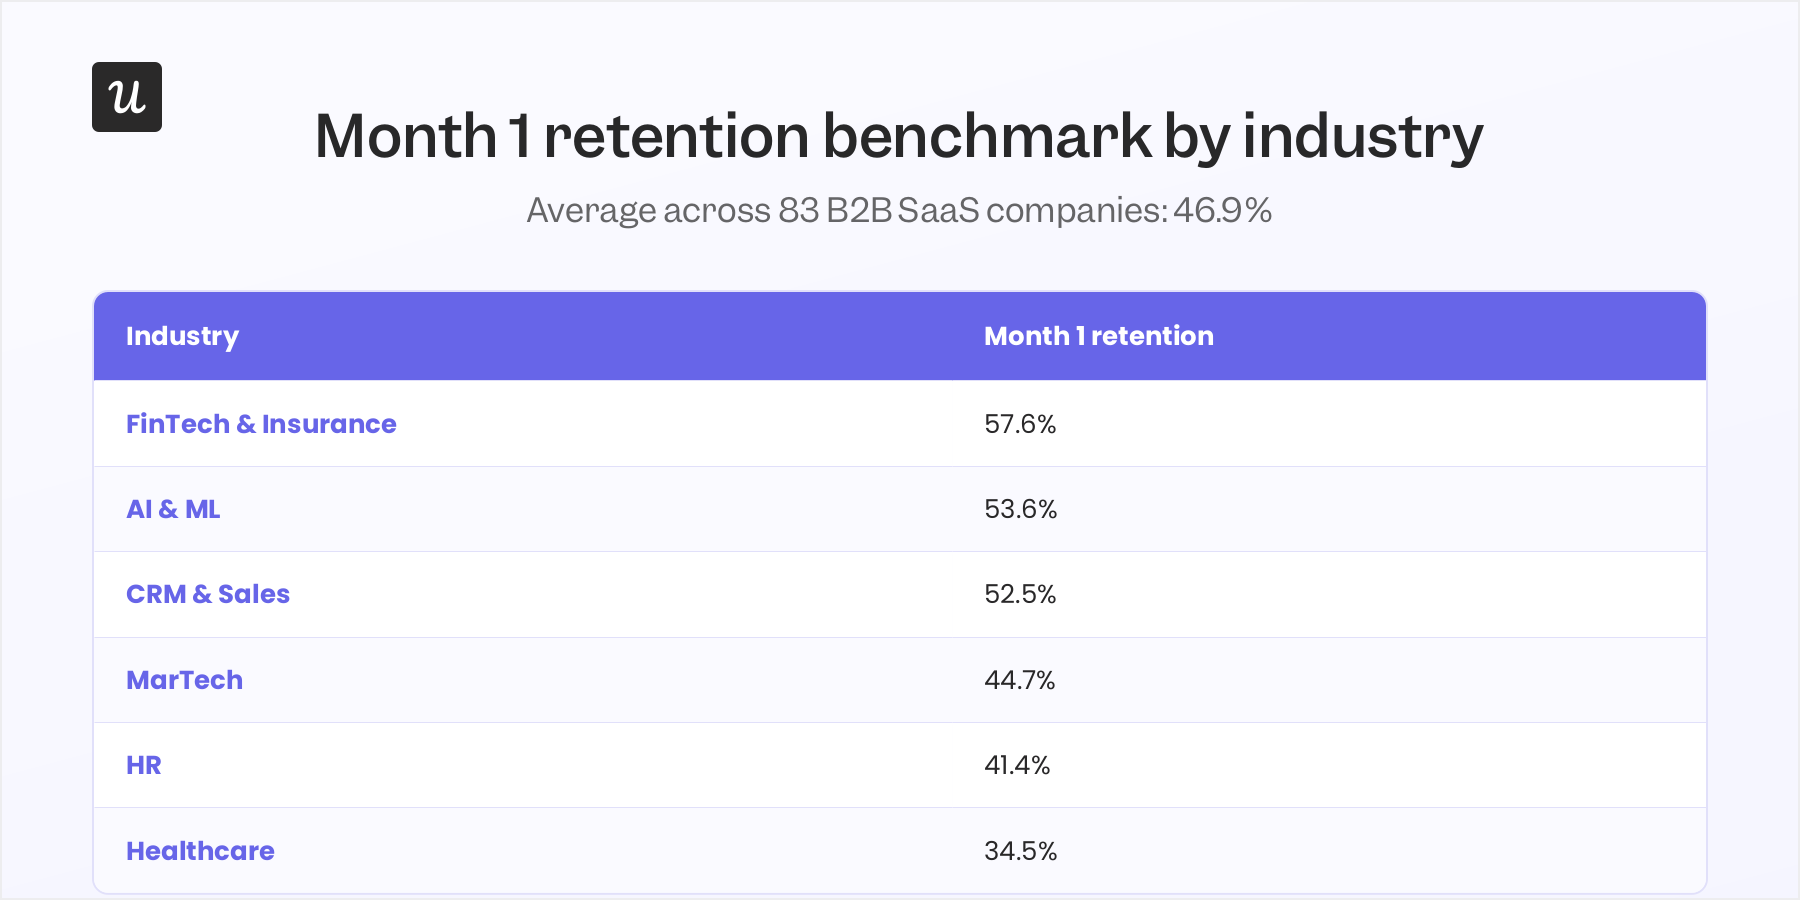
By that benchmark, LoopWise’s 28% Month 1 retention leaves plenty of room for improvement.
But don’t chase a retention fix yet. Check it against activation-based retention first. If activated users retain at a much higher rate, the real fix is onboarding — get more users to their first value moment, rather than working the retention number directly.
4 Retention calculation mistakes that skew your numbers
Watch for these before you trust any retention figure:
- Counting canceled customers as churned too soon: A canceled customer is still a paying customer until the subscription actually ends. Count them as churned early, and you lose the chance to understand why they left — or win them back before they do.
- Calculating retention without segmenting by account age: New and long-term customers behave differently. Lump them together and you’ll hide onboarding problems among new users, or retention problems among established ones.
- Ignoring subscription tiers: Enterprise and self-serve customers churn for different reasons and at different rates. Calculate retention by plan to find which segment actually needs attention.
- Overlooking MRR retention: User retention tells you how many customers stayed. MRR retention tells you how much recurring revenue they represent. A 90% user retention rate can still hide declining revenue if your highest-value customers are the ones leaving — track both.
How retention rate connects to revenue
A retention percentage tells you how many customers stayed. To understand the actual business impact, you need to know how much recurring revenue those retained customers generate.
Say 200 of LoopWise’s 280 retained users are on the $40/month plan, and 80 are on the $400/month enterprise plan:
- Retained revenue = (200 × $40) + (80 × $400) = $40,000/month
A higher retention rate usually means more recurring revenue — but only if you’re retaining the customers who actually generate it. That’s why MRR retention deserves a seat next to user retention, not a footnote.
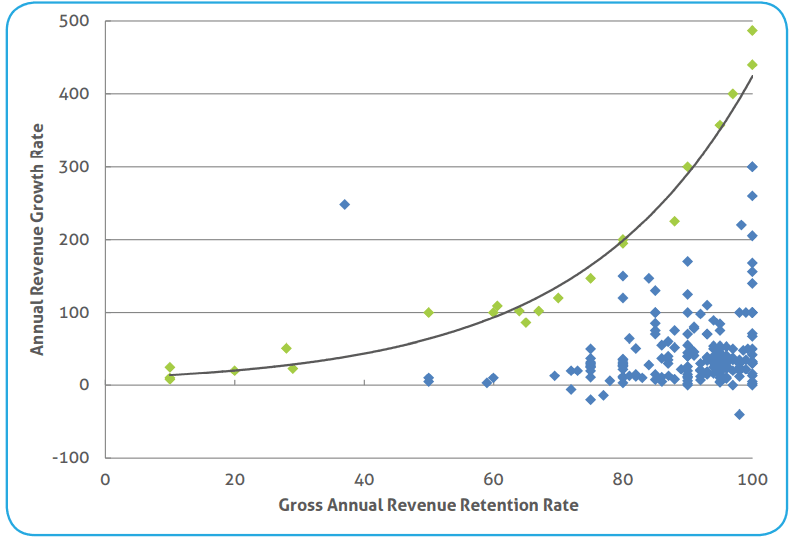
Retention compounds, too. The more customers you keep, the more recurring revenue you generate without spending more on acquisition. SaaS Capital found a causal relationship between higher retention and faster revenue growth.
You know how to calculate retention. Now what?
Start by calculating retention for your most recent cohort, using whichever method matches how customers actually use your product. Then compare the result against your industry benchmark.
If the number comes in lower than expected, don’t jump straight to fixing retention. Segment it by activation, account age, and plan first — you’ll often find the problem sits in one specific group, which makes it far easier to fix.
Want to automate all of this? Userpilot automatically tracks retention across cohorts, segments, and activation stages. Book a demo to see how it works!
About the author