10 Customer Service Metrics + How to Track Them


Tracking customer service metrics enables customer support teams to identify areas of improvement, optimize their support strategies, and enhance the customer experience.
In the article, we explore 10 metrics every SaaS team should monitor and share best practices for improving them and leveraging them to boost product growth.
Let’s dive right in!
What are customer service metrics?
Customer service metrics are performance indicators that you use to track, measure, and analyze the efficiency and effectiveness of customer service teams.
These metrics provide valuable insights into how well customer service operations are performing (operational metrics) and how they impact overall customer satisfaction and loyalty (organizational metrics).
Why are customer service metrics important?
By understanding and leveraging these customer success metrics, you can objectively assess your customer service team’s performance.
What’s the use? It enables you to identify areas for improvement and benchmark your organization against competitors.
By improving the metrics, you can enhance customer satisfaction and loyalty, which translates into better retention and customer lifetime value. Both are essential for your business growth and profitability.
Improving customer service metrics increases profitability by reducing the costs associated with handling inquiries and resolving issues.
Finally, the metrics help you set clear and specific development goals for the customer support team members. This can increase their motivation and improve their loyalty to the business, leading to higher engagement and lower turnover.
Important customer service metrics to measure
With the basics covered, here are 10 top customer service metrics to track in your SaaS.
Customer satisfaction score (CSAT)
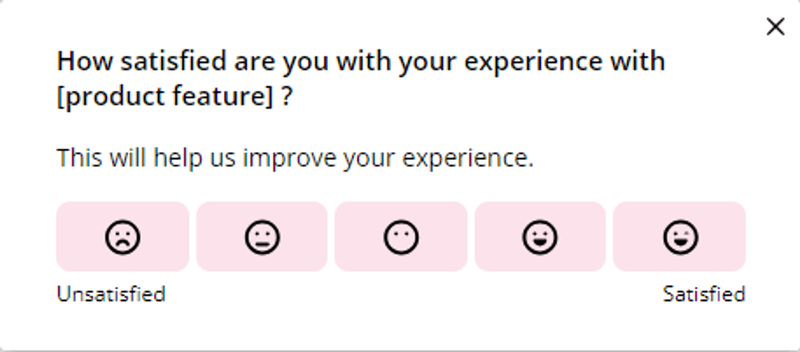
Customer satisfaction score (CSAT) is a measure of how satisfied customers are with a company’s product or interactions with customer service agents.
Monitoring the metric allows you to spot trends and patterns in customer satisfaction over time. It also enables teams to find dissatisfied customers and understand the causes of their discontent.
The score is based on a survey in which customers rate their satisfaction on a scale, often from 1 to 5.
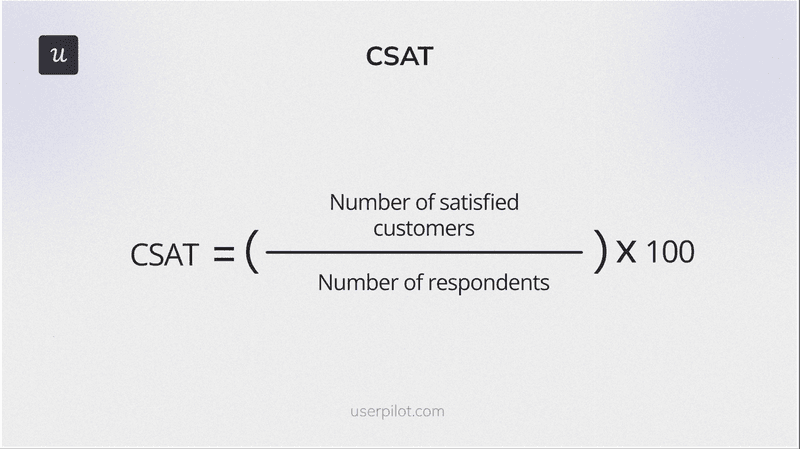
To calculate CSAT, take the number of satisfied customers (those who rated satisfaction as 4 or 5 on a 5-point scale), and divide it by the total number of responses, then multiply it by 100 to get a percentage.
For example, if 80 out of 100 respondents rated their satisfaction as 4 or 5, CSAT is 80%:
(80/100) × 100 = 80%
💡Best practice: Run CSAT surveys regularly, every 3-4 months, and trigger them contextually to evaluate specific interactions, for example, a customer support call.
Net Promoter Score (NPS)
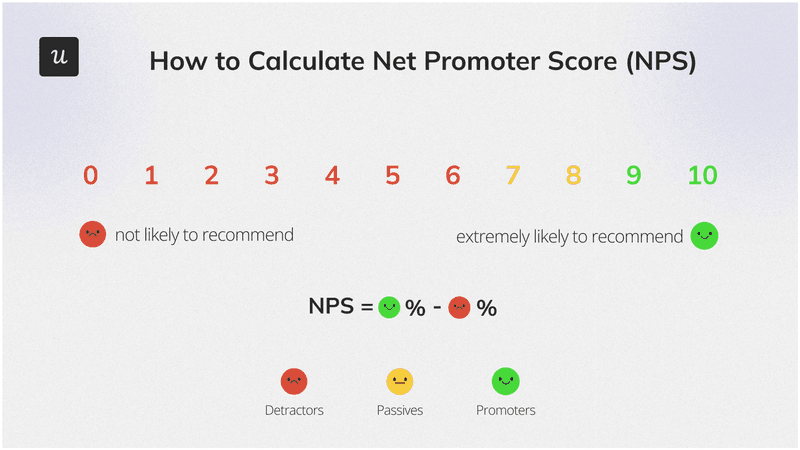
Net Promoter Score (NPS) measures customer loyalty and sentiment by asking them how likely they are to recommend the product on a scale from 0 to 10.
The metric provides insights into customer loyalty and overall satisfaction. High NPS indicates strong customer advocacy, which can drive new business through word-of-mouth.
Calculate NPS by subtracting the percentage of Detractors (those who score 0-6) from the percentage of Promoters (those who score 9-10).
Imagine you have 200 respondents: 110 are Promoters, and 60 are Detractors. Your NPS is 25:
(110/200) − (60/200) = 55 − 30 = 25
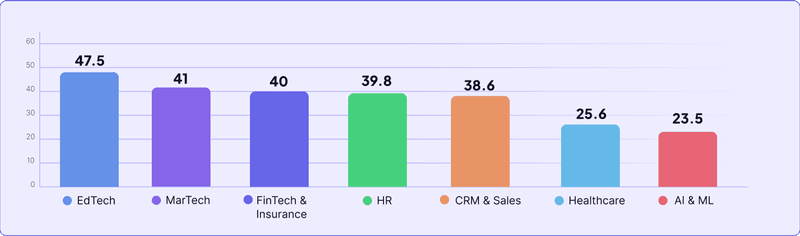
What’s a good NPS score in SaaS?
This depends on your sector. For example, EdTech companies boast the highest score of 47.5, while AI & ML companies only score 23.5. Check out our SaaS Product Success Metrics Report for benchmarks in your industry.
💡Best practice: Segment your NPS promoters and target them with in-app messages encouraging them to leave reviews and take part in referral programs.
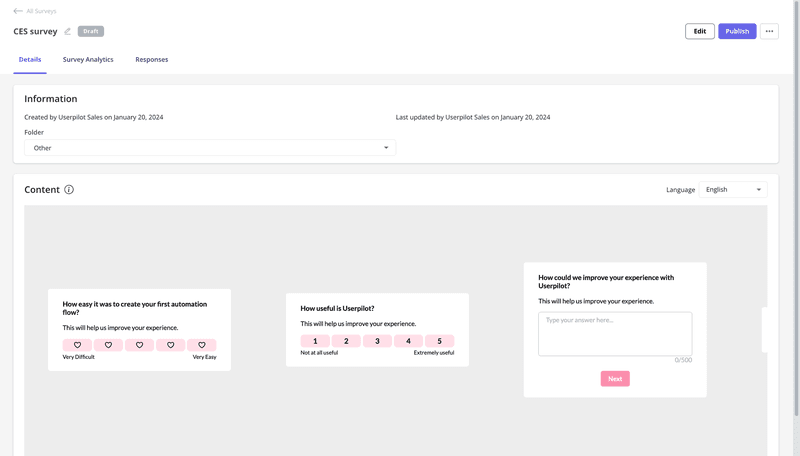
Customer effort score (CES)
Customer Effort Score (CES) measures how easy it is for customers to complete a task, resolve an issue, or get an answer.
A low CES indicates that the customer support agents are efficient and easy to deal with, which can lead to higher satisfaction and loyalty. Reducing customer effort can improve the overall customer experience.
The CES data is collected via a survey in which customers rate the effort on a scale from 1 to 5 (or from ‘Very easy’ to ‘Very Difficult’).
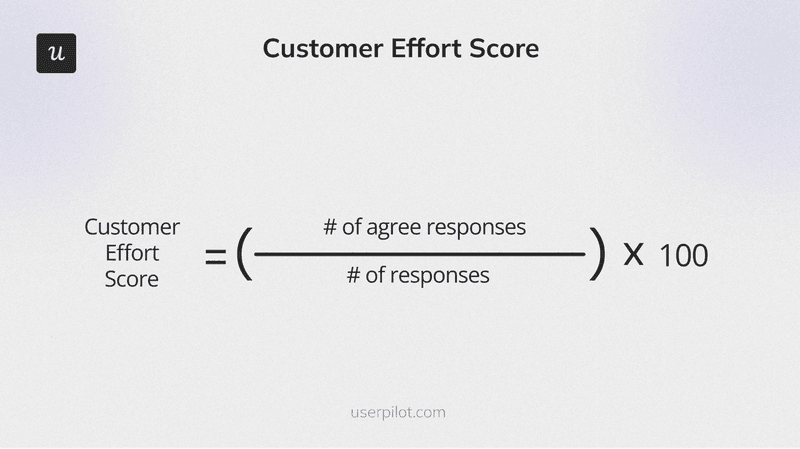
To calculate CES, divide the number of positive responses by the total number of responses and multiply it by 100. So, if you have 300 responses and 219 of them are 1 and 2 (or Easy and Very Easy), the CES score is 73%.
(219/300) x 100 = 73%
💡CES best practice: Trigger the survey immediately after the interaction is over when the experience is still fresh in their minds.
Average response time
Average response time is the average time taken to respond to customer service requests.
Quick response times are critical for customer satisfaction. Customers expect timely responses, and faster response times can enhance their experience and trust in the company. Slow response time causes frustration and can lead to customer churn, especially early in the customer journey.
To calculate the average response time, divide the total time needed to respond to all inquiries by their number.
So if it takes your customer service representatives a total of 500 minutes to respond to 100 inquiries, the average response time is 5 minutes:
500/100 = 5
💡Best practice: A chatbot can improve the average response time by as much as 80%.
First contact resolution rate
The first contact resolution rate (FCR) is the percentage of customer queries resolved on the first contact.
High FCR indicates efficient problem-solving and enhances customer satisfaction. This is understandable: customers want their problems sorted straight away without having to chase their requests.
To calculate FCR, divide the number of issues resolved on the first contact by the total number of customer support requests and multiply them by 100 to get a percentage.
So, if 210 out of 300 issues are resolved on the first contact, the FCR rate is 70%.
210/300 = 70%
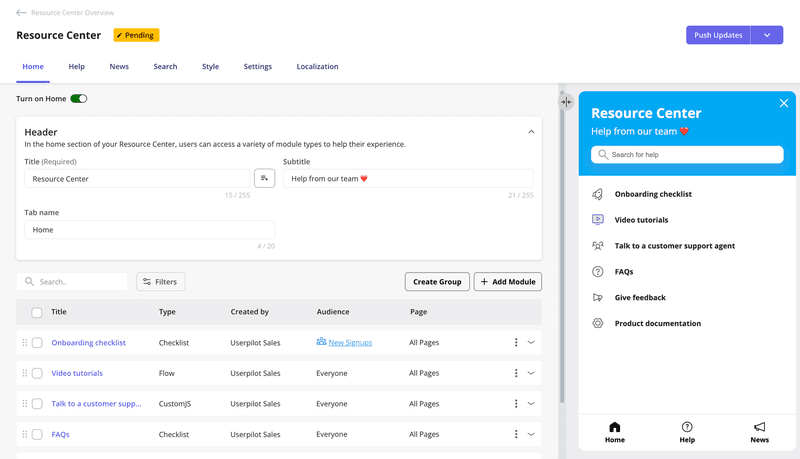
💡Best practice: By providing self-service support resources, you allow customers to resolve their issues independently. Even if they don’t solve the problem, they give the customer a better understanding and can help eliminate some possible causes, which makes it easier for the customer service agent to address it.
Customer retention rate
Customer retention rate is the percentage of customers who remain with a company over a specific period.
High retention rates indicate customer satisfaction and loyalty, which are crucial for long-term business success and profitability. Acquiring customers is more expensive than retaining them, so if you can’t retain them, growth is unsustainable.
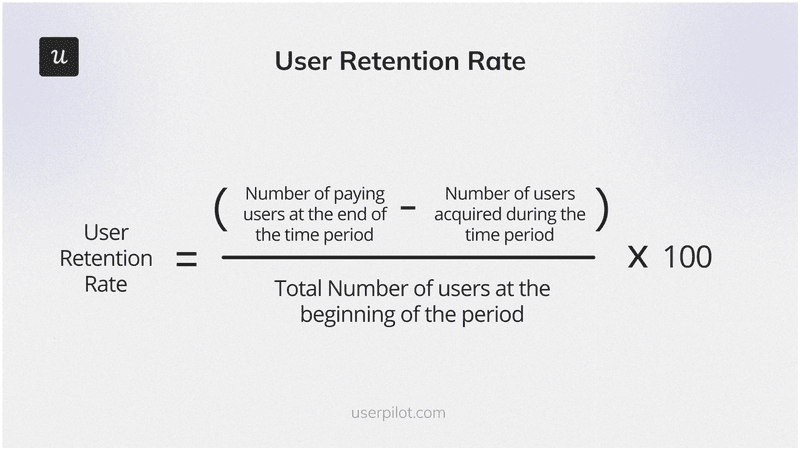
To calculate the retention rate, subtract the number of new customers acquired during a period from the number of customers at the end of the period. Divide this by the number of customers at the start of the period and multiply by 100.
For example, if you had 500 customers at the start, acquired 50 new ones, and had 450 at the end, the retention rate is 80%:
((450−50)/500) × 100 = 80%
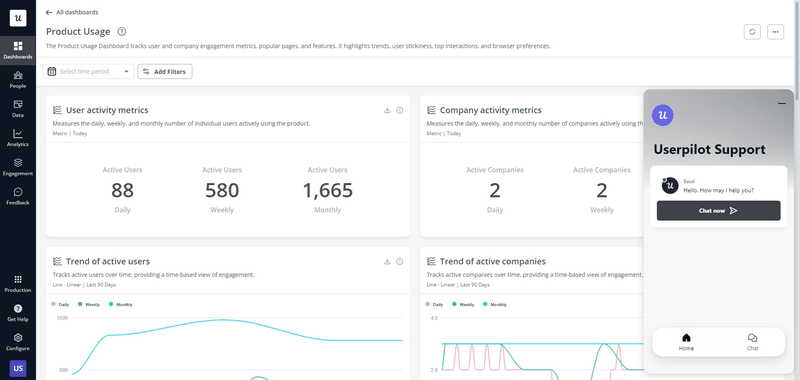
💡Best practice: SaaS teams may need to measure retention rates for different periods, for example, a week, month, or year, and different user cohorts. To stay on top of all the metrics, build a retention dashboard and track them without switching between reports.
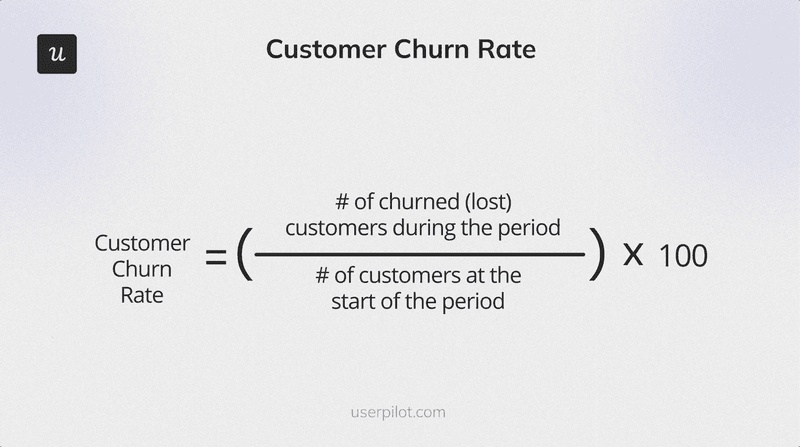
Customer churn rate
Churn Rate is the percentage of customers who stop using your product over a specific period.
Understanding churn helps identify potential issues and areas for improvement to retain customers. Because as mentioned above, sustainable growth isn’t possible when you’re bleeding customers.
Calculate the churn rate by dividing the number of customers lost during a period by the number of customers at the start of the period and multiplying it by 100.
So if you started with 500 customers and lost 50, your churn rate is 10%:
(50/500) x 100 = 10%
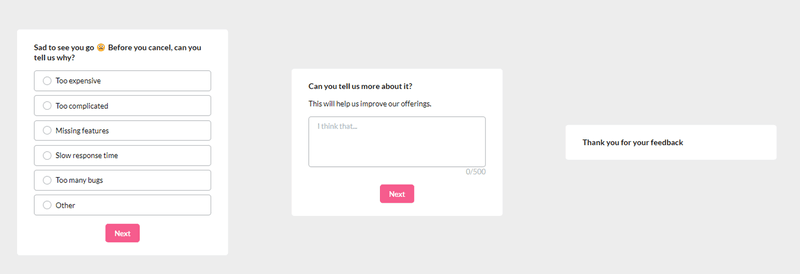
💡Best practice: Run churn surveys to understand why your customers disappear. Embed them into the cancellation flow and send them by email to inactive users.
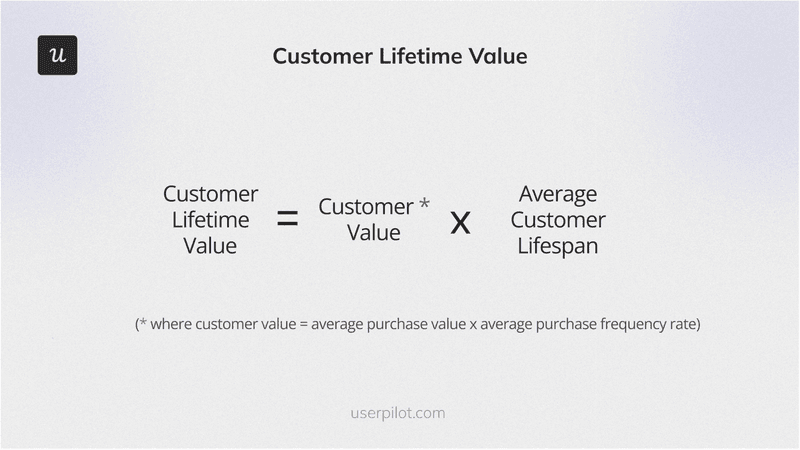
Customer lifetime value
Customer lifetime value estimates the total revenue a business can expect from an average customer account throughout their relationship.
The metric helps businesses understand the long-term value of customers and allocate resources effectively to maximize profitability. For example, if a specific customer segment tends to have higher LTV than others, you can prioritize your marketing efforts to attract and retain similar customers.
Bear in mind, though, that LTV doesn’t offer the full picture. A high lifetime value doesn’t mean much if the customer acquisition cost is higher. A good LTV:CAC ratio should be 3-5:1.
How do you calculate LTV? By multiplying the average purchase value, purchase frequency, and customer lifespan. So if the customer pays a monthly fee of $249, and the customer’s lifespan is 3 years, the LTV is $8,964:
249 × 12 × 3 = $8,964
💡Best practice: Use product analytics to identify the most valuable features and include them in your premium plans. Track product usage to select customers who would benefit from the features and who are ready to upgrade, and target them with upsell messages highlighting the feature benefits.
Onboarding checklist completion rate
The onboarding checklist completion rate shows you the percentage of users who completed all the tasks included in the checklist.
A higher completion rate indicates that the checklist is well-optimized and offers a good customer experience. This matters because onboarding checklists guide users through the tasks that are essential to experiencing the product value. That’s vital for customer success and product adoption.
To calculate the completion rate, divide the number of users who completed the checklist by the total number of those who started it and multiply it by 100.
So, if 500 new users start the checklist and 124 complete it, the completion rate is 24.8%.
(124/500) x 100 = 24.8%
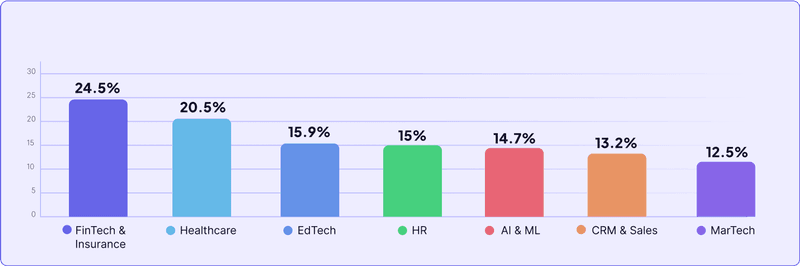
In our SaaS Product Success Metrics report, we looked at checklist completion rates across 7 sectors. Fintech & Insurance companies had the highest rate (24.5%), while the MarTech companies had the lowest (12.5%).
💡Best practice: To increase checklist completion rates, include up to 7 tasks closely correlated with user retention. Add the progress bar to tap into the Zeigarnik effect.
Social media metrics
Interactions with your brand in social media can provide valuable customer feedback on customer service performance and help you identify ways to improve the user experience.
What exactly should you track on social media?
- What’s the sentiment of the comments (positive vs. negative)?
- When do customers tend to comment?
- What aspects of the customer experience do they comment on?
- How many people engage with their comments?
- What kinds of customers are most active on social media?
You can gain such insights using social media management and monitoring tools like SproutSocial and Hootsuite.
Conclusion
Thanks to customer service metrics, SaaS businesses can monitor the performance of their support teams. Customer surveys used to gather data can also offer valuable feedback on how to improve the user experience and help you understand customer expectations and needs.
If you’d like to learn how you can collect and analyze the key customer service metrics with Userpilot, book the demo!
About the author