Comparing Mobile App Analytics Tools: Use Cases, Pricing, and More


The right mobile app analytics tool can make or break your growth.
But in all my years of growing digital products, I’ve not seen a single tool that solves all mobile analytics needs. Some tools are great for marketers, and others are for product or development teams. What works for a startup might not scale for an enterprise.
So instead of listing tools randomly, I’ve grouped them into three categories: cross-platform analytics, marketing attribution, and performance monitoring. This guide will help you find the best fit for your goals, stack, and budget.
Shortlist of top mobile app analytics tools
| 🧰 Tool | 🎯 Best For | ✨ Main Features | 💸 Pricing | ⚠️ Important consideration |
| Firebase Analytics | Unrestricted mobile event analytics | Event logging, audiences, funnels, real-time dashboards, seamless integration with Google services | Free plan available, then pay-as-you-go for additional Firebase and Google Cloud usage | Focuses on high-level trends; lacks the granular, user-level depth needed for product growth |
| Mixpanel | Advanced product funnels and segmentation | Event-based funnels, cohorts, flows, real-time dashboards, customizable reports, user-level tracking | Free for 1M events/mo. Paid plans start at $1,200/year | Manual instrumentation only; lacks automated user clustering found in Amplitude |
| Amplitude | Growth metrics and feature experimentation | Behavioral cohorts, funnels, retention, forecasting, AI summaries, heatmaps, experimentation tools | Free for 10K MTUs. Paid tier from $49/mo | Overwhelming for non-technical users |
| Userpilot | Cross-platform in-app engagement and analytics | UI patterns (modals, checklists, tooltips), event tracking, NPS surveys, segmentation, session replay | Free trial available. Paid plans begin at $299/mo (billed annually) | The pricing may not suit early-stage startups |
| AppsFlyer | Mobile attribution and campaign tracking | Multi-touch attribution, install tracking, ROAS, audience segmentation, deep linking, ad integrations | Free plan with limited conversions. Paid tiers start at $0.07 per conversion | Limited product analytics capabilities |
| RevenueCat | Subscription revenue analytics | Cross-platform IAP handling, MRR/LTV/churn metrics, price experiments, paywall testing, receipt validation | Free up to $2.5K monthly tracked revenue (MTR), then you’re charged 1% of your MTR. Enterprise pricing is custom | Limited value for one-time purchase or ad-based apps |
| AppFollow | ASO analytics and app store performance insights | Review aggregation/AI replies, keyword ranking, sentiment analysis, store performance monitoring | Free plan available. Paid plans begin at $129/mo, billed annually | Primarily store-focused with limited post-install behavioral depth |
| UXCam | Mobile behavioral analytics | Session replays, heatmaps, autocapture, funnels, rage-tap detection, performance issue spotting | Free plan + custom paid tiers. Vendr reports a median price of around $21,000/yr | Opaque pricing and high cost for small teams |
| Sentry | Crash diagnostics and error tracking | Error/crash reporting with stack traces, performance tracing, session replays, real-time alerts | Free for up to 5K errors per month. Paid plans begin at $26/mo. | Focused on debugging and performance, not product analytics |
| PostHog | Open-source product analytics | Funnels, retention, session replays, feature flags/A/B tests, autocapture, SQL access | Generous free plan, then pay-as-you-go pricing | Steep learning curve and complex UI for non-technical users |
| Optimizely | Enterprise-grade experimentation and personalization | Multivariate testing, feature flags, advanced targeting, and personalization | Quote based with an average contract value of $77,599/yr | Overkill for startups that aren’t running high-traffic experiments |
Top mobile analytics tools for cross-platform insights
If your app lives on both mobile and web, you’ll want mobile analytics that give you the full picture. These tools help you track user behavior across platforms, so you can see what’s working where and how users move between them. Here are a few that do that well.
#1 Firebase Analytics for unrestricted mobile event tracking
💰 Pricing: Free for analytics. Costs may apply as you scale usage across other Firebase and Google Cloud services (for example, storage, BigQuery exports, or authentication beyond free limits).
🌟 G2 rating: 4.5/5 based on 290+ reviews.
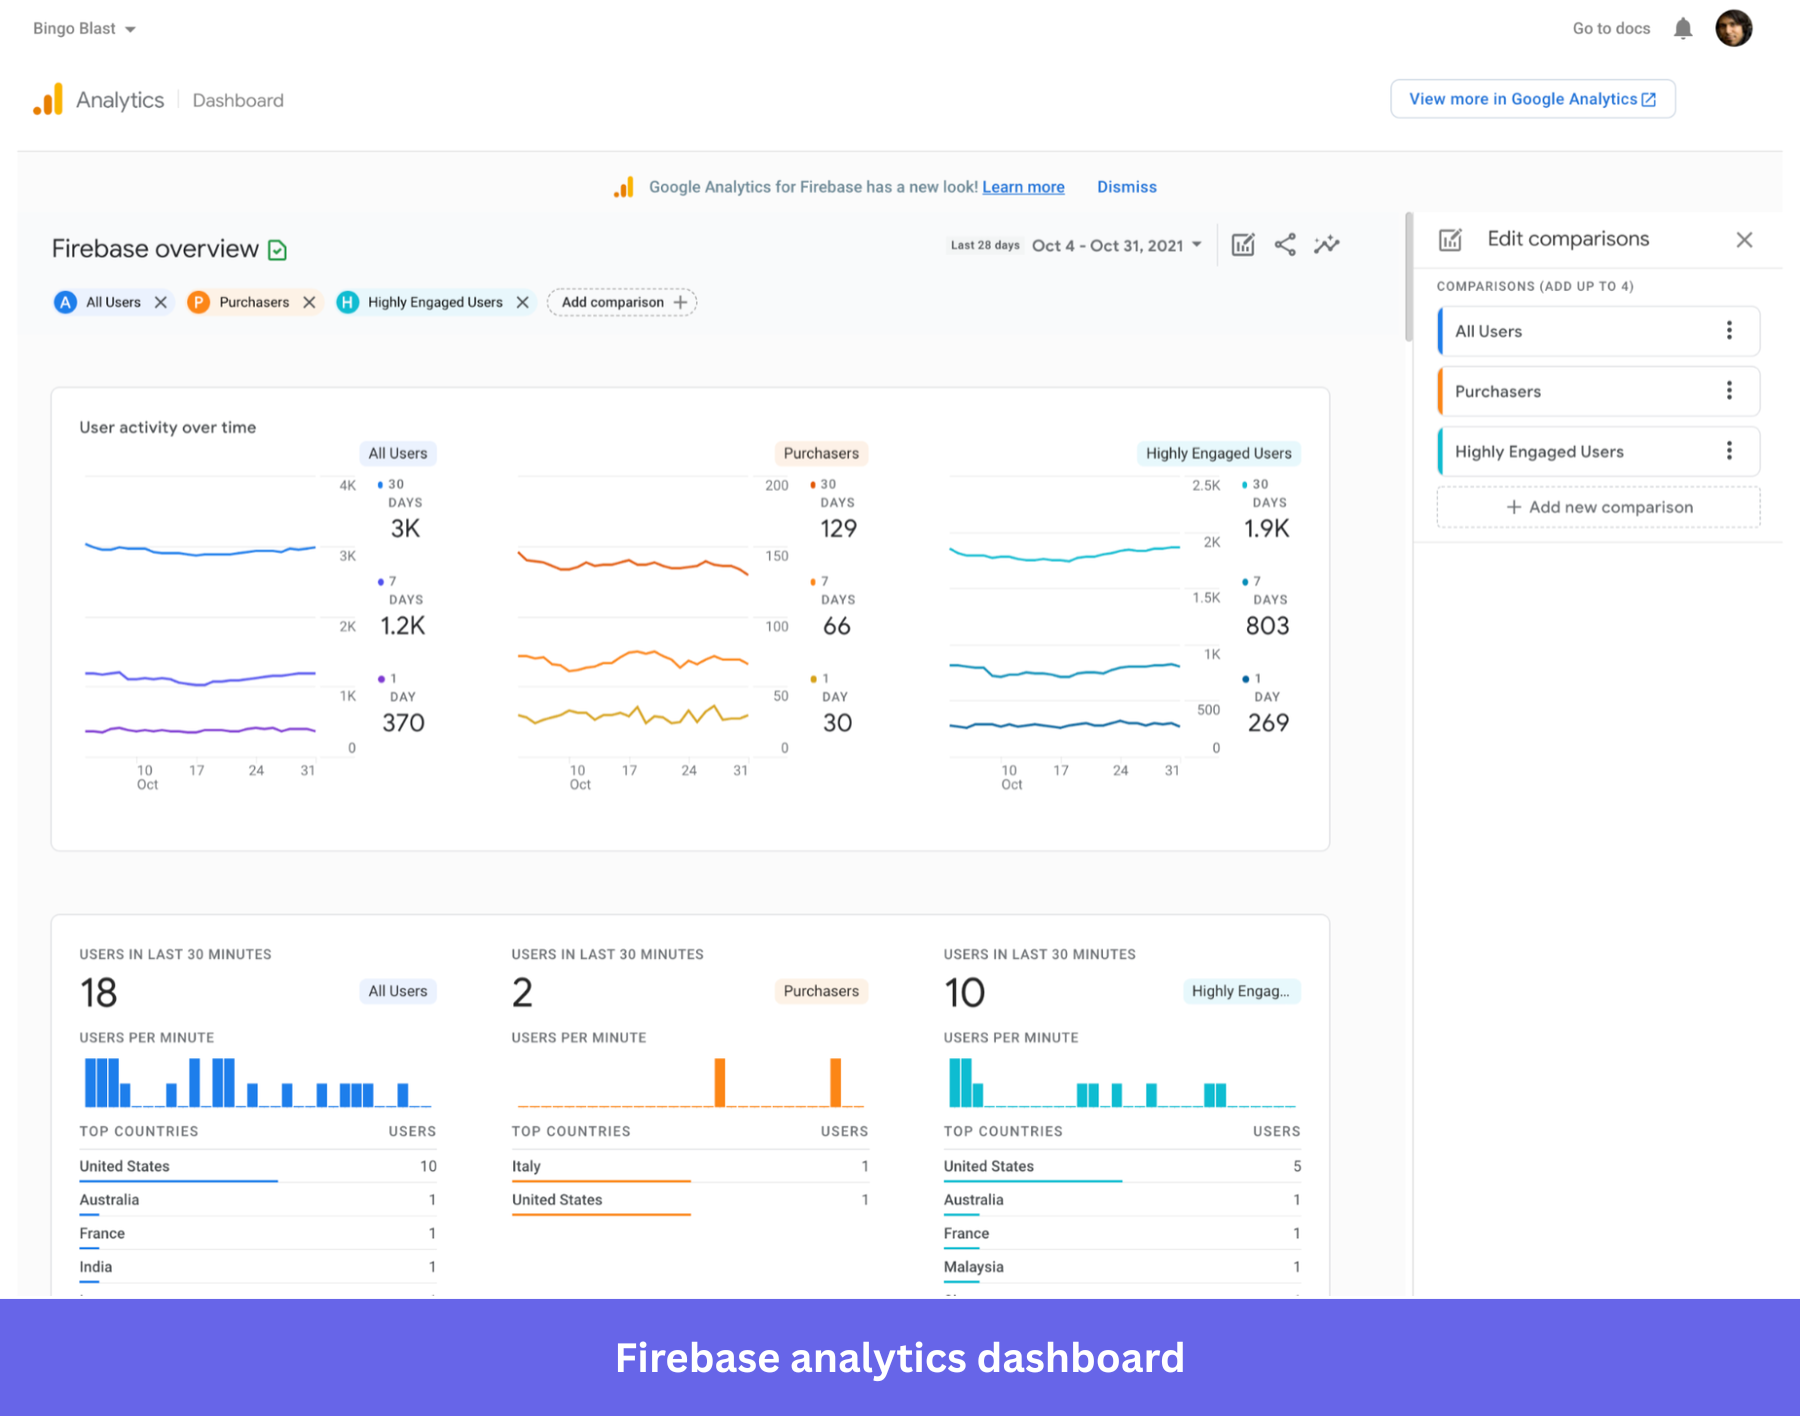
If you’re looking for a frictionless way to track user activity on iOS or Android without worrying about event limits, Firebase Analytics is a natural starting point. Since it’s built into the Google ecosystem (as part of Google Analytics for mobile), it offers generous event tracking at no cost and integrates easily with other Google services.
It works best for teams that need a reliable, high-level view of user activity, especially when paired with tools like Crashlytics or Cloud Messaging. However, it’s less suited for more advanced product analysis. If you need flexible event modeling, behavioral cohorts, or detailed user paths, its reporting layer can feel restrictive compared to dedicated product analytics tools.
Main features:
- Event-based tracking at scale: Automatically logs key actions like first open, session start, and purchases out of the box, with support for up to 500 custom event types and flexible data points.
- Real-time reporting: Monitor user activity as it happens to quickly spot spikes, drops, or campaign impact.
“The real-time monitoring feature is especially helpful, allowing me to see how changes to the app are affecting its performance and make necessary adjustments in real-time.” — Ravi on G2.
- Audience building: Create user segments using event data and user properties, then use them across Firebase and Google tools for targeting.
- Native Google ecosystem integration: Connect seamlessly with BigQuery, Google Ads, Crashlytics, and other Firebase services for deeper analysis and activation.
“The integration between services is seamless, and deployment is straightforward.” — Alan on G2.
#2 Mixpanel for advanced product funnels and segmentation
💰 Pricing: Free plan available. The paid plan starts at $1,200/yr, but Vendr’s data shows companies typically spend $13,400 – $99,055 per annum.
🌟 G2 rating: 4.6/5 based on 1,280+ reviews.
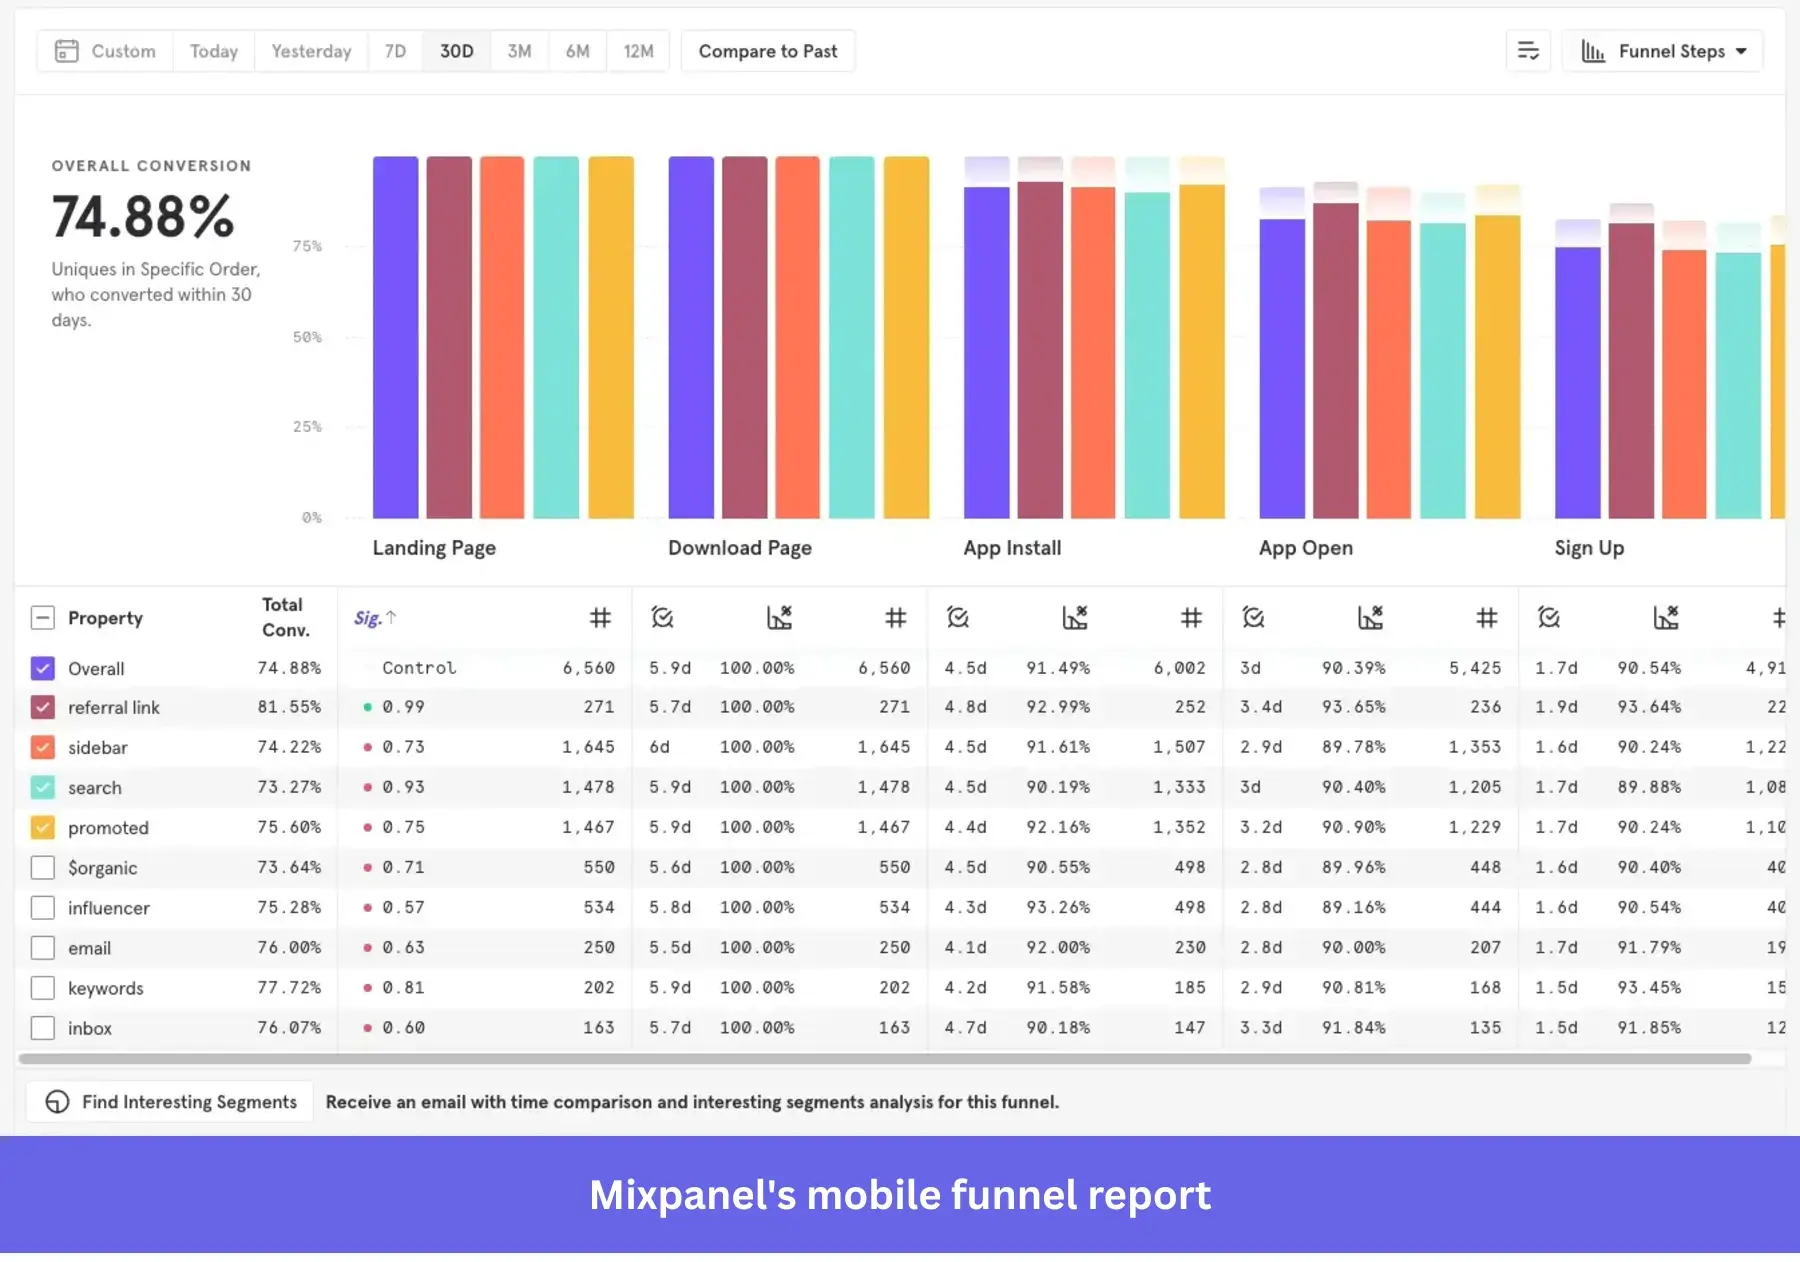
Mixpanel is widely considered the go-to option for mobile product teams that need to understand exactly how users move through their app. Instead of just tracking high-level metrics like daily active users, Mixpanel lets you build detailed funnels, analyze retention by behavior-based cohorts, and pinpoint exactly where users drop off in critical flows.
Its self-serve interface also makes it easy for product managers, marketers, and data analysts to explore data without relying on engineering for every query. However, getting to that point requires upfront work. You need to carefully define and implement your event tracking, which can make setup time-consuming and difficult to get right.
Main features:
- Custom event tracking: Define a structured event schema to track exactly how users interact with your app, with full flexibility over what to measure and how to visualize data through custom dashboards.
“The setup can feel confusing, especially when tracking events for the first time.” — Hardik on G2
- Behavioral cohorts: Build dynamic user segments based on actions and behavior patterns (e.g., power users vs new signups), then filter data to analyze how different groups behave over time.
- Advanced user retention analysis: Go beyond basic retention charts to understand which behaviors drive long-term engagement and repeat usage.
- Funnel analysis: Break down multi-step flows like onboarding or account renewal to pinpoint exact drop-off points and friction in user journeys.
“Funnels are easy to build, compare, and explore… fast and intuitive.” — Tobias on G2.
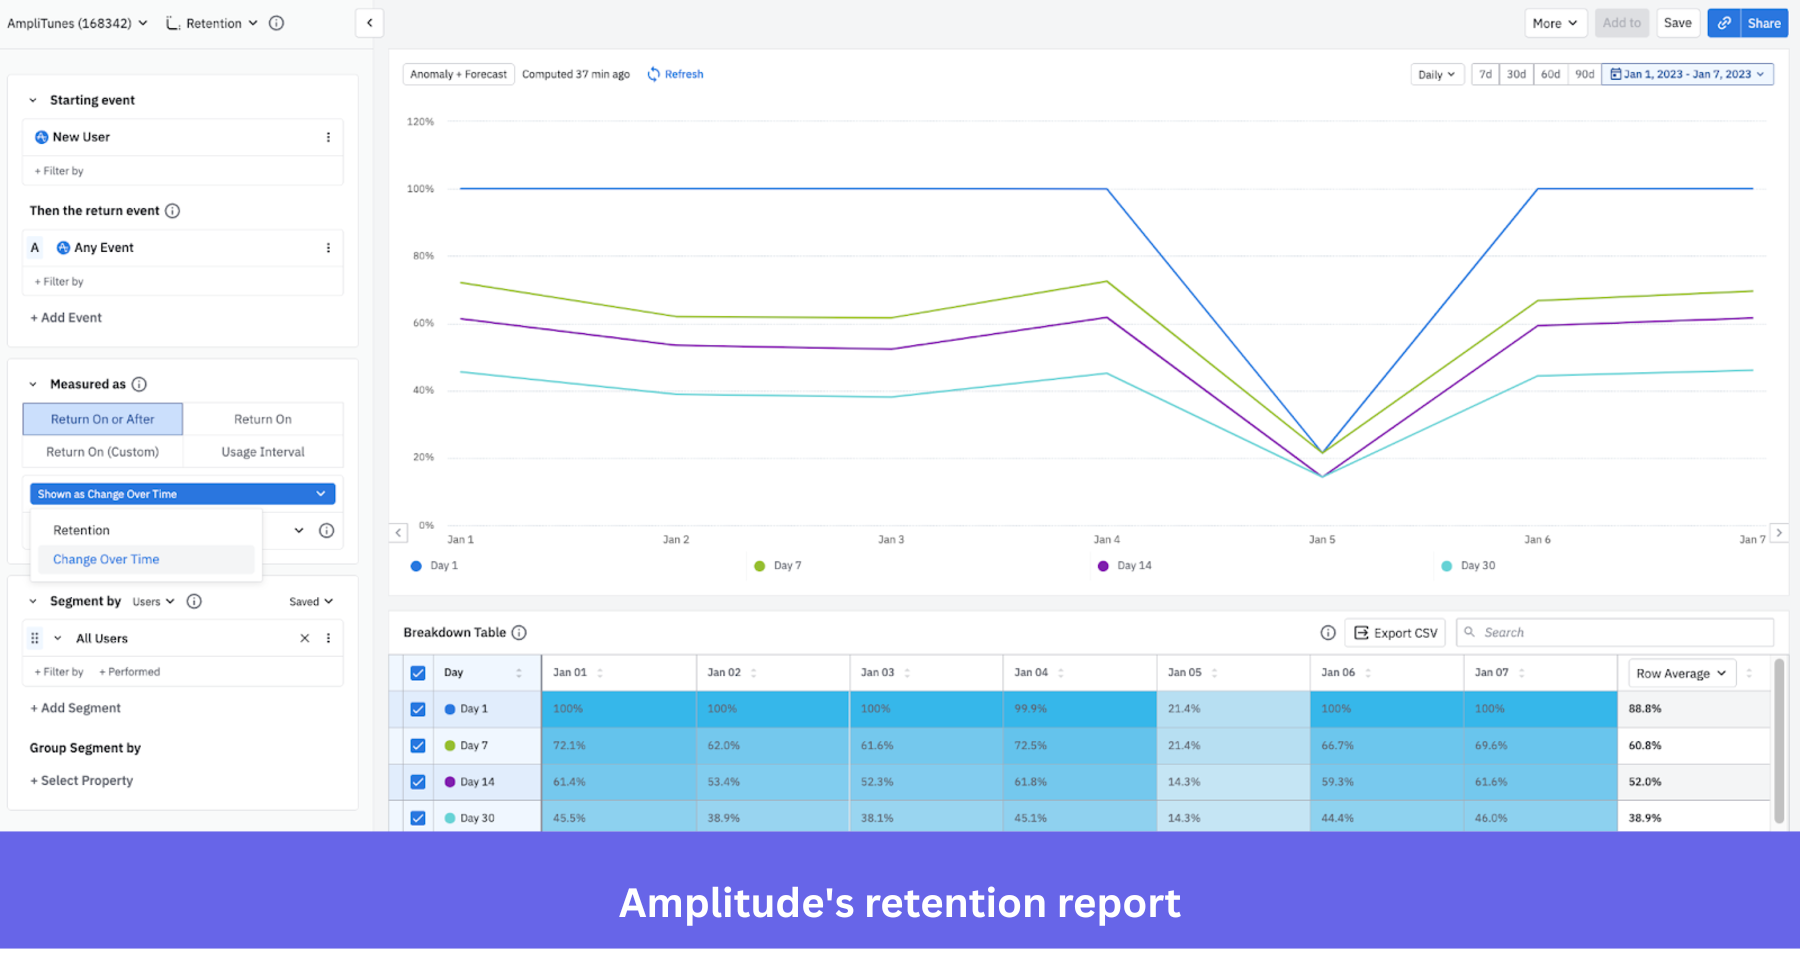
#3 Amplitude for growth metrics and feature experimentation
💰 Pricing: Free plan available (up to 10K MTUs). The paid plan starts at $49/month and scales quickly. Vendr data shows businesses end up paying $24,750 – $346,372 per annum.
🌟 G2 rating: 4.5/5 based on 2,800+ reviews.
Amplitude stands out for its ability to connect user actions to outcomes like retention, conversion, and revenue growth. You can analyze which behaviors actually move the needle, run experiments to validate your hypotheses, and prioritize features based on their impact.
It’s a close Mixpanel competitor, so you might be wondering when to pick one over the other. Here’s how I think about it: if your team needs quick answers and a more intuitive interface for everyday reporting, I’d go with Mixpanel. But if you’re working with a large dataset and want to uncover deeper behavioral patterns, like exactly which actions drive retention or subscription, Amplitude is the better choice.
Main features:
- Compass and correlation: Automatically identify which user behaviors are most strongly linked to outcomes like retention, conversion, or churn.
- Behavioral personas: Use machine learning to group users into segments based on real usage patterns and understand how different types of users engage.
- Path and funnel analysis: Visualize how users navigate through your product and pinpoint where they drop off or deviate from expected flows.
“I use Amplitude Analytics primarily to understand how customers actually move through our site and app, not just where traffic comes from.” — Mahhoor on G2.
- Root cause analysis: Quickly drill into drops or spikes in metrics to identify the specific segments, events, or changes driving them.
“My biggest issue with Amplitude is that the UI is not incredibly user friendly. It takes some time to learn the platform and how to gain as much from it as possible.” — User review on G2.
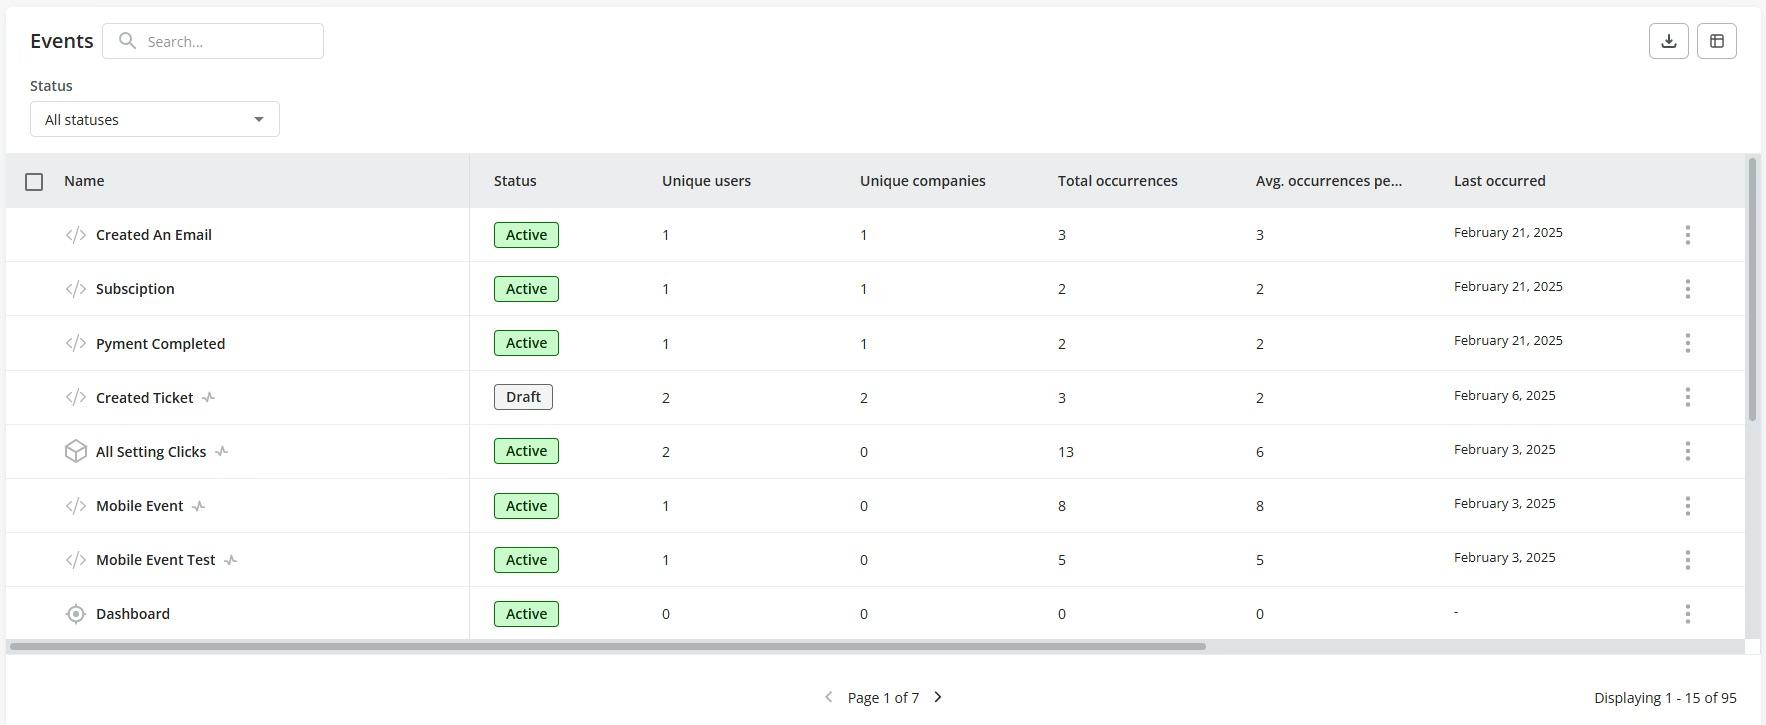
#4 Userpilot for cross-platform engagement and analytics
💰 Pricing: 14-day free trial available; paid plans start at $299/month (billed annually) and scale to custom enterprise tiers.
🌟 G2 rating: 4.6/5 based on 900+ reviews.
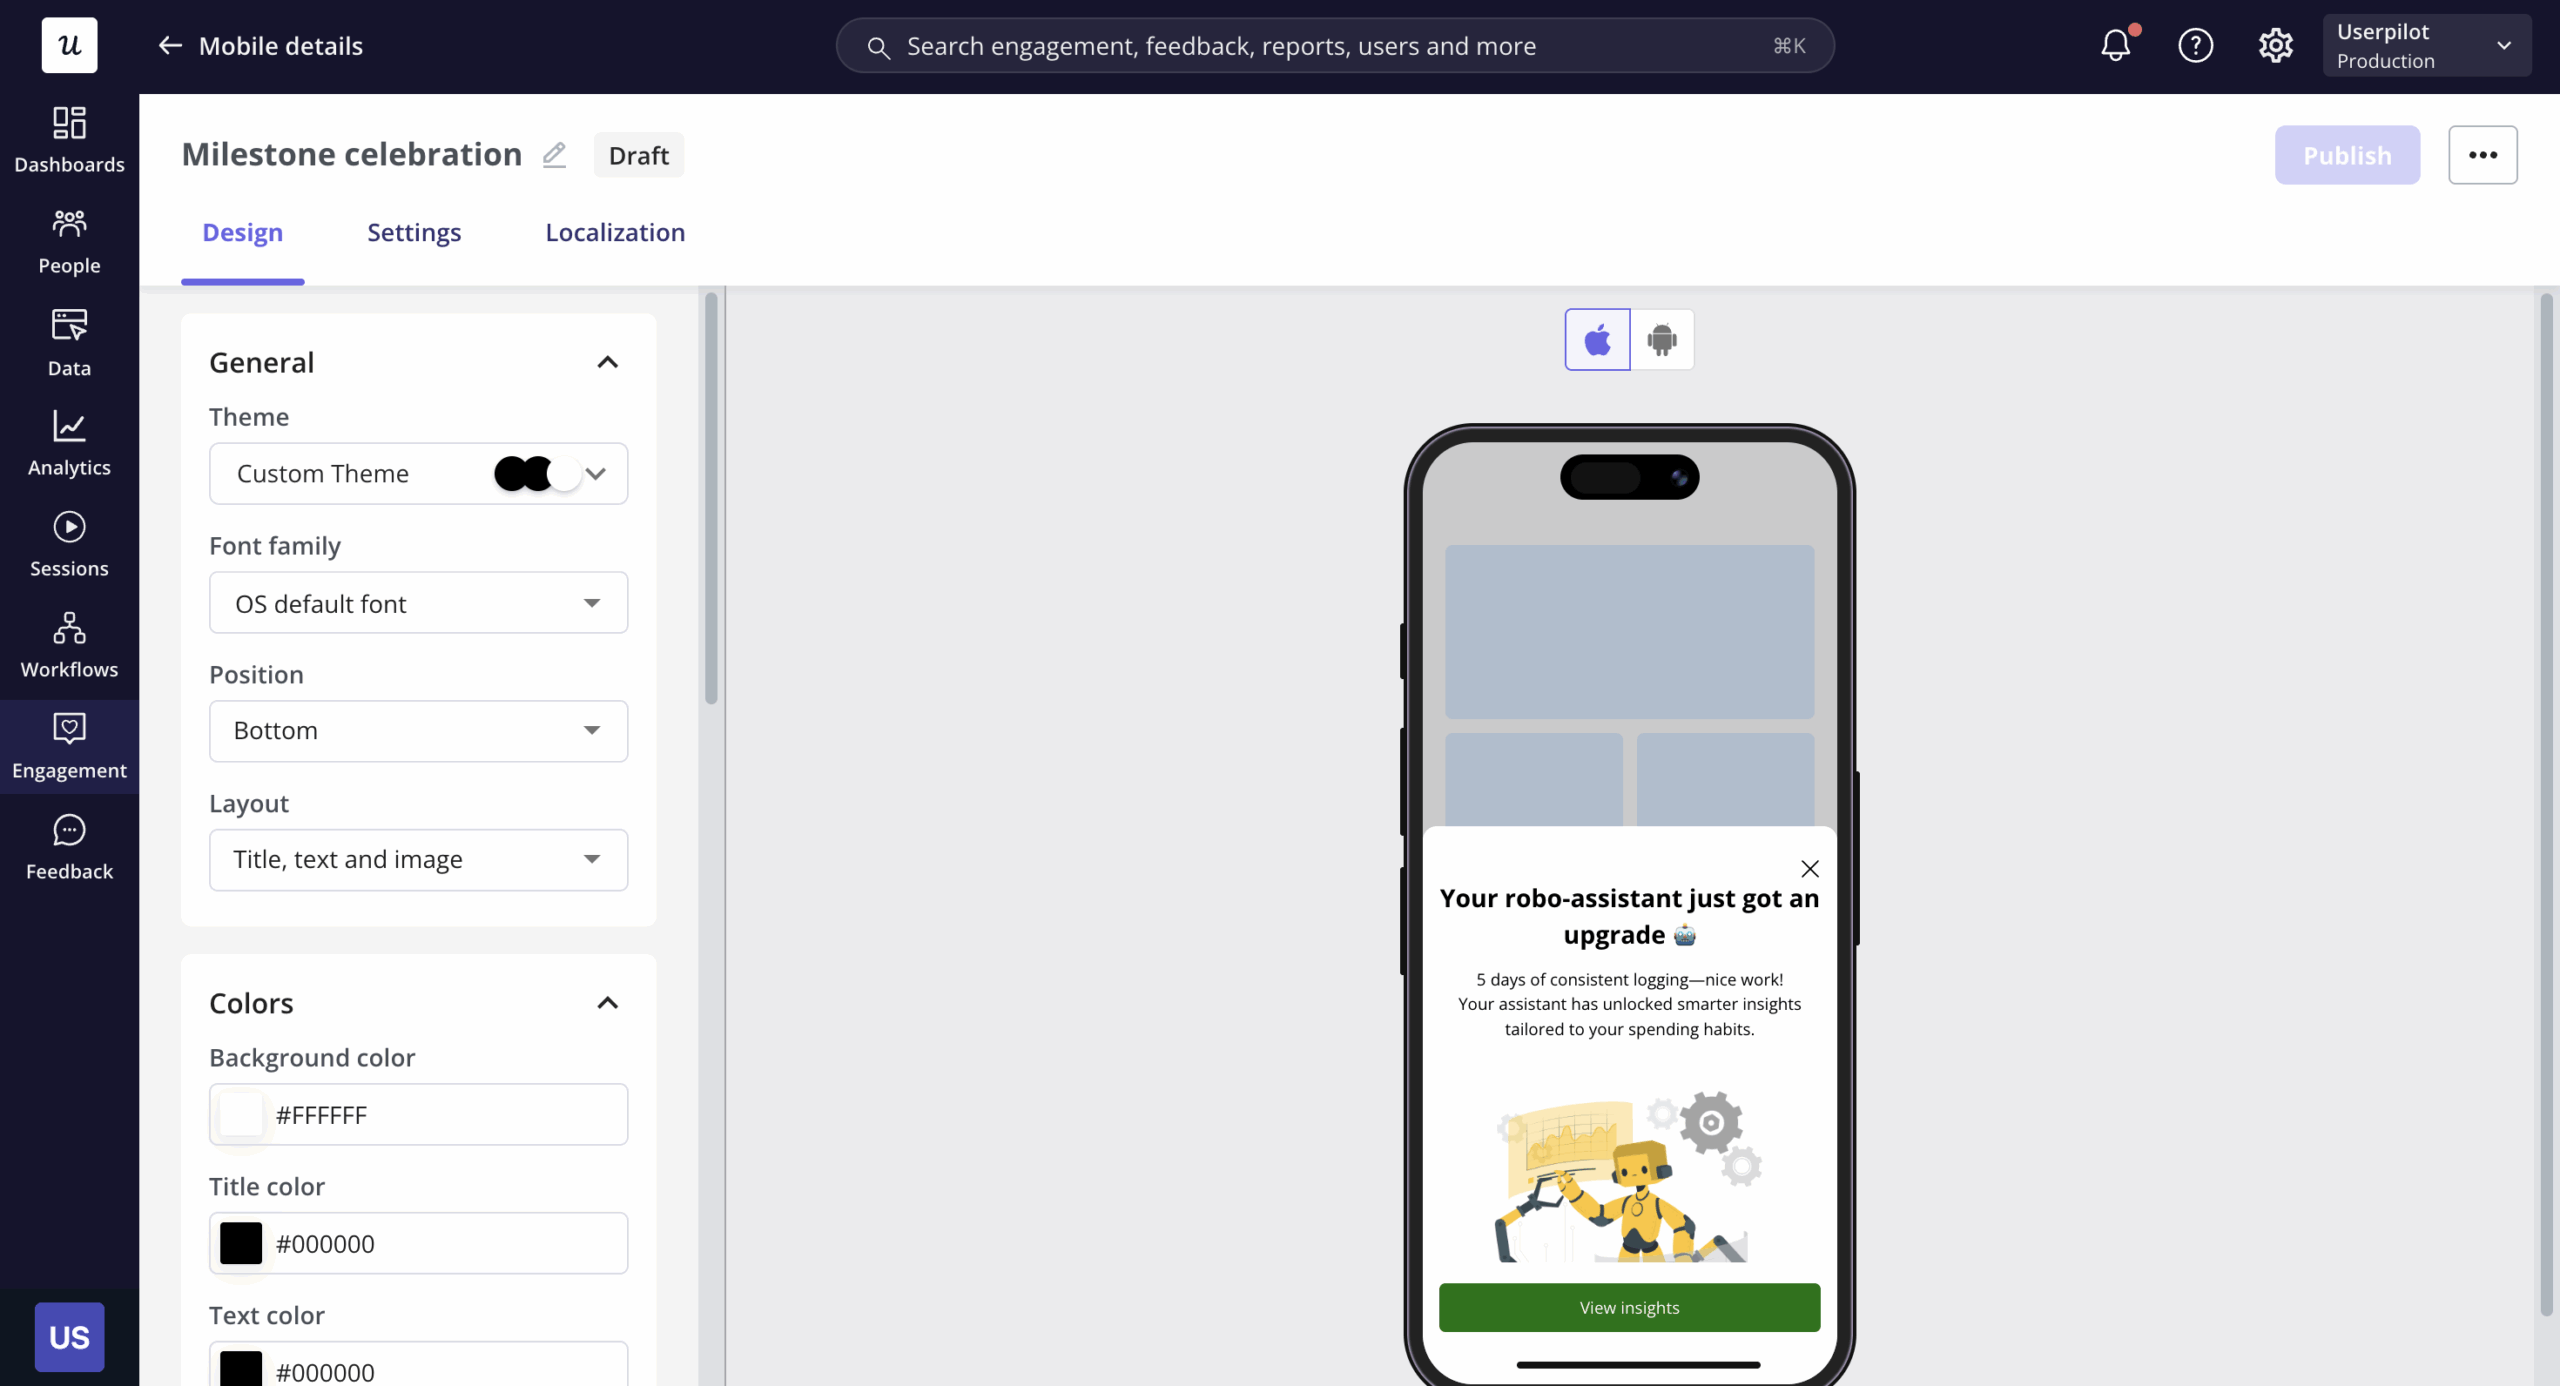
I know, I might be biased here. But if you’re looking for a tool that brings together product analytics and in-app engagement across both mobile and web, Userpilot is worth your consideration. It’s especially great for product and growth teams who want to drive user engagement, improve app performance, and act on insights without relying too much on engineering.
Also, we recently launched full support for mobile analytics, which builds on our existing web capabilities. Now, you can track how users interact with your app across platforms, understand their behavior in context, and respond with in-app experiences, all from the same dashboard.
Main features:
- Autocapture for web and event-based tracking for mobile: On web apps, we support autocapture, which means it can automatically track user interactions like clicks, form inputs, or page visits. On mobile apps, we offer event-based tracking via SDKs. This means your team explicitly defines and sends events (e.g., “Completed onboarding,” “Clicked upgrade,” etc.) using methods like track() in the iOS or Android SDK.
These tracked events can include metadata and are used to:
- Trigger in-app experiences.
- Segment users.
- Measure feature adoption and onboarding progress.
- Session replays: Watch user sessions to understand app behavior in context, spot bugs, or troubleshoot where users are getting stuck.
- Analytics dashboard: Gives you a centralized view of key metrics like retention, feature adoption, and account expansion, alongside user behavior and conversion trends.
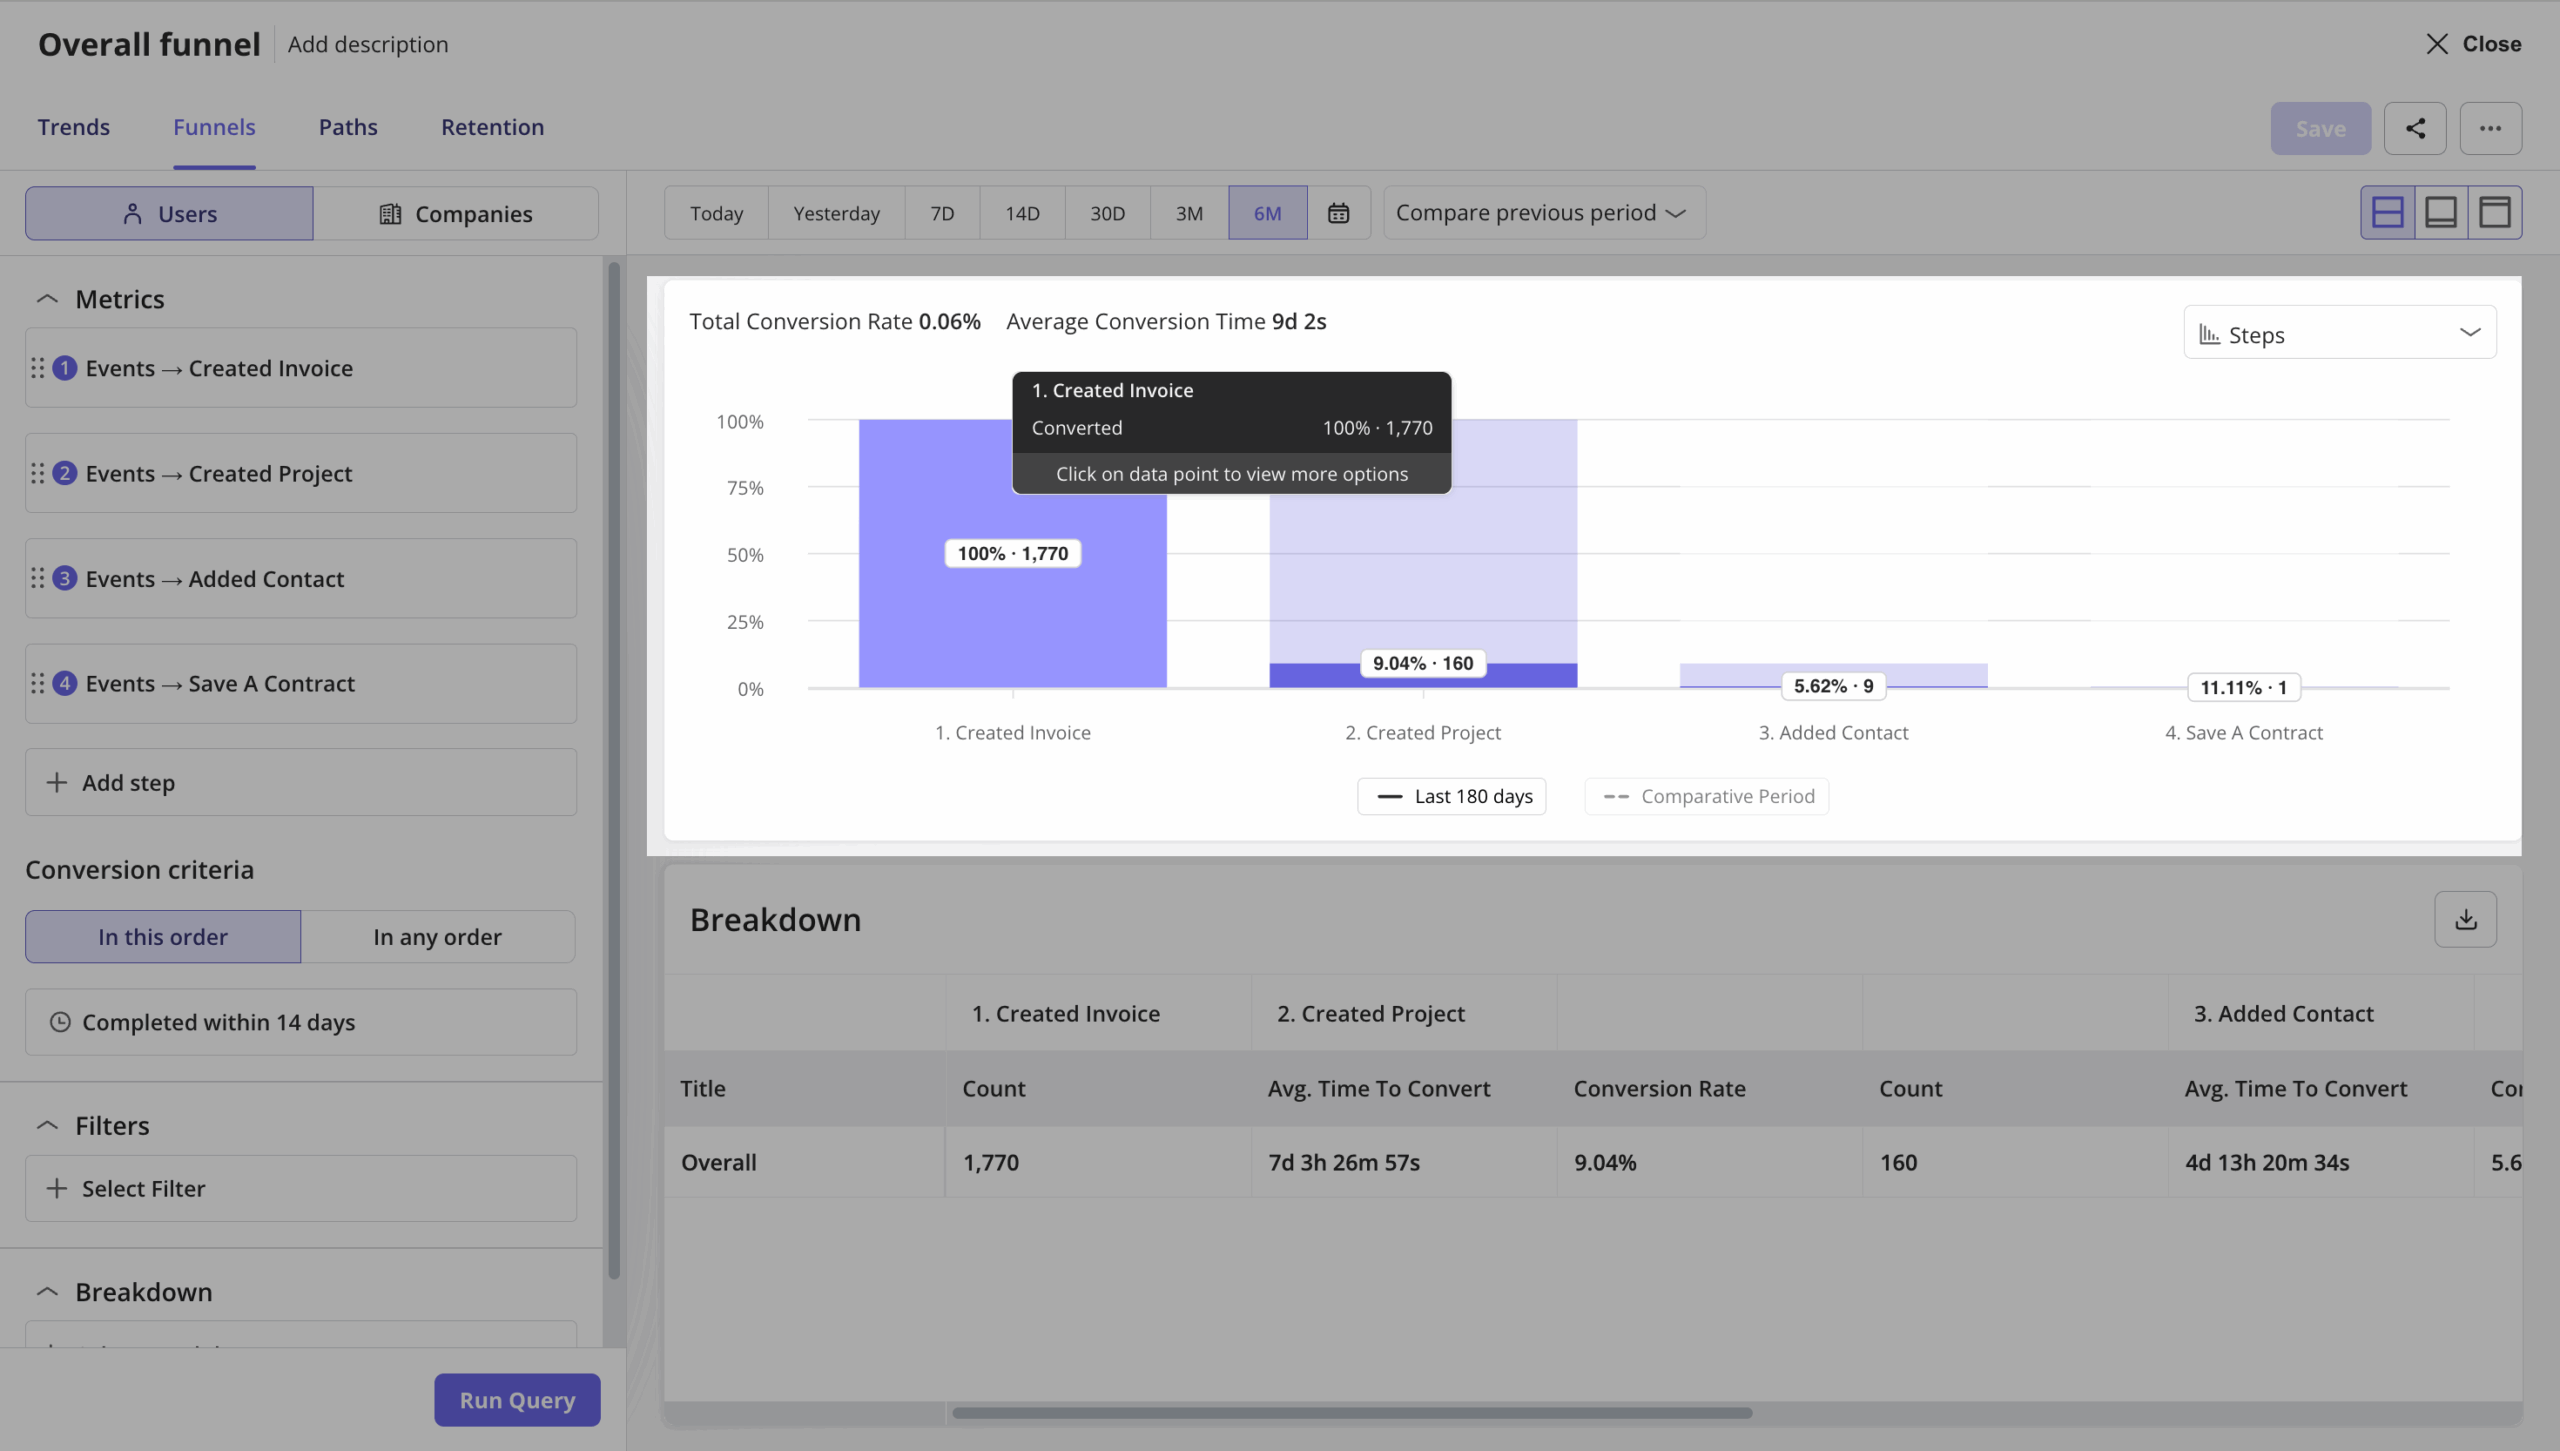
- Custom analytics reports: Build funnels, path analyses, and retention breakdowns so you can quickly find actionable insights and optimize user journeys over time.
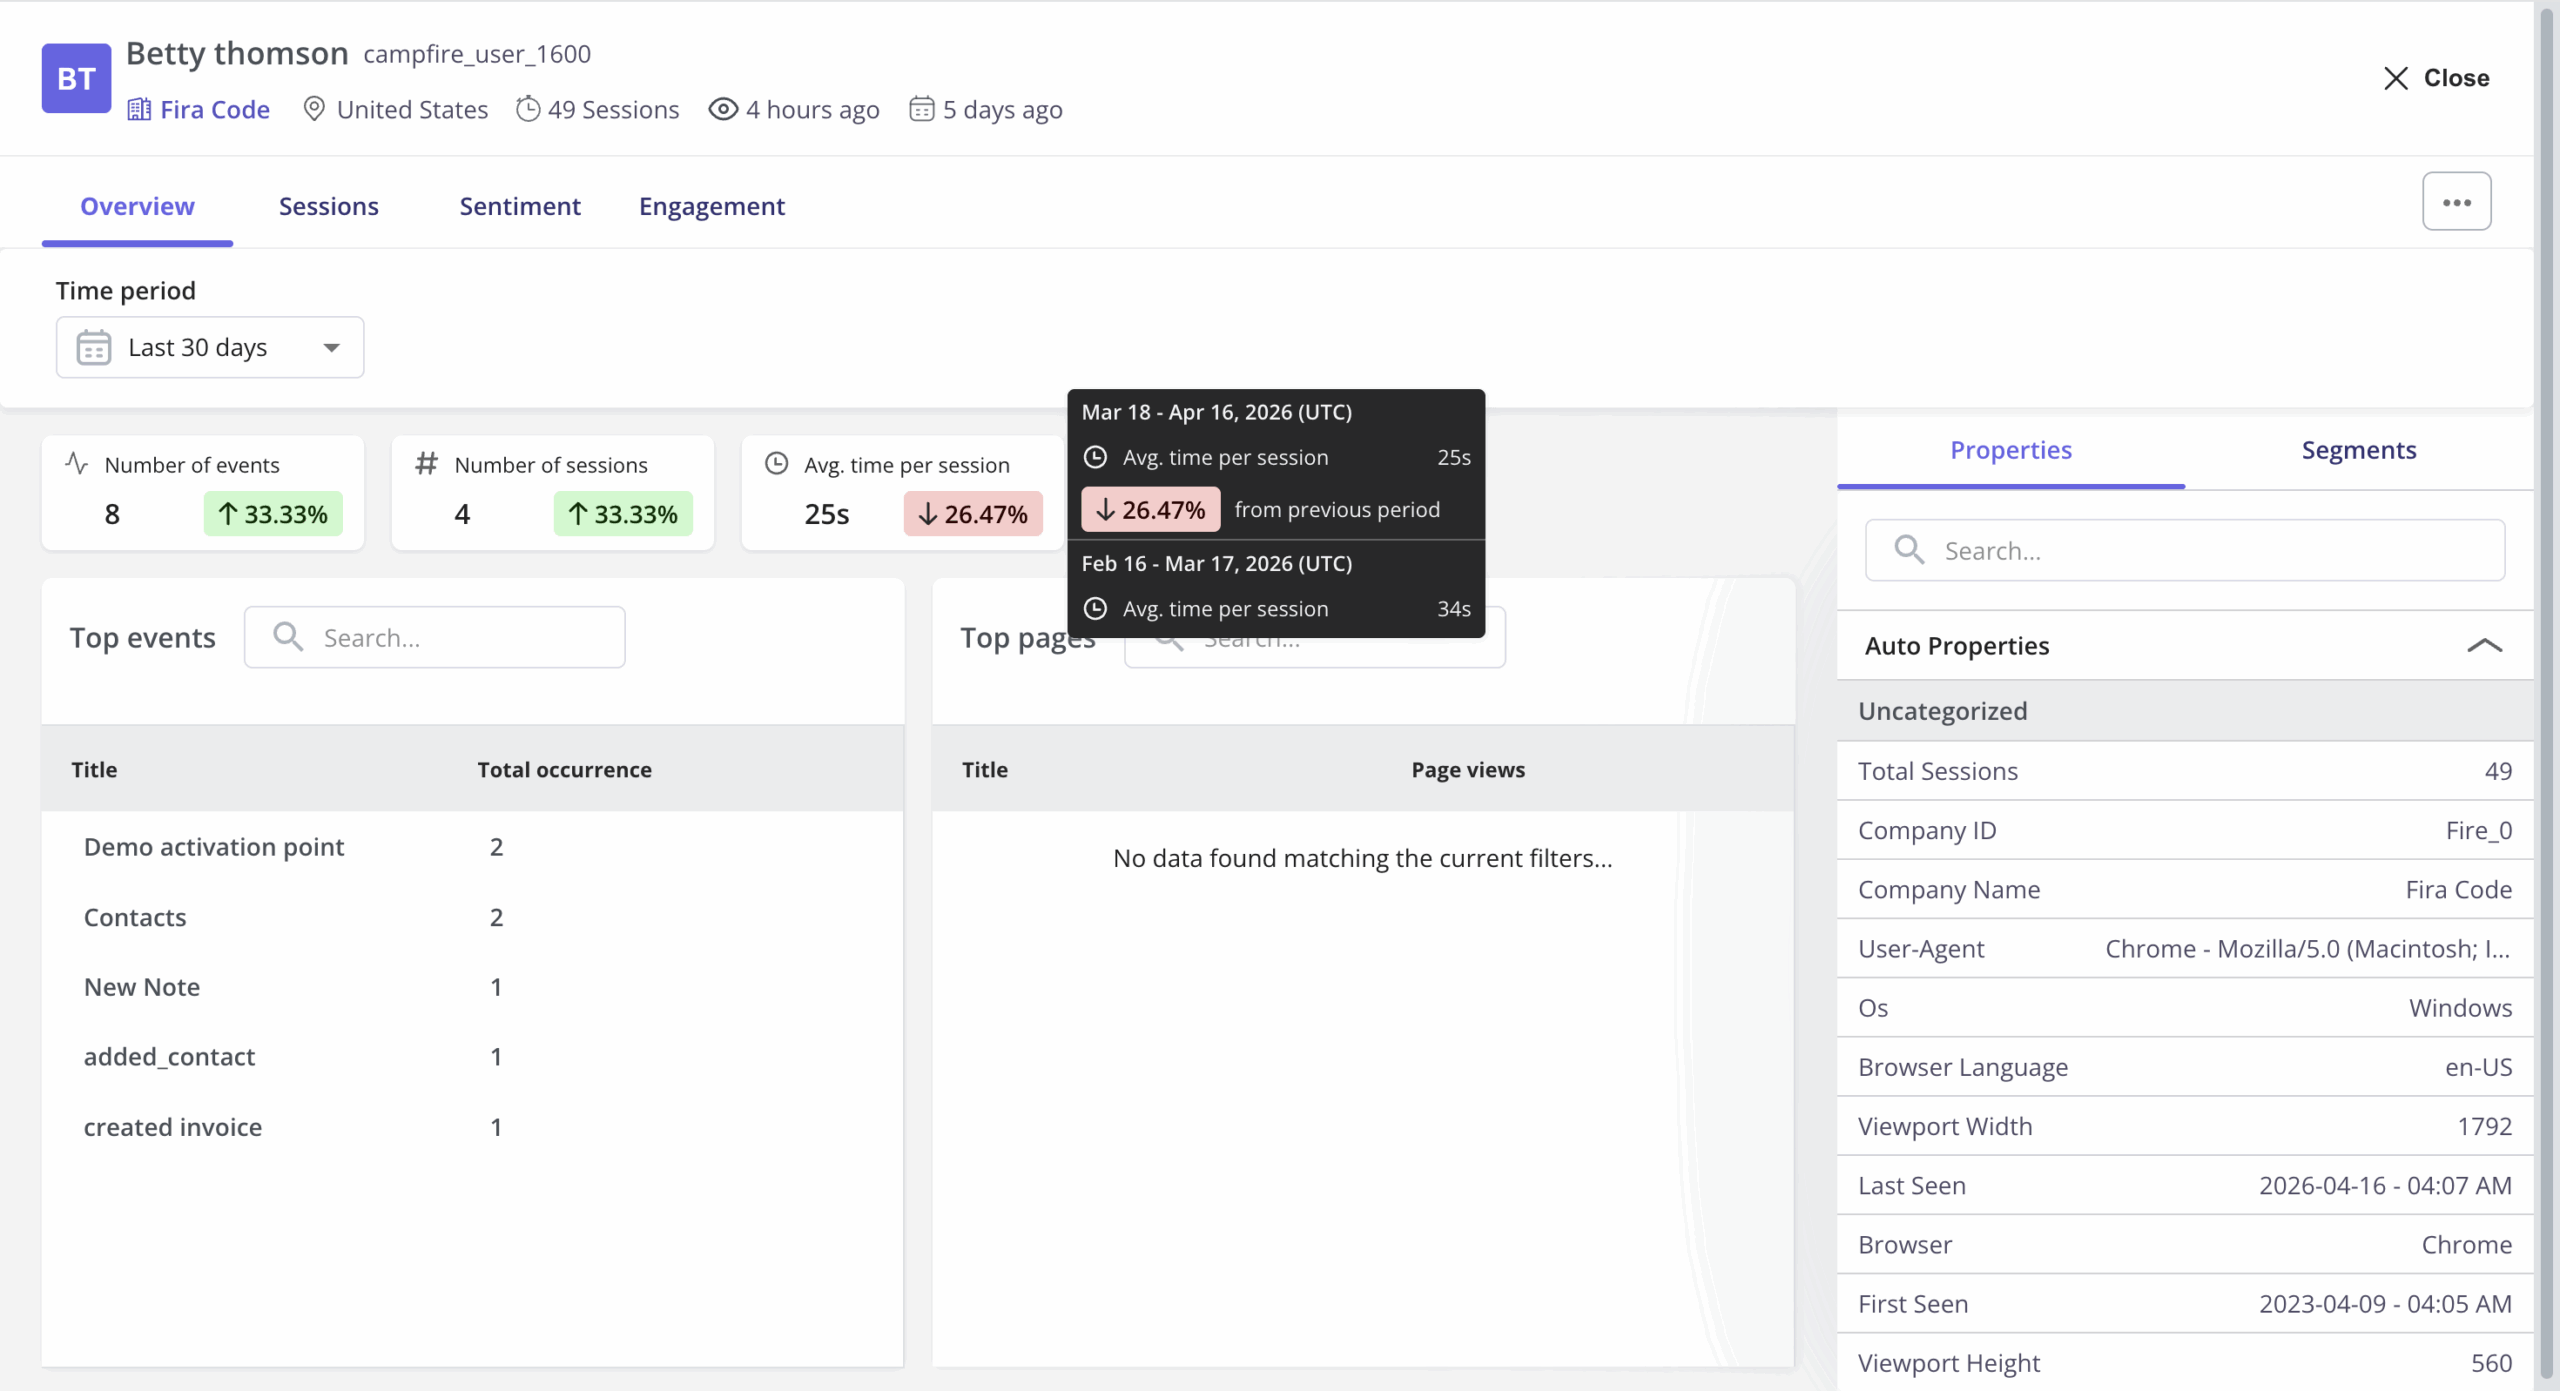
- User and company profiles: Bring together timelines of activity across mobile and web, so you can understand how each customer or account interacts with your product overall.
Beyond mobile and web analytics, Userpilot also helps you engage users directly with personalized in-app messaging. You can launch onboarding flows, tooltips, nudges, or checklists based on user behavior on both mobile and web, all without writing any code. This makes it easier to guide users when they’re stuck or highlight features they might have missed.
The newly added mobile support has made it much more convenient for teams to analyze mobile data alongside web, and act on it. But don’t just take my word for it. Here’s what one of our mobile users had to say:
Top mobile analytics platforms for mobile marketing performance
Running campaigns to grow your user base means constantly asking: which channels are actually working? This group of tools can help you with exactly that.
They let you track installs, map user journeys back to campaigns, and measure how your marketing spend translates into real results. All of this is super useful if you care about acquisition and attribution, which is why I’ve made this a category of its own.
#5 AppsFlyer for mobile attribution and marketing analytics
💰 Pricing: AppsFlyer has a free plan, with the paid tiers starting at at $0.07 per conversion. Per Vendr data, real negotiated deals often land around $12,000 – $246,400 per annum.
🌟 G2 rating: 4.5/5 based on 680+ reviews.
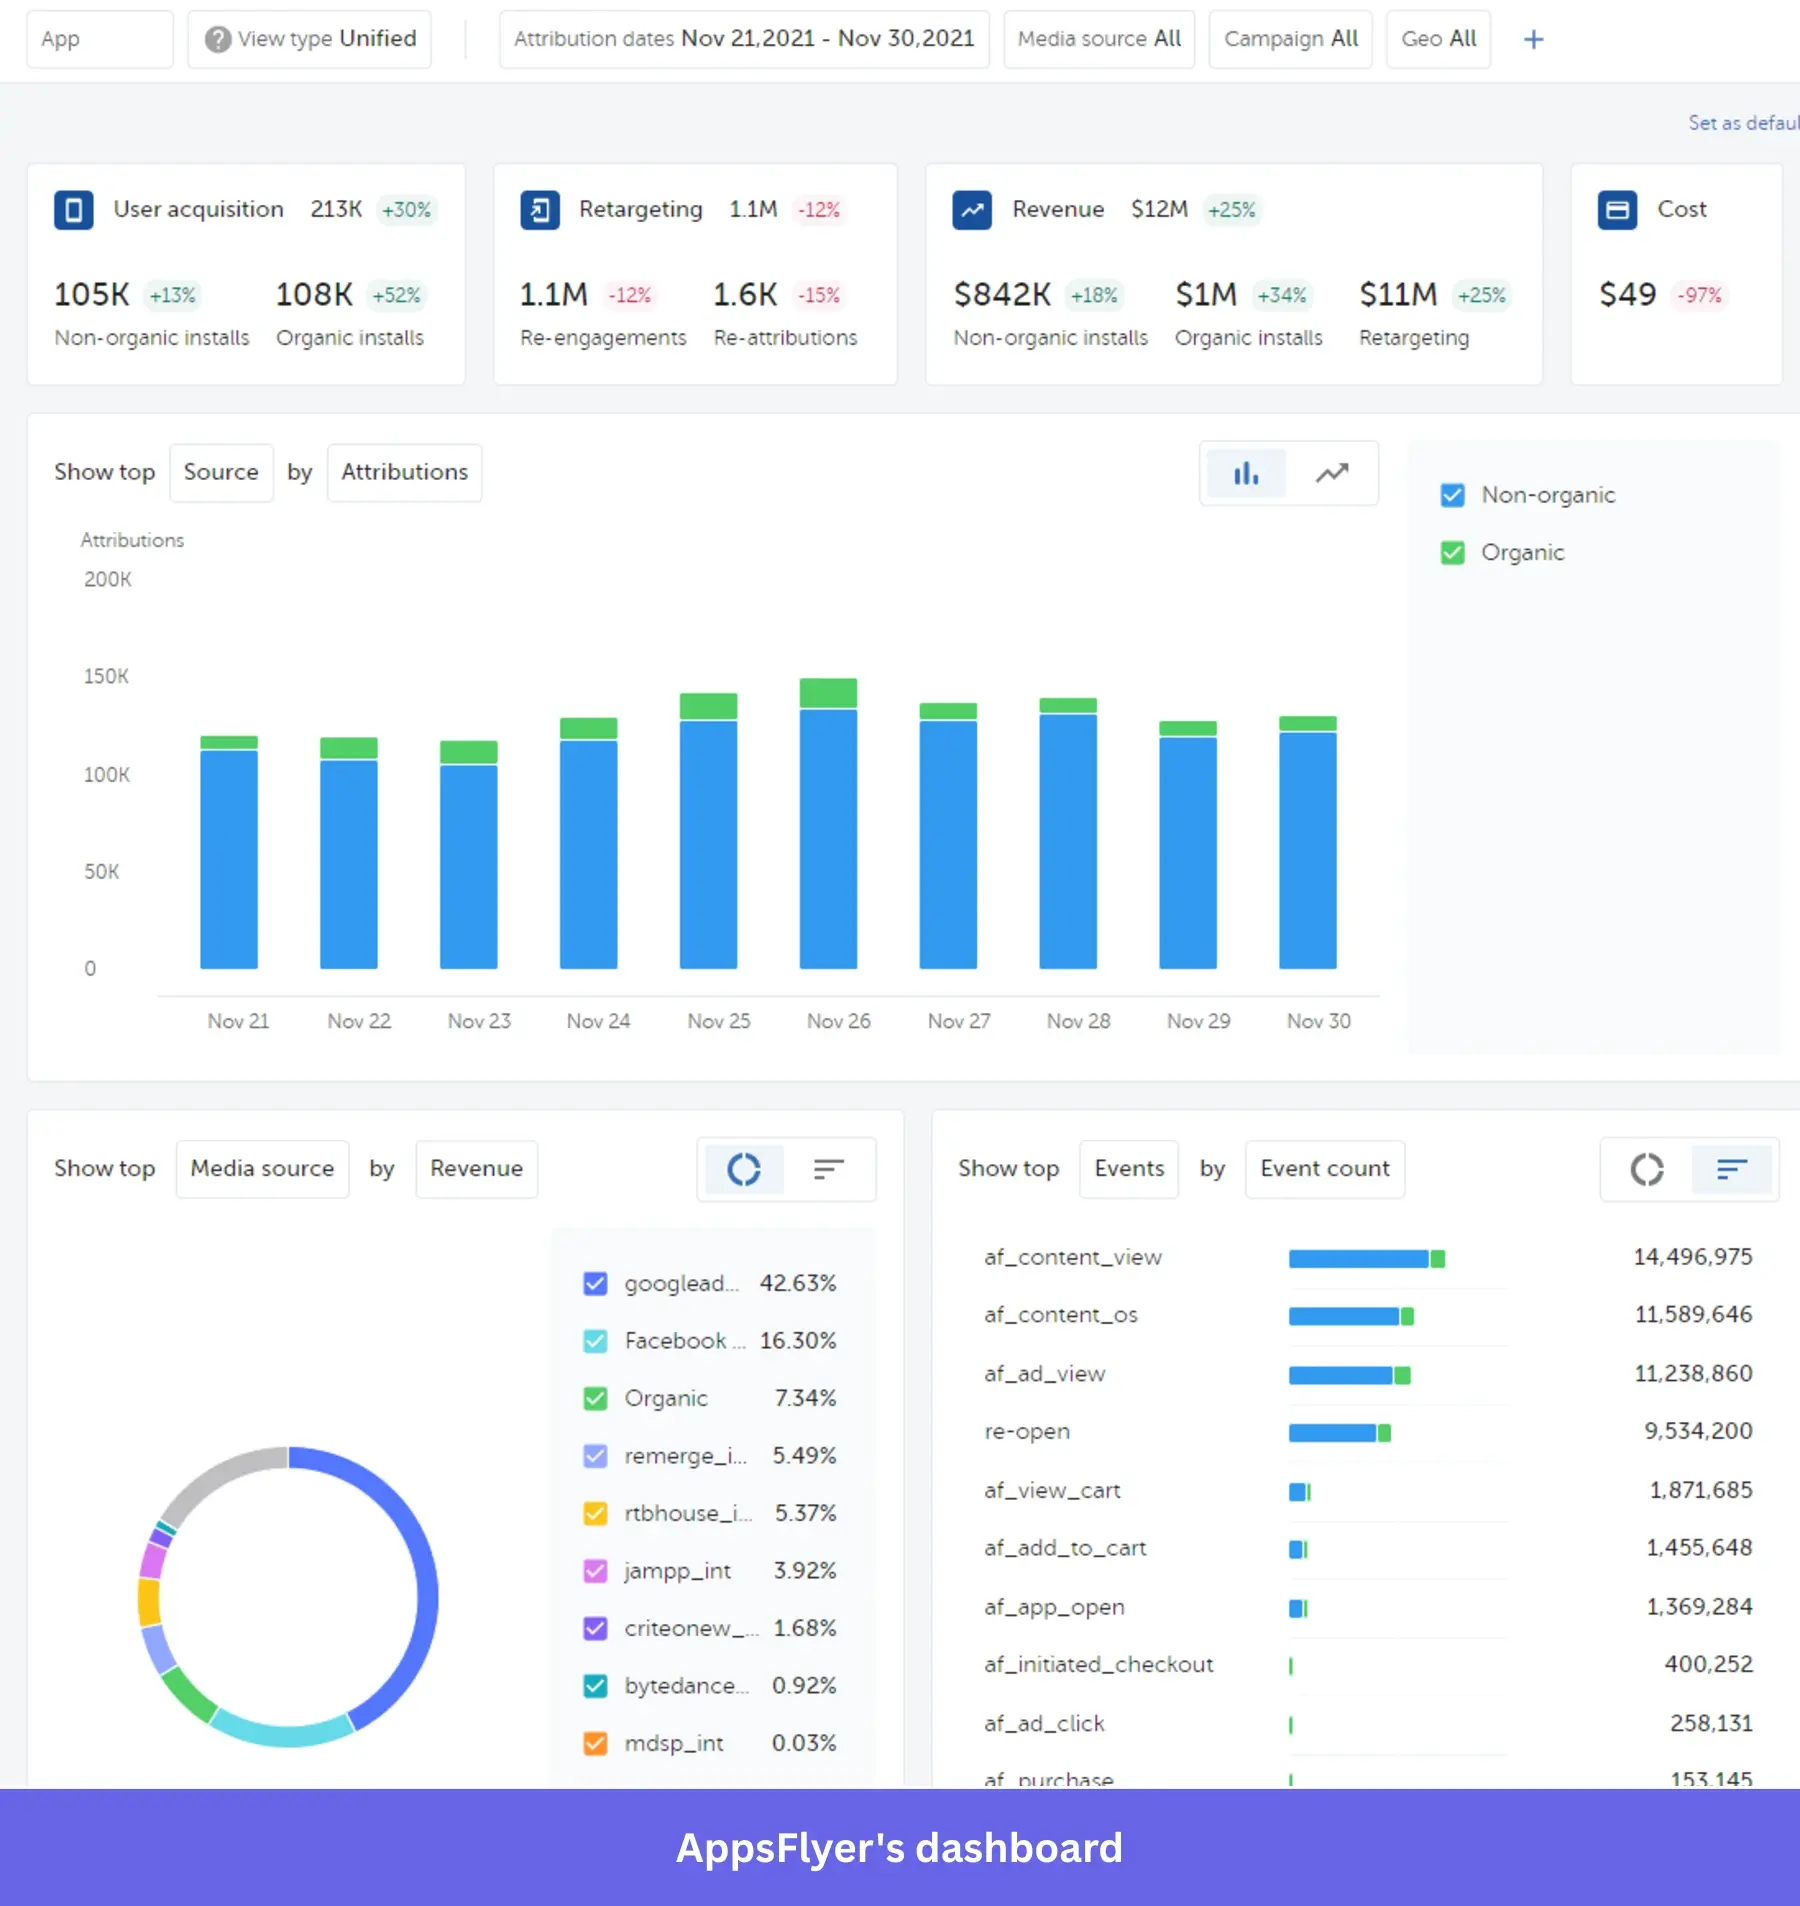
If you’re running marketing campaigns to drive installs, AppsFlyer is one of the tools I’d recommend first. It’s built for mobile attribution and gives you a clear view of where users are coming from, which campaigns are converting, and how your spend translates into results.
However, it’s worth noting that AppsFlyer doesn’t come with in-app behavior analytics, so you’ll likely need a separate analytics tool for that.
Main features:
- Install attribution: Track the full journey from ad click to install to see exactly which campaigns drive results.
- Deep linking: Improve user activation and conversion by sending new users to high-value in-app screens after they click an ad.
- ROAS dashboards: Tie campaign spend to in-app revenue with real-time return on ad spend reporting.
“The dashboard provides clear understanding of revenue clicks and installs per day.” — Anjali on G2.
- Partner integrations: Connect with a wide network of ad networks and marketing partners for seamless campaign tracking.
“It integrates well with major ad platforms and helps us track campaign performance and optimize marketing effectively.” — Ngan on G2.
#6 RevenueCat for subscription revenue analytics
💰 Pricing: RevenueCat is free up to $2.5K monthly tracked revenue (MTR), then you’re charged 1% of your MTR.
🌟 G2 rating: 4.8/5 based on 200+ reviews.
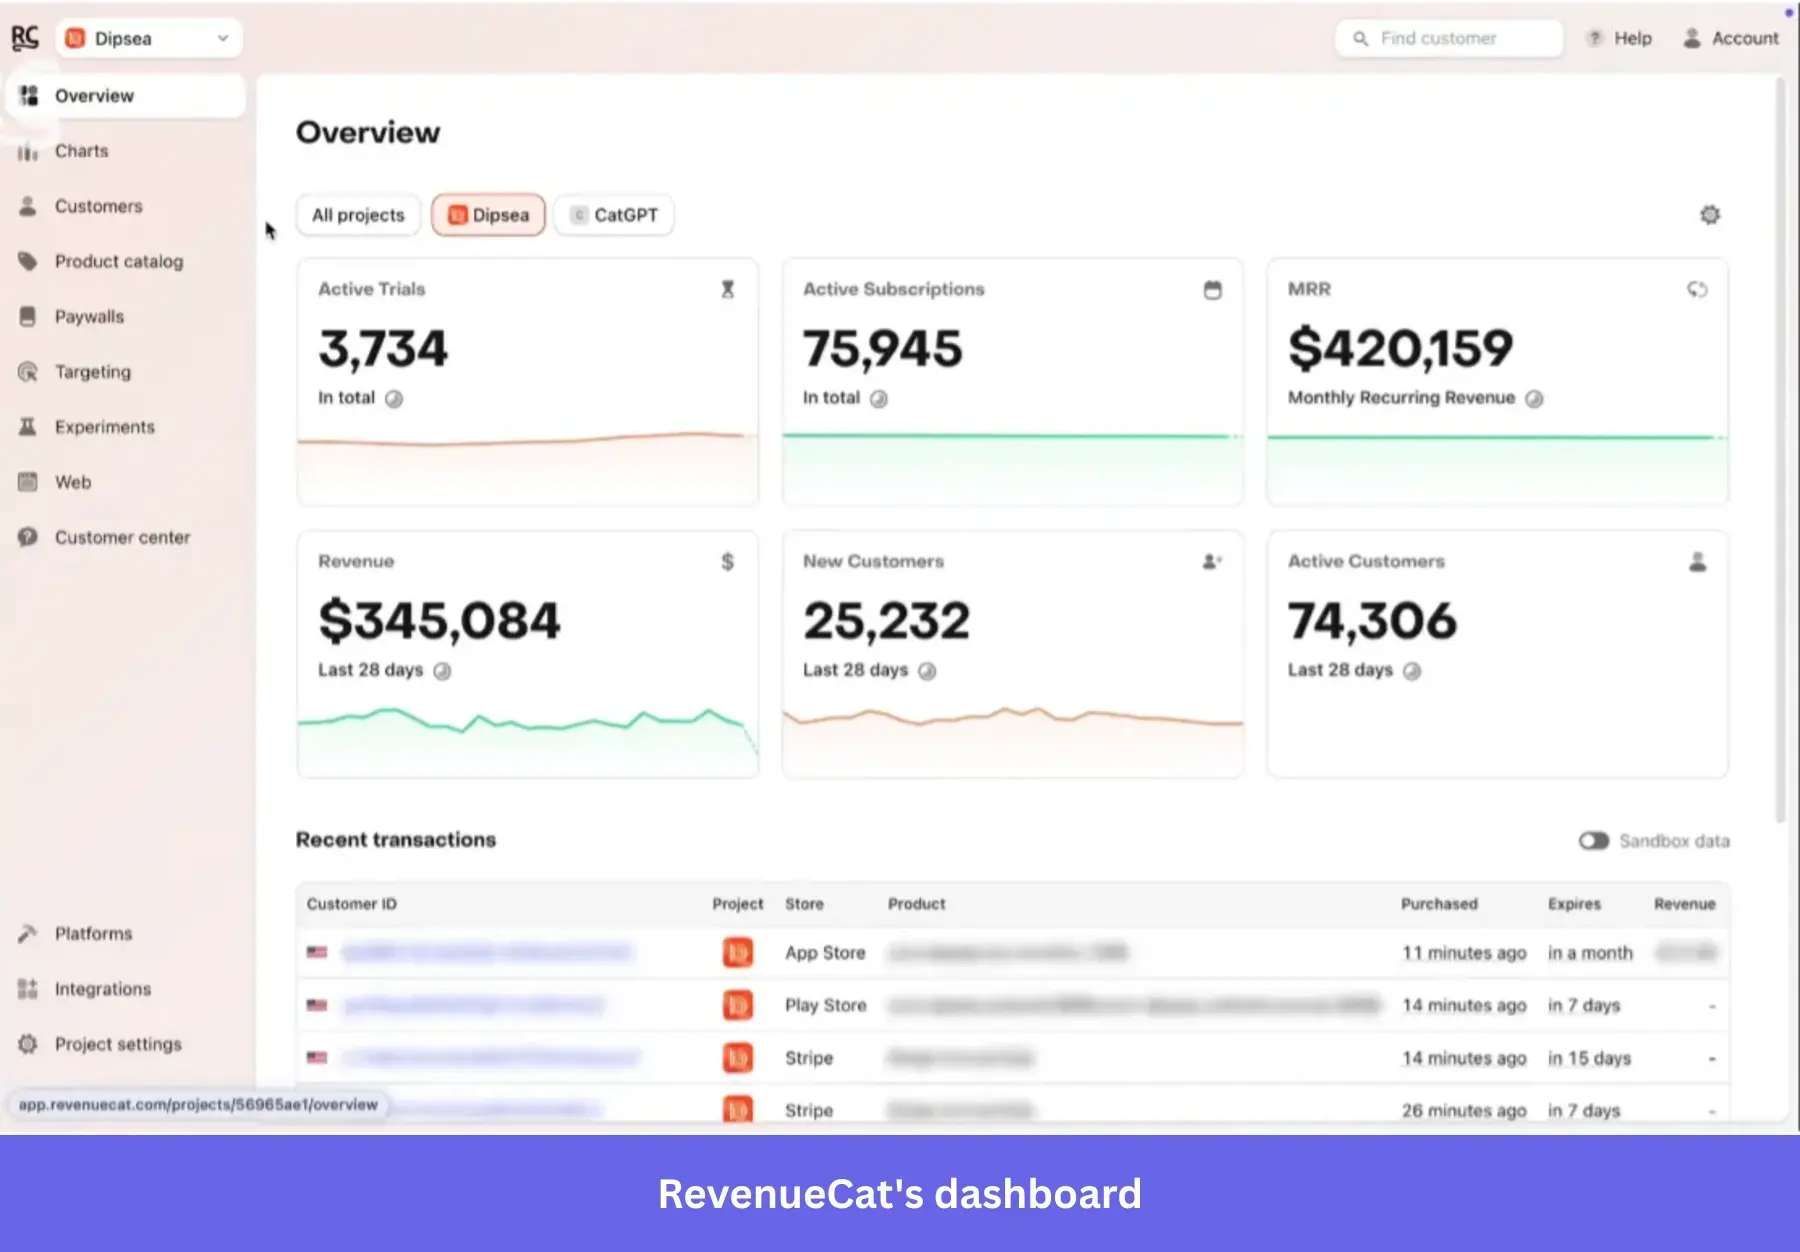
RevenueCat removes the complexity of managing in-app purchases across Apple and Google while giving you a clear view of your subscription revenue. Instead of stitching together billing logic and analytics yourself, you get a unified layer that handles purchases, validates receipts, and tracks metrics like MRR, churn, and lifetime value.
Note that its value is tightly tied to subscription models. You’ll get limited benefit from the platform if your app relies on one-time purchases or ad revenue.
Main features:
- Cross-platform subscription management: Use a single SDK to handle in-app purchases across iOS, Android, and web.
“RevenueCat makes subscription management incredibly simple. The SDK is easy to integrate, documentation is clear, and it saves a lot of time.” — Mudasir on G2.
- Subscription analytics: Track core metrics like MRR, churn, LTV, and trial conversion in real time with a unified and reliable data layer.
- Webhooks and integrations: Seamlessly trigger actions in your backend or marketing tools when subscription events occur.
- Remote paywalls: Design, test, and update paywalls without submitting new app builds, making it easier to run pricing and packaging experiments.
“I don’t like the number of paywall templates. Very limited. Few templates and not very customizable by default.” — User review on G2.
#7 AppFollow for ASO analytics and app store performance insights
💰 Pricing: Free plan available. Paid plans start at $129/mo, with typical contracts ranging from $2,925 to $22,596 per year based on usage and scale.
🌟 G2 rating: 4.6/5 based on 190+ reviews.
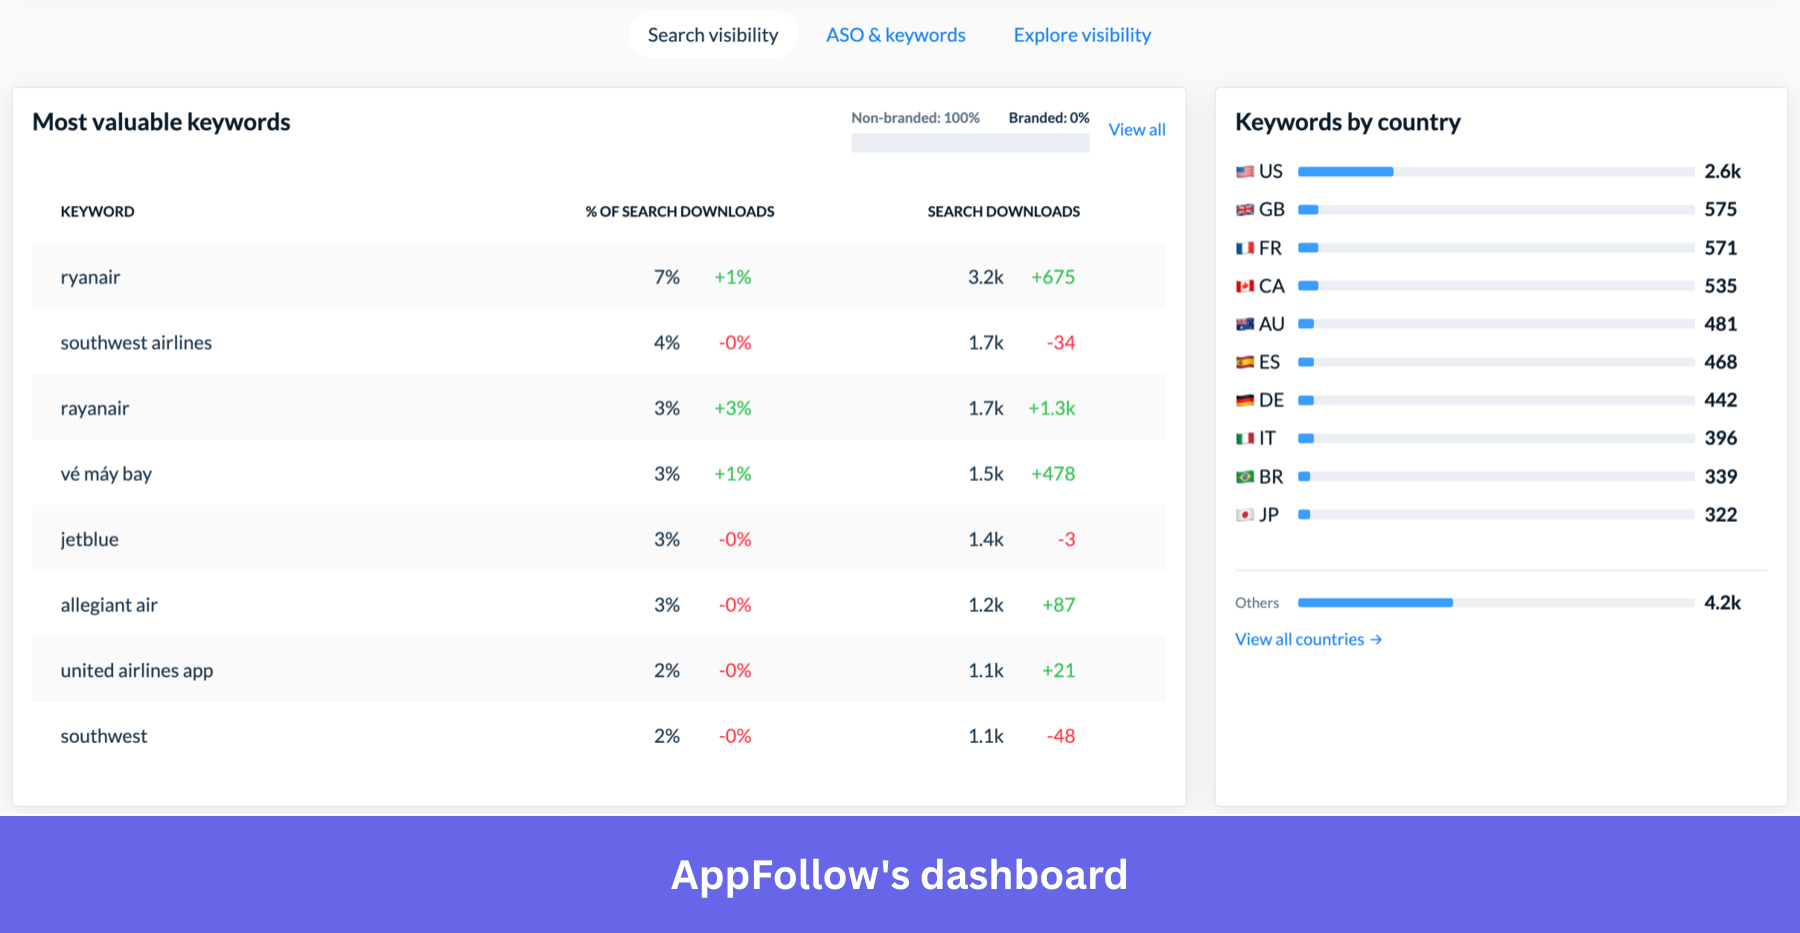
AppFollow is a great choice for marketing teams focused on visibility and reputation. It helps you track how your app ranks for specific keywords against competitors while giving your support team a central hub to respond to user reviews across multiple stores.
One of its biggest differentiators is that it lets you turn qualitative feedback into quantitative data. You can use AI to analyze the sentiment of thousands of reviews at once and identify exactly which bugs or feature requests are trending. It won’t tell you how long a user spent on your home screen, but it’s one of the best ways to ensure they actually find and download your app in the first place.
Main features:
- ASO intelligence: Track keyword rankings, monitor competitor metadata changes, and identify which search terms drive visibility and installs.
- Unified review management: Manage and respond to App Store and Google Play reviews from a single dashboard or through integrations like Slack and Zendesk.
“I love AppFollow for its real-time updates on reviews from the App Store and Play Store, which helps us stay aligned and ensure that we understand and address every customer’s feedback.” — Yatin on G2.
- Competitor and performance analytics: See how your app stacks up in impressions, app downloads, and conversion rates.
- AI-powered sentiment analysis: Automatically categorize reviews into themes like bugs, feature requests, or complaints to spot trends and prioritize fixes.
“Sometimes Al shows wrong info about the google play console rating.” — Alexey on G2.
#8 UXCam for mobile behavioral analytics
💰 Pricing: UXCam offers a free plan for up to 3,000 monthly sessions. The paid plans are quote-based, but Vendr reports the median buyer pays $20,991 per year.
🌟 G2 rating: 4.6/5 based on 200+ reviews.
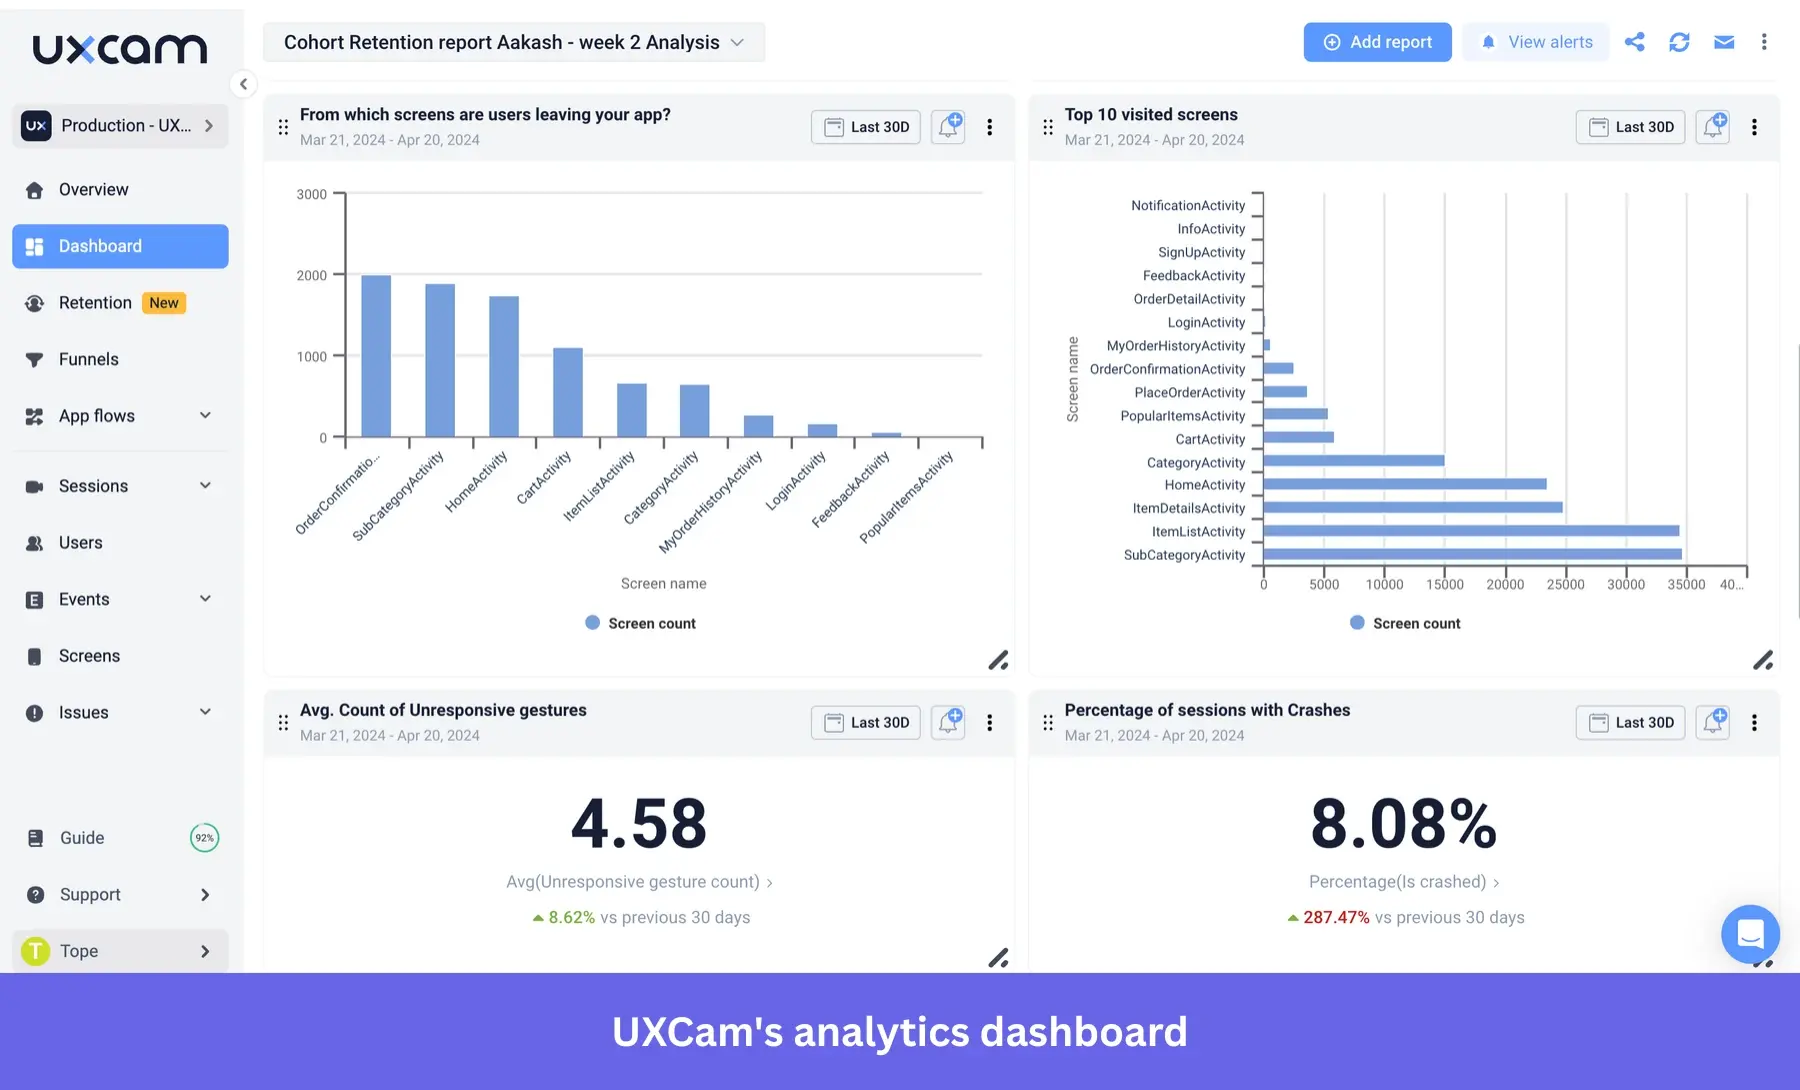
UXCam is built for teams that need to go beyond the charts and basic usage logs offered by other tools to understand how users actually experience their app. By combining session replays with heatmaps and event tracking, it lets you observe user interactions and uncover the “why” behind drop-offs, confusion, or friction in your UI.
However, this level of insight comes at a premium. UXCam is one of the more expensive tools on this list, and the volume of session replay data can become difficult to manage without a clear focus.
Main features:
- Session replay: Watch user sessions to understand exactly what happened before a drop-off, bug, or moment of confusion.
“UXCam makes it really easy to see how users interact with our product.” — Vijay on G2.
- Heatmaps and interaction analytics: Visualize where users tap, scroll, and engage to identify high-interest and problematic areas in your UI.
- Frustration signals: Detect rage taps, unresponsive gestures, and repeated actions that indicate user frustration.
- Screen-level insights: Analyze performance and behavior at the screen level to see which parts of your app drive engagement or friction.
“The depth of analytics compared to tools like Mixpanel or Amplitude isn’t as extensive, particularly when it comes to advanced event tracking and segmentation.” — Akshay on G2.
Top app analytics tools for mobile app performance data
When something breaks in your app, most users won’t report it. They simply leave. That’s why you need tools that surface crashes, errors, and performance issues early, so you can fix them before they affect retention.
If you work closely with engineering or QA, or care about app stability as much as user behavior, these tools will help you monitor performance and catch problems before they escalate.
#9 Sentry for crash diagnostics and error tracking
💰 Pricing: Free for solo devs (1 user). Paid plans start at $26/month for teams, but costs can rise quickly. According to Vendr, companies pay $11,221 – $267,077 per annum.
🌟 G2 rating: 4.5/5 based on 230+ reviews.
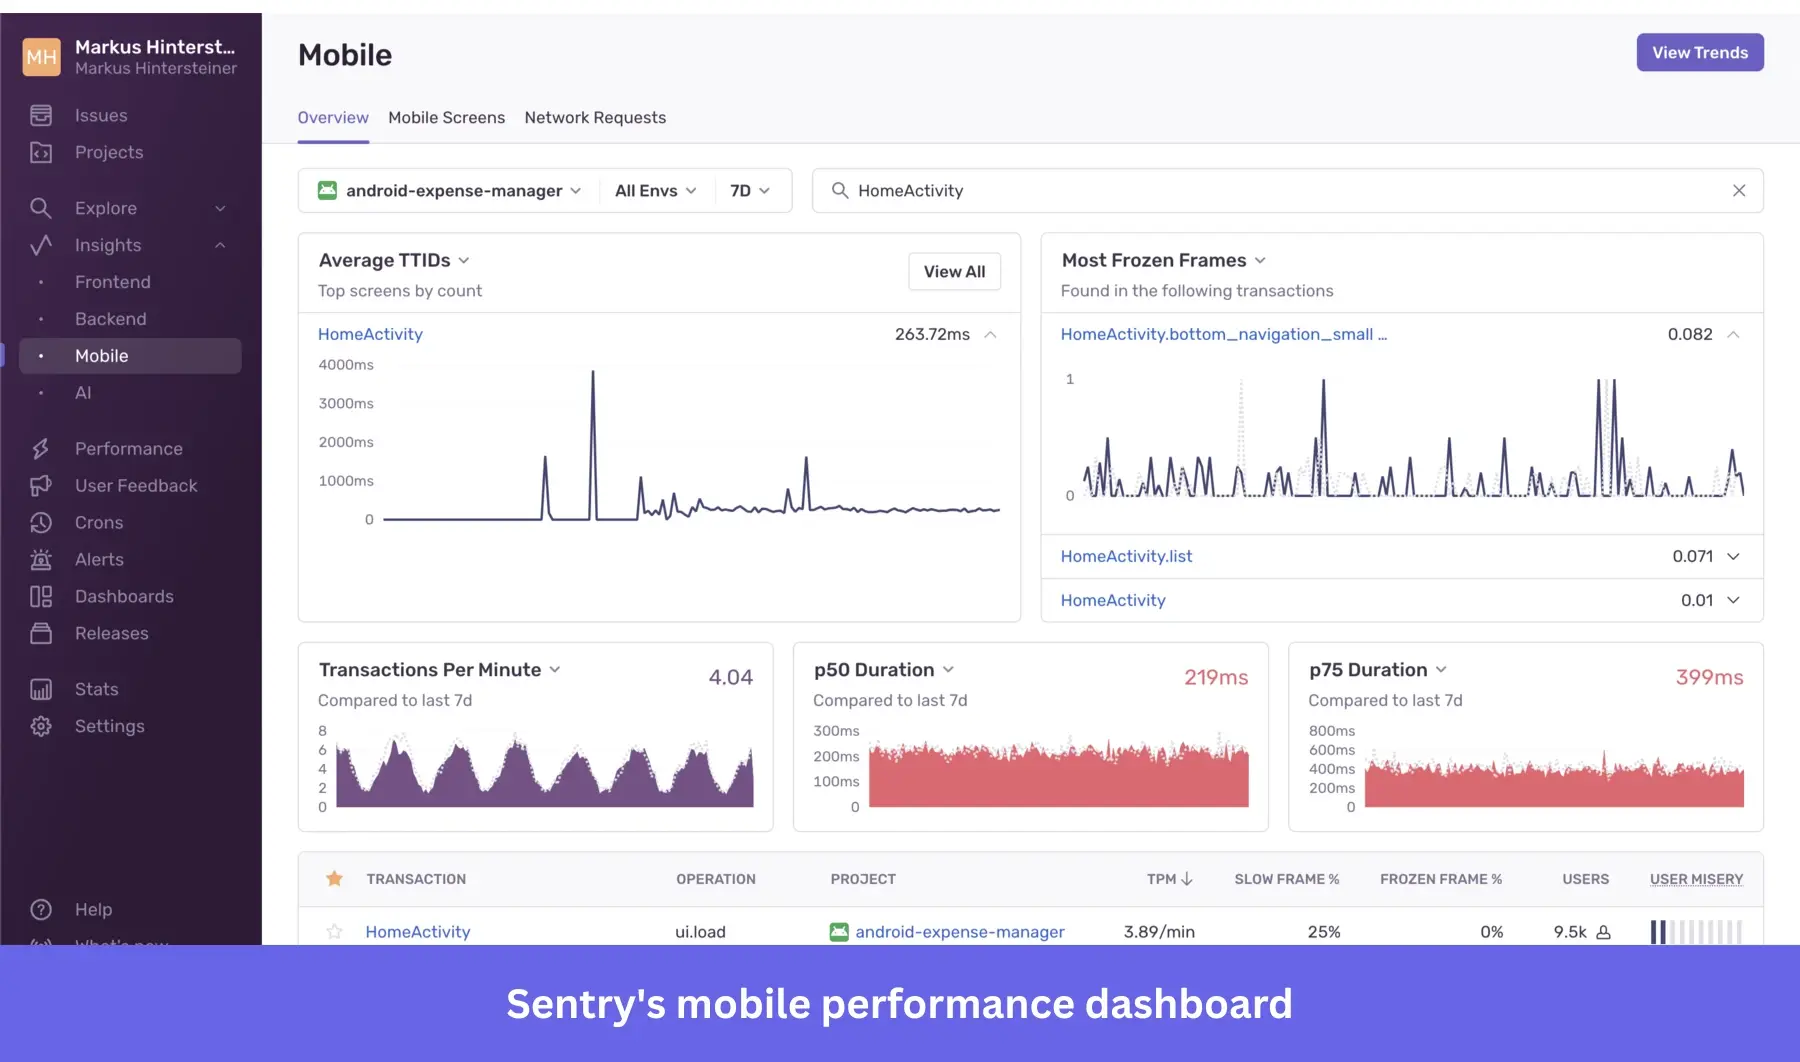
Sentry is designed to alert you the moment your app crashes, often before users report the issue. It provides deep technical context (such as stack traces and device state) that app developers need to diagnose and fix bugs quickly.
It’s worth noting that this isn’t a product analytics tool. It can’t track feature adoption, but it helps ensure those features actually work as intended.
Main features:
- Performance monitoring: Track app speed and latency across key flows like screen loads or transactions to catch slowdowns early.
“Sentry is really helpful for developers. It shows when something go wrong in app righ away.” — Saurabh on G2.
- Issue grouping: Automatically group similar errors so you can prioritize and resolve recurring issues faster.
- Release tracking: Monitor performance and error rates by app version to detect regressions after deployments.
- Session context: See what users were doing right before an error occurred to better understand and reproduce issues.
“The initial setup and configuration can take some time to get right, especially when fine-tuning alert thresholds to avoid noise.” — Oscar on G2.
#10 PostHog for open-source product analytics
💰 Pricing: PostHog offers a generous free plan and a self-hosted option. The paid tier is pay-as-you-go based on your needs. Vendr shows companies pay $54,429 -$79,373 per year.
🌟 G2 rating: 4.5/5 based on 1,000+ reviews.
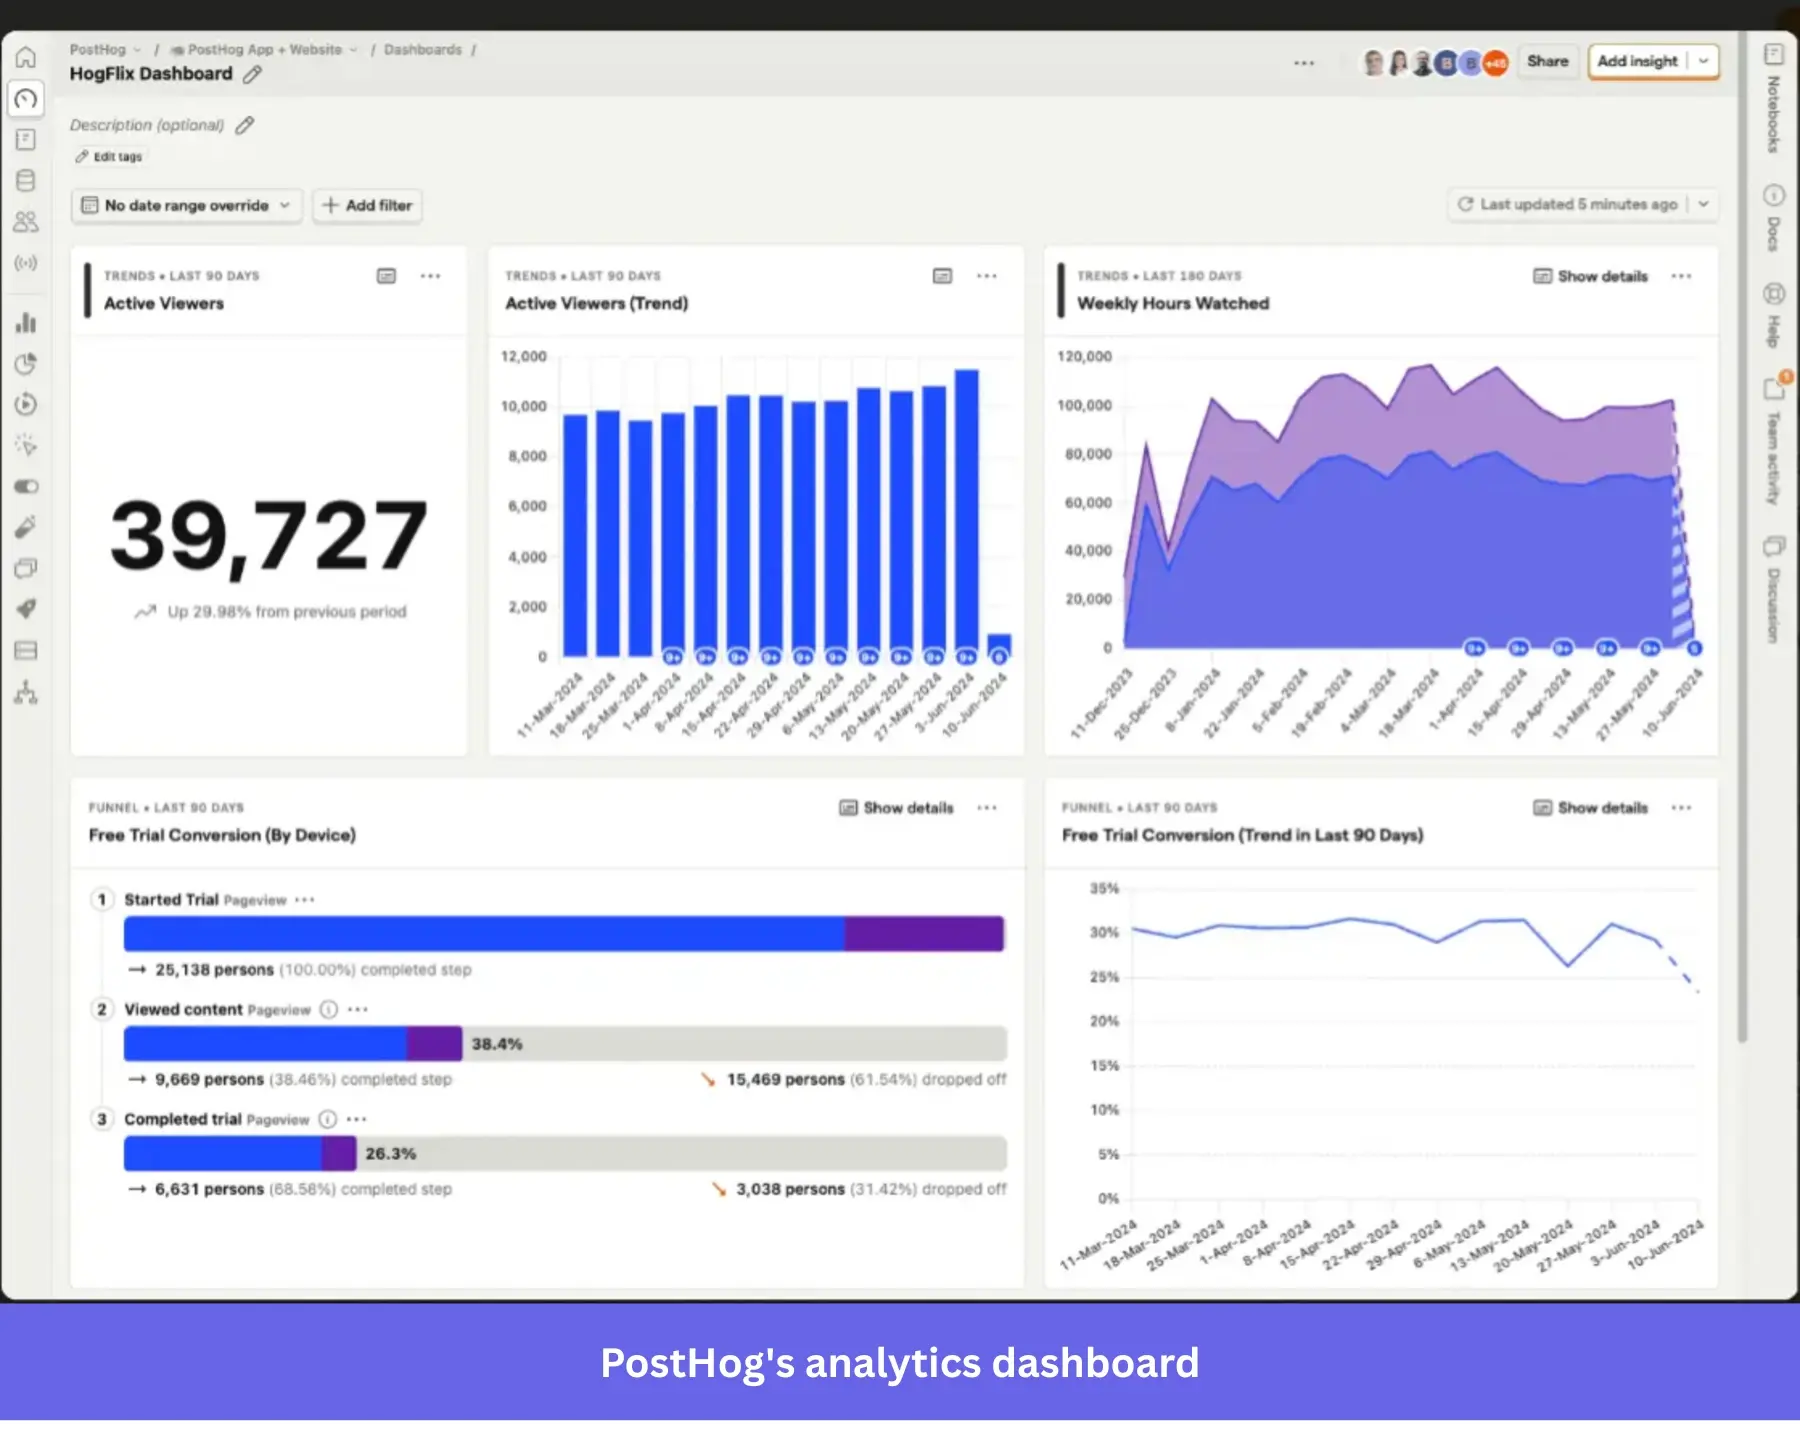
What makes PostHog stand out is its developer-first approach. It started as an open-source alternative to traditional analytics tools, offering deep flexibility through features like SQL access and the option to self-host for full control over your raw data. More recently, the platform has expanded its cloud offering for teams that prefer a managed setup.
That flexibility does come with trade-offs. The platform can feel complex for non-technical teams, and many features still require engineering involvement to set up and use effectively.
Main features:
- Autocapture: Automatically track user interactions like clicks, pageviews, and events without manually instrumenting every action.
- Session replays: Watch sessions to debug issues without relying solely on only on event data.
“I appreciate the session replay feature and how seamlessly it integrates with other analytics tools.” — Conor on G2.
- Funnels and retention analysis: Track user journeys and measure how behavior impacts engagement and retention.
- Feature flags and experimentation: Roll out features safely, run A/B tests, and measure impact without needing separate tools.
“I find PostHog to be unintuitive and overwhelming for new users, including myself, who need to watch instructional videos to understand its functionalities despite a strong background in technology.” — Uroš on G2.
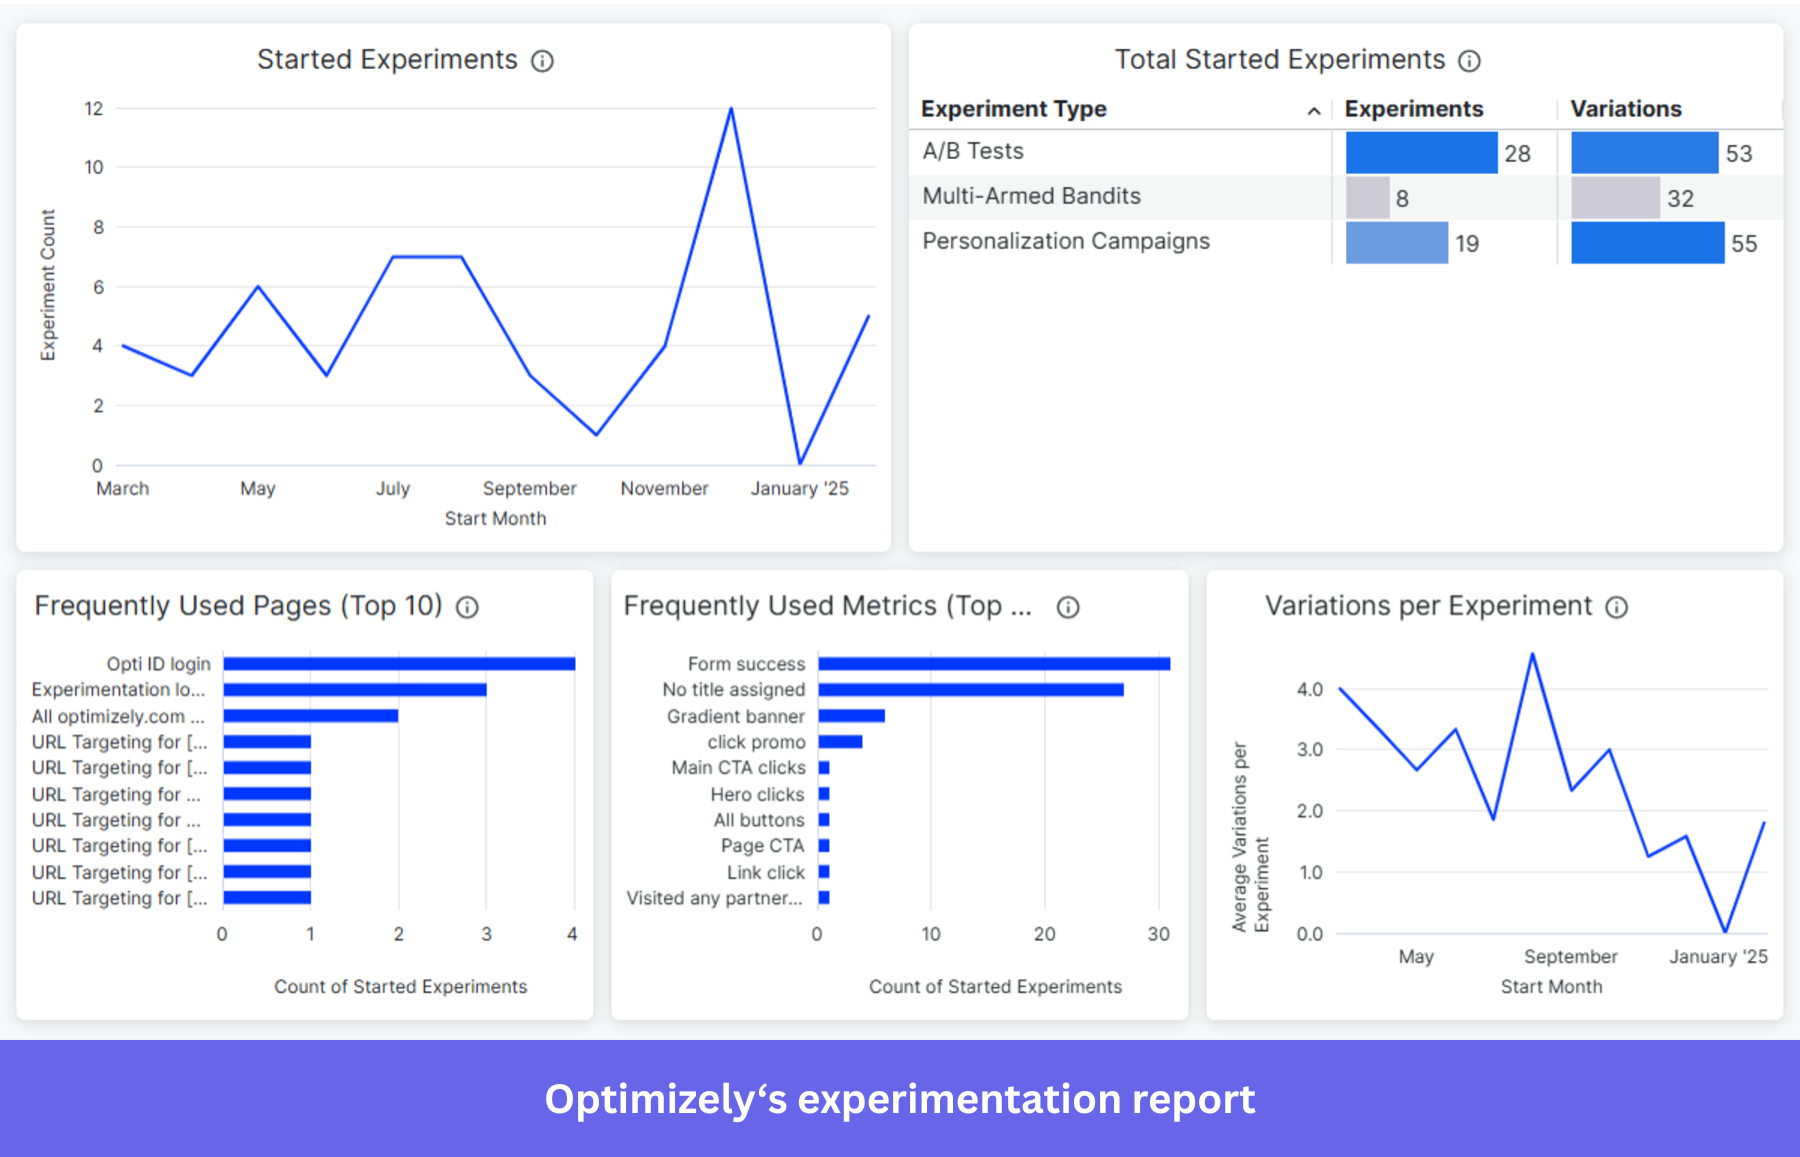
#11 Optimizely for enterprise-grade feature experimentation
💰 Pricing: Optimizely offers custom pricing based on needs. Vendr reports that companies typically pay $31,500 – $201,077 per year.
🌟 G2 rating: 4.3/5 based on 100+ reviews.
Optimizely is built for enterprise teams where even small gains in conversion can translate into significant revenue impact. Unlike basic A/B testing tools, it’s designed to support high-velocity experimentation across complex, multi-platform environments with minimal performance impact.
That level of capability comes with a high barrier to entry. Between the enterprise-level pricing and the technical setup required, it’s rarely the right fit for early-stage teams.
Main features:
- Full-stack experimentation: Run A/B tests across both frontend and backend, from UI changes to core product logic and algorithms.
“Optimizely is a very powerful A/B testing platform, and their libraries are easy to integrate into our web servers.” — User review on G2.
- Feature flagging: Release features gradually and control rollout without new deployments or app store resubmissions.
- Multi-armed bandits: Automatically shift traffic toward higher-performing variants during experiments to maximize outcomes in real time.
- Advanced targeting and segmentation: Deliver personalized experiences based on user attributes like location, device, or past behavior.
“The only thing I didn’t like was the implementation, it’s true that the team was helping us a lot, but it took us a long time to implement it, first of all to understand the implementation and above all to be able to segment perfectly.” — Giovanni on G2.
Unlock actionable insights with Userpilot’s app analytics tools!
There’s no single “best” mobile analytics tool for every team. What works for one might be overkill or not enough for another. The key is knowing which metrics matter, who needs the data, and how quickly you need to act on it.
If you’re looking for a solution that brings mobile and web analytics together with in-app engagement, it’s worth exploring what we’ve built. Book a Userpilot demo to see it in action!
FAQ
What is app analytics?
App analytics refers to the collection, measurement, and analysis of user data within a mobile application. It helps product and growth teams understand how users engage with the app, which features drive value, and where friction exists. These insights support better decision-making around app development, UX, and user retention.
Which tool is often used for in-app analytics?
Common app analytics solutions include Userpilot, Mixpanel, and Amplitude. They allow you to track user actions, analyze journeys, and measure engagement. The best app analytics tool depends on your app’s goals, team size, and whether you need mobile-only insights or cross-platform coverage.
How to measure app analytics?
Use your mobile app analytics software to set up event tracking for key user actions, such as sign-ups, clicks, and feature usage. Then use reports like funnels, retention analysis, and user paths to interpret the analytics data. This helps you identify what’s working and where users are dropping off.
About the author