![NPS Analysis: How To Collect Data and Conduct an Analysis [Best Tools Included] cover](https://blog-static.userpilot.com/blog/wp-content/uploads/2022/06/NPS-Analysis-How-To-Collect-Data-and-Conduct-an-Analysis_fe9aac858f560bc06d19d4bf5bb22d57_2000-450x295.png)
NPS Analysis: How To Collect Data and Conduct an Analysis [Best Tools Included]
How can NPS analysis help you achieve customer success?
The Net Promoter Score (NPS) is a measure of user sentiment and loyalty. It tells you how likely users are to recommend your product to others. Thus, analyzing the NPS data would help you understand how engaging and profitable your product is.
So without further ado, let’s see how you can make the best use of NPS feedback.
Try Userpilot Now
See Why 1,000+ Teams Choose Userpilot

What is an NPS analysis?
The Net Promoter Score analysis is the process of looking at customers’ NPS scores, dividing them into promoters, passives, and detractors, and finding ways to improve customer loyalty.
Why is conducting an NPS analysis important?
55% of businesses in the world use NPS to measure customer satisfaction and loyalty. But do they all use it for analysis?
NPS analysis gives you valuable insights to incorporate into your customer satisfaction and success strategies.
First of all, it gives you an overview of how your business is performing. Low average NPS scores suggest that most customers are at risk of churning, which puts your future revenue streams in jeopardy.
Moreover, you can identify friction points that help you make informed improvements in product design and onboarding experiences. This boosts engagement and reduces churn.
Not to mention that it helps you understand your customers on a deeper level. You get to know how they actually feel about your product. Once you do that, you can come up with better tactics to drive more value and secure their loyalty.
How does the Net Promoter Score (NPS) work?
NPS surveys simply ask users to score how likely they are to recommend your product to friends/colleagues, on a scale of 1-10. This is what an NPS survey normally looks like:
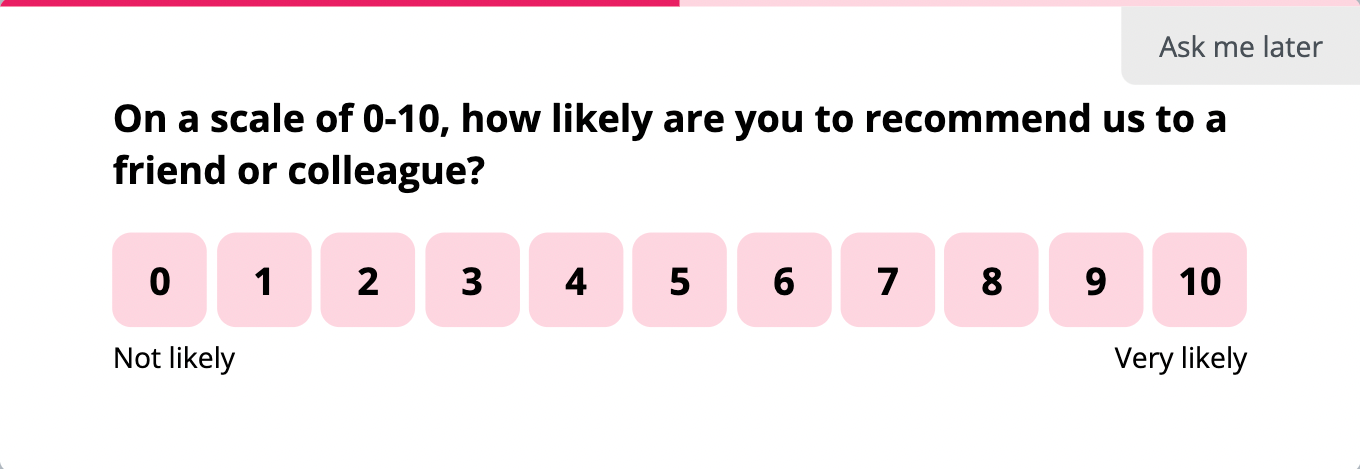
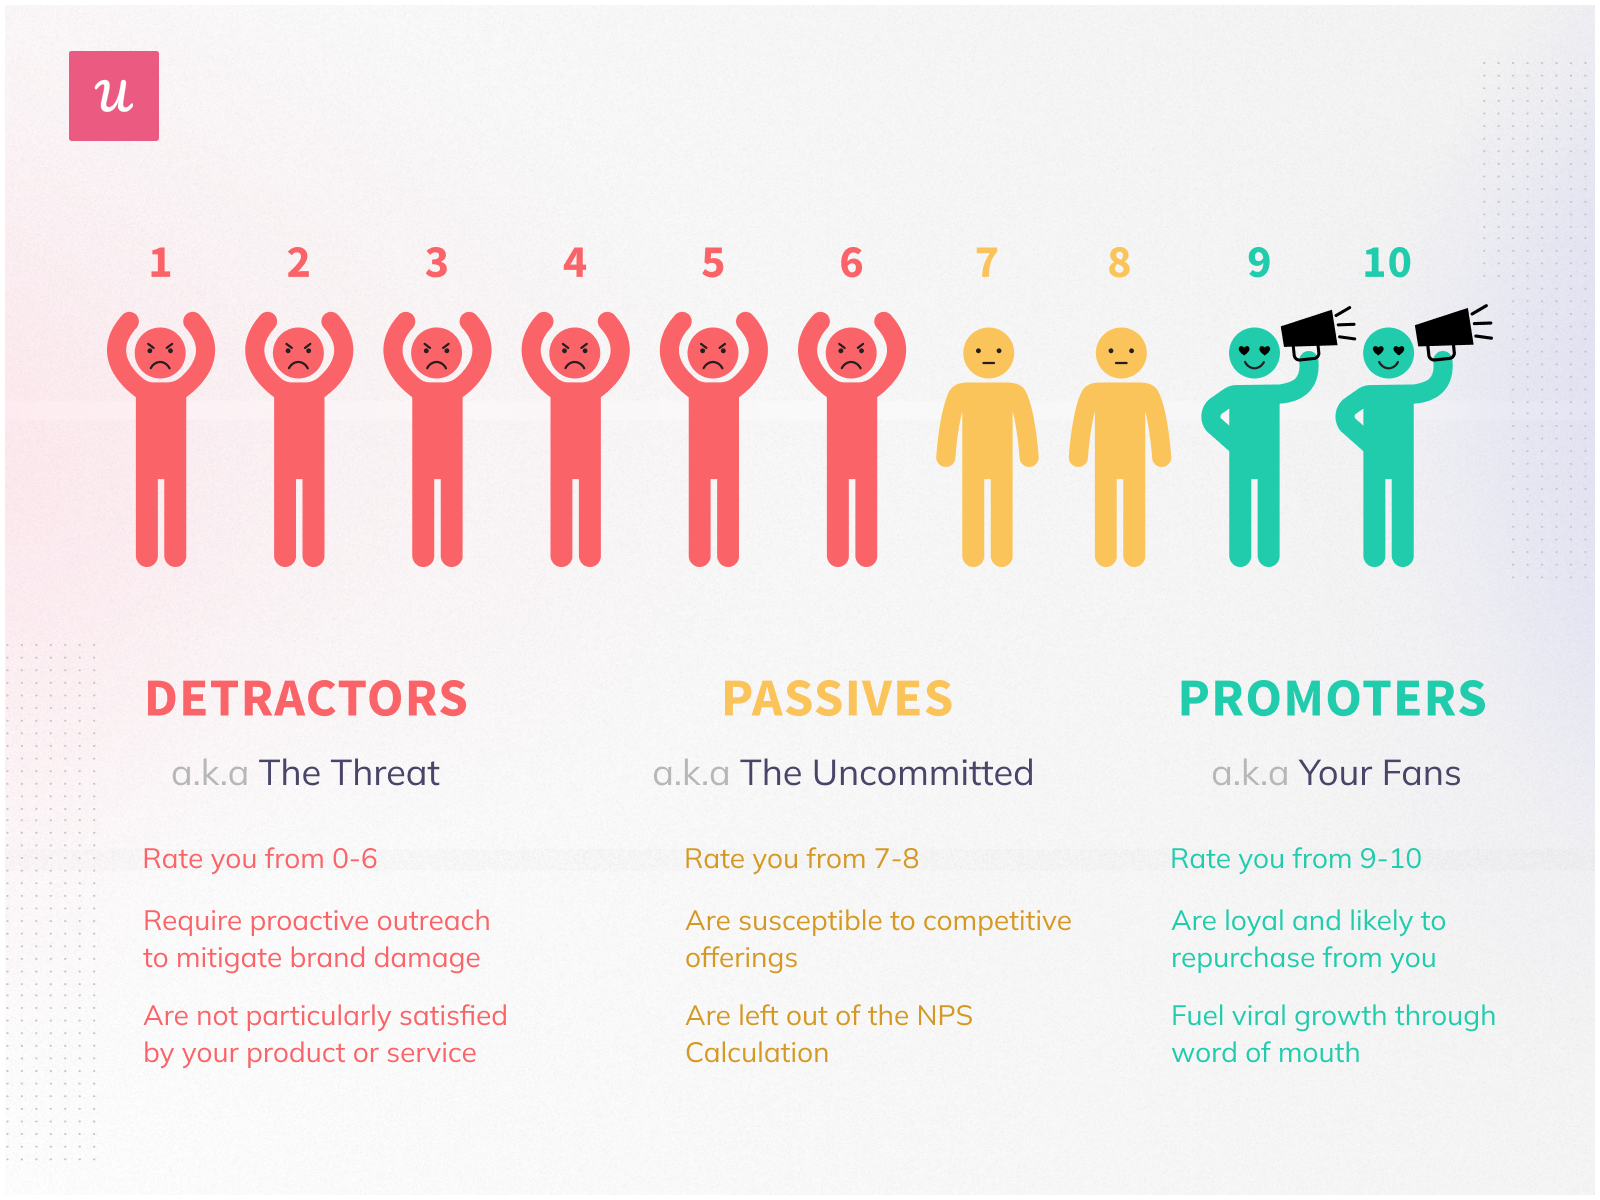
Based on the responses, the users are divided into 3 groups:
- Promoters
- Passives
- Detractors
Promoters
Promoters are customers who give you a score of 9 or 10 on the NPS survey. They are the users who are happy with your product because they get continuous value from it. They are your loyal customers whom you are most likely to retain over the long run.
They might even become your power users, who not only engage with your product the most but also are active brand advocates. Thus, they can bring about more growth in revenue by drawing in more users.
Passives
Passives are NPS respondents who give you a score of 7 or 8. Although they are generally satisfied with your product, they don’t find it particularly engaging. That’s why they are indifferent to your product and would switch to being either detractors or promoters, depending on future experiences. This gives you the opportunity to help them get the full value of your product and convert them to promoters.
Detractors
Detractors are unhappy customers who give you a score of 6 or below. They are not seeing the value in your product or are facing issues that are going unresolved. This makes them disengaged and dissatisfied. Such customers are more likely to churn and leave behind negative feedback and reviews.
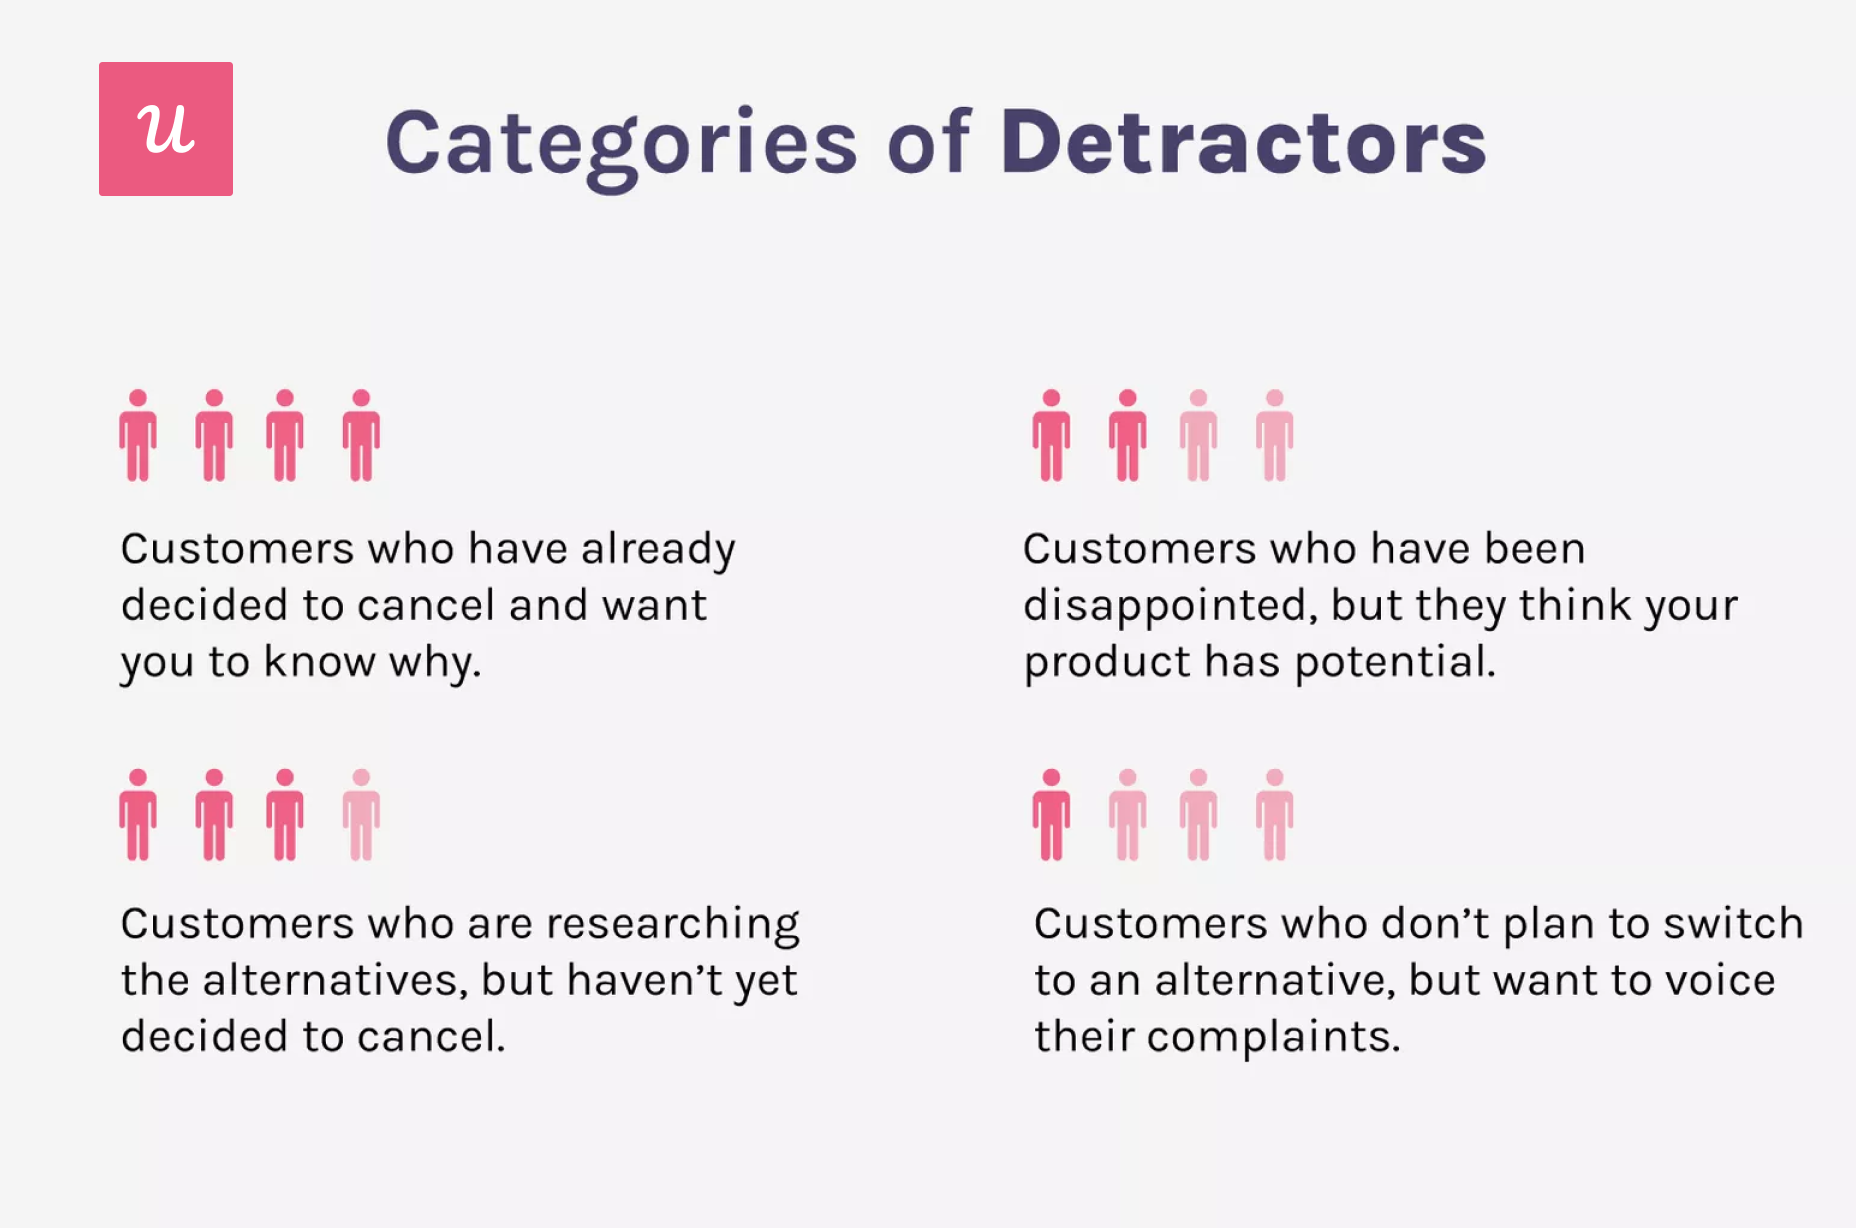
However, you can prevent churn by addressing common customer pain points/problems and may even turn them into promoters down the road. To successfully achieve the latter, you need to properly determine the categories of detractors to inform your corrective efforts.
How to measure net promoter score?
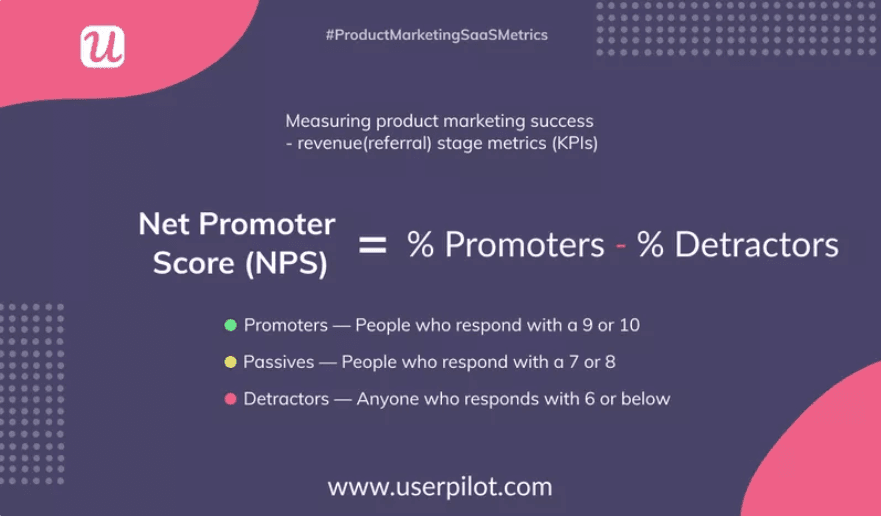
The NPS metric is equal to the difference between the percentage of promoters and detractors.
Suppose, your NPS survey results are as follows:
- Promoters: 55%
- Passives: 30%
- Detractors: 15%
This would make your overall NPS score: 55%-15% = 40.
NPS data benchmarks in SaaS
The NPS scores can range between -100 and 100. They become negative only if you have a greater percentage of detractors than promoters.
The right NPS scores vary among industries. Below is a list of average NPS benchmarks for different industries. In general, an NPS between 0 and 30 is considered a good one.
However, the benchmark for the SaaS industry is higher. According to the NICE Satmetrix benchmark, the average NPS for the SaaS industry is 41.
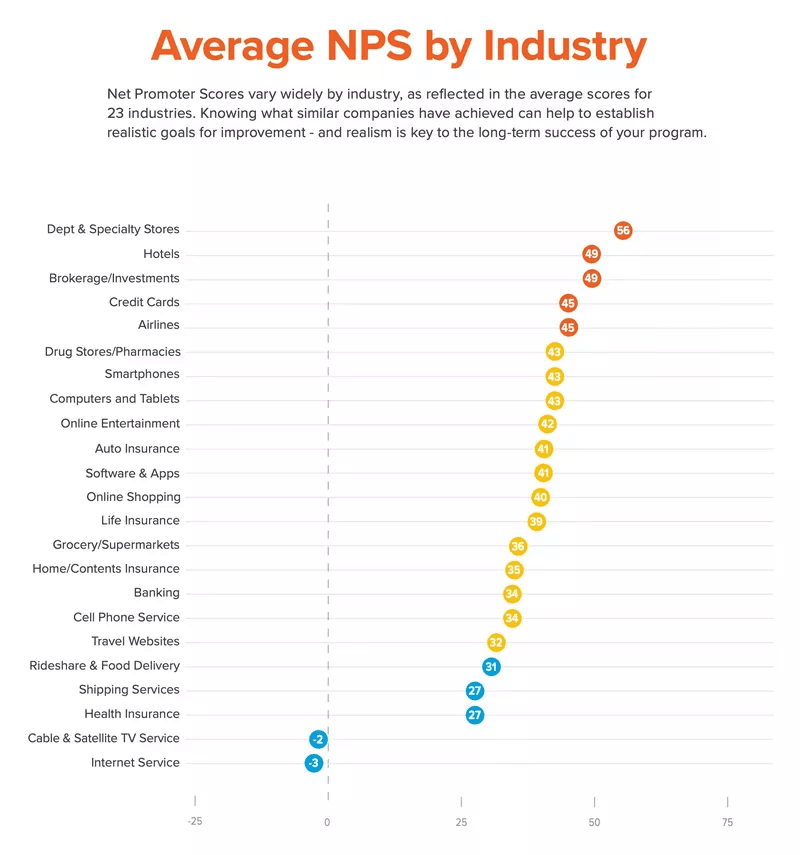
While it’s good to exceed the NPS of your competitors, it’s more crucial to consistently improve upon your past performances. Remember that you are your most vital competitor.
How to collect NPS survey data and conduct an NPS data analysis?
It’s not enough to just prepare a survey and send it out to customers. You need to use some tactics to capture the level of customer satisfaction most effectively.
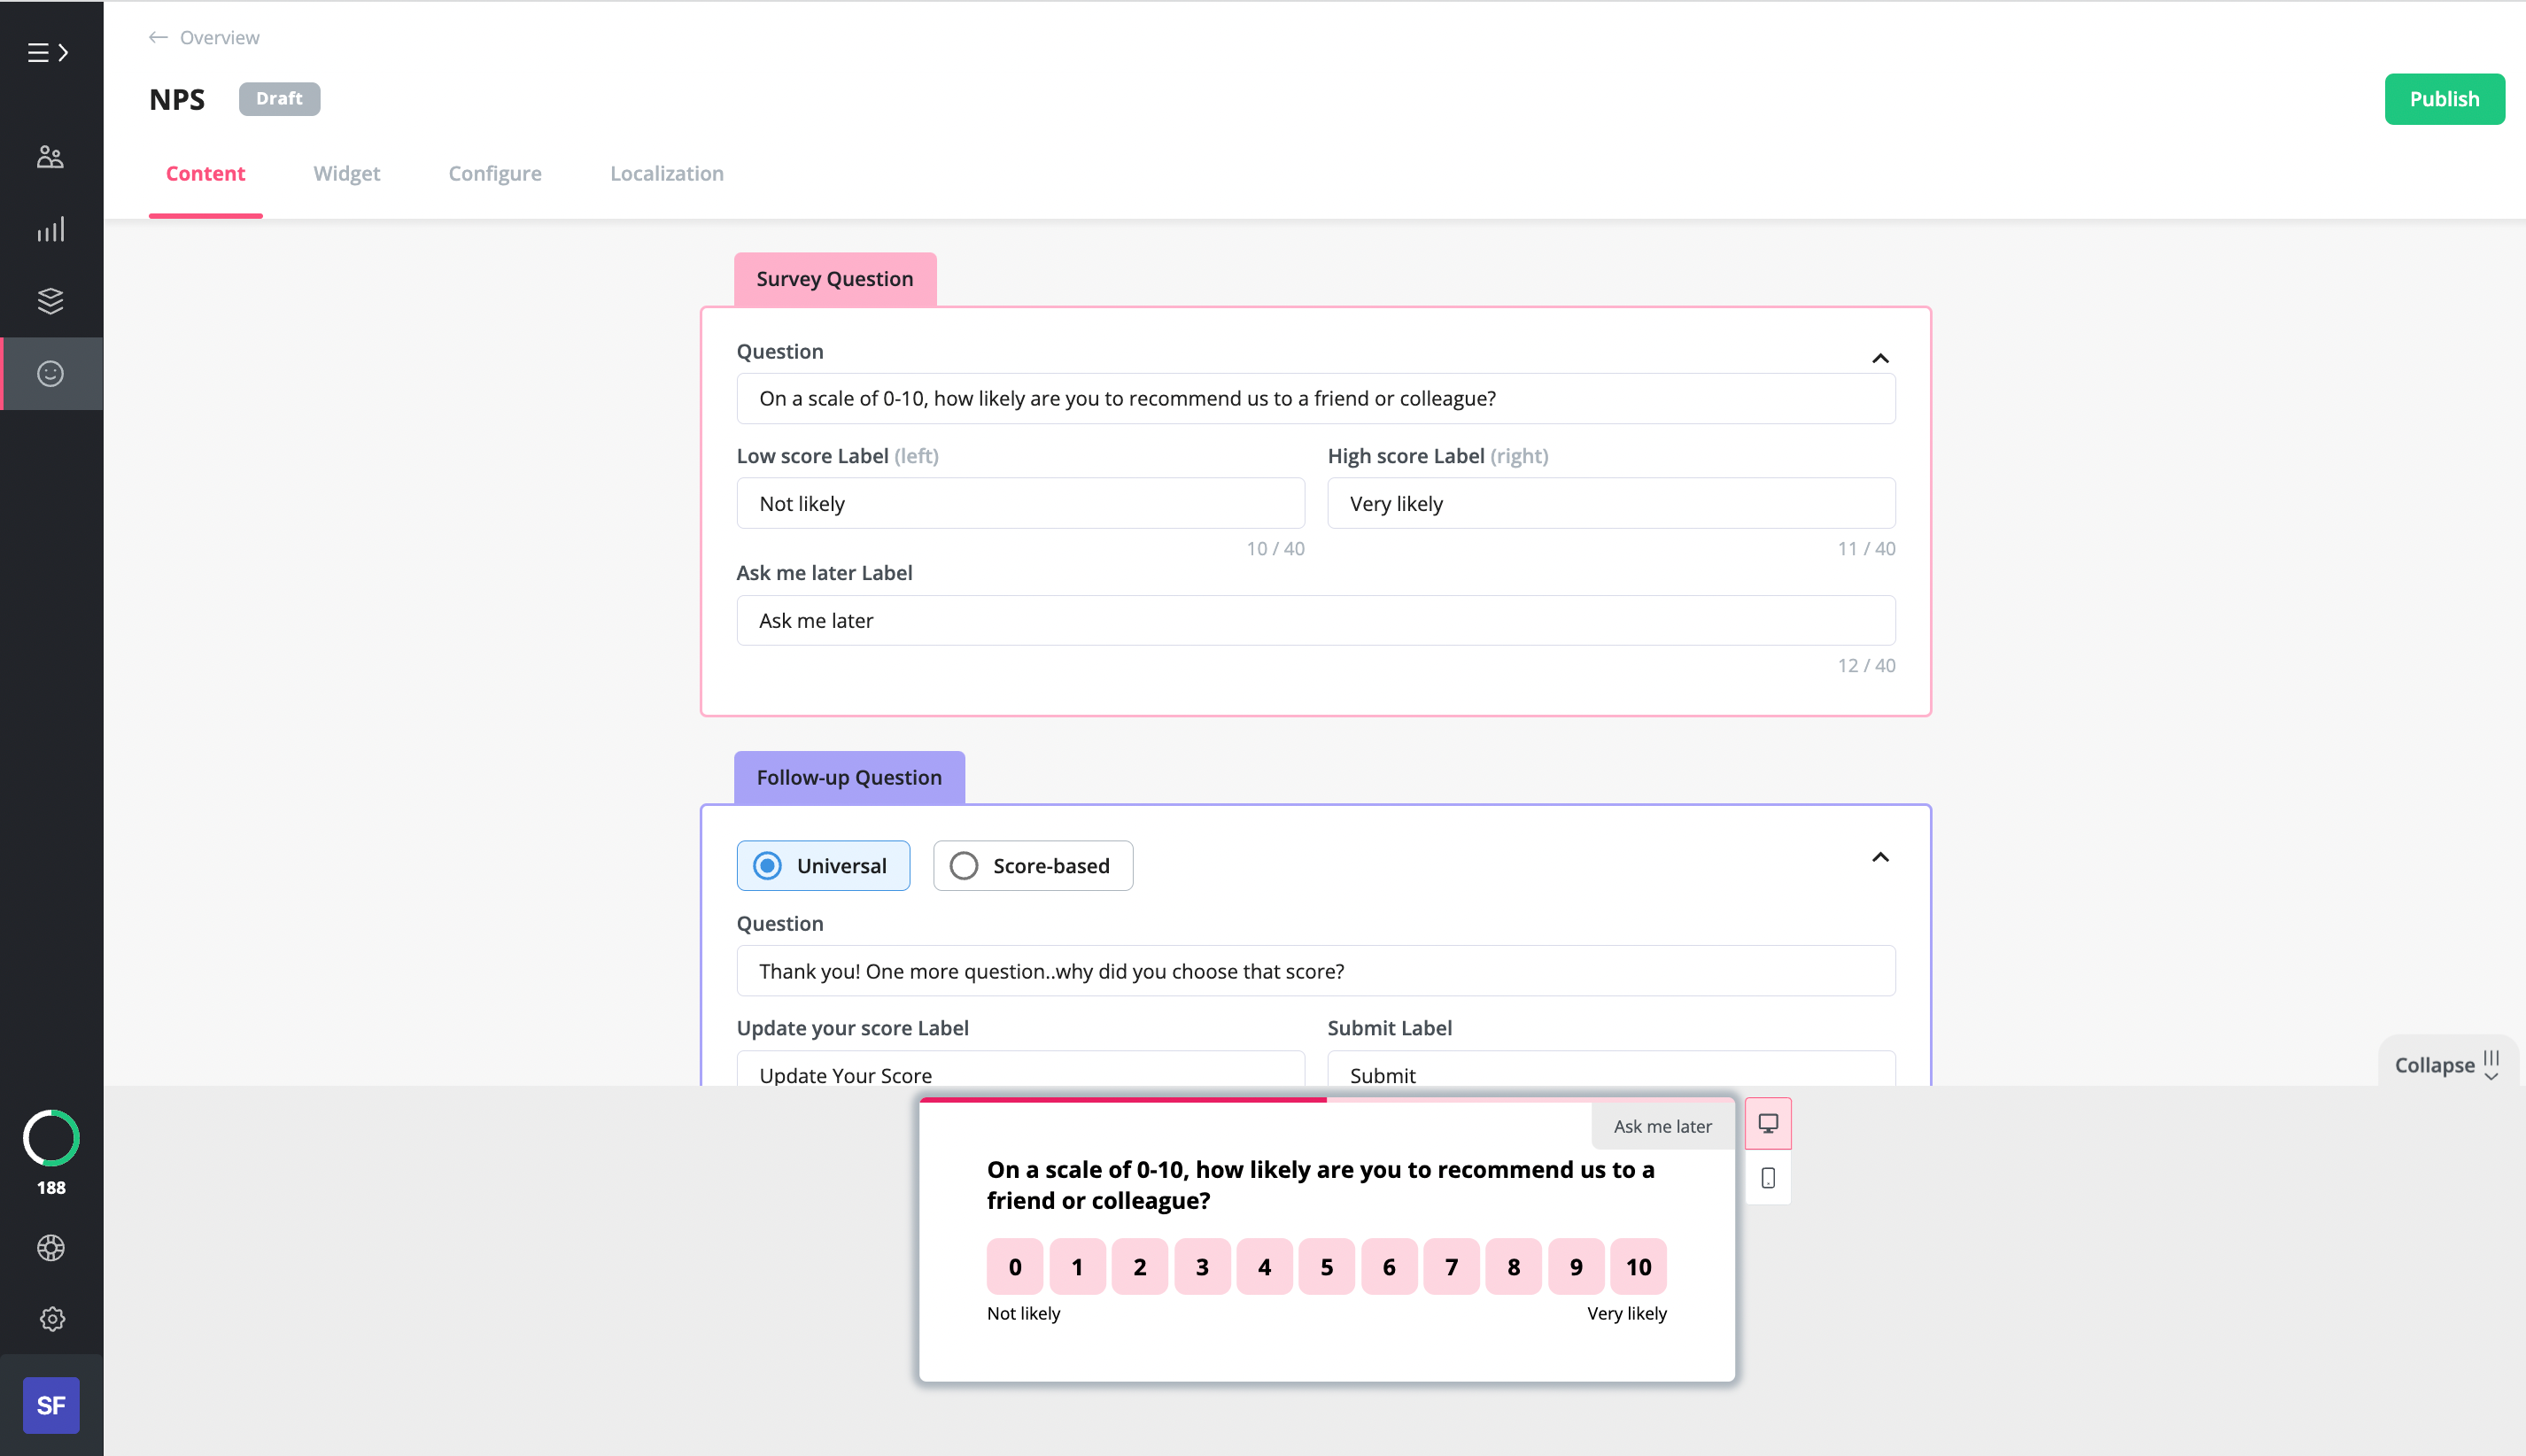
Step 1: Create an NPS survey and a follow-up question
Firstly, you need to create an NPS survey, which can be done through any no-code software. Your choice of software will depend on the way you plan to share the survey with your target audience. If it’s via email, then Typeform is a good choice, while for in-app surveys, Userpilot is a good option.
Just write the NPS question, add the Likert scale, design per your branding, and you’re good to go. This question will give you the NPS scores that is the starting point of your analysis.
However, a number will not help you know what exactly dissatisfied your detractors. So you need to add a follow-up question to get some qualitative user feedback.
This will help you understand what customers are looking for in your product and are not receiving it. You can also uncover friction points or learn what existing features customers are missing out on.
The insights from promoters aren’t in vain either. Know what they find the most engaging about your product and capitalize on these strengths to retain them and convert passives into promoters.
Step 2: Trigger NPS surveys at different customer journey stages to understand the customer experience
The customer journey is critical in determining when to send out NPS surveys to users. And the best way to send them out is to set up triggers using specific user behavior, their actions, or in-app experiences.
Use important product milestones to decide when to trigger NPS surveys. Here are some examples.
- After reaching a ‘success’ milestone: You can define ‘success’ in multiple ways depending on the particular use case of your product. For a social media scheduling tool, it could be sending out the first post. In the case of CRM, it could be launching the first email campaign.
- When your users completely adopt your product: This happens when your users activate all the product features. They move on from the free trial and basic plan to the highest-tier subscription and become regular users.
- Unique dates: You can trigger NPS surveys using the amount of time a customer spends on your product. For instance, you can schedule it to be sent out 2 days before a trial run is over or 10 days after a user signs up for a subscription plan.
Step 3: Calculate the NPS score and compare it with industry benchmarks
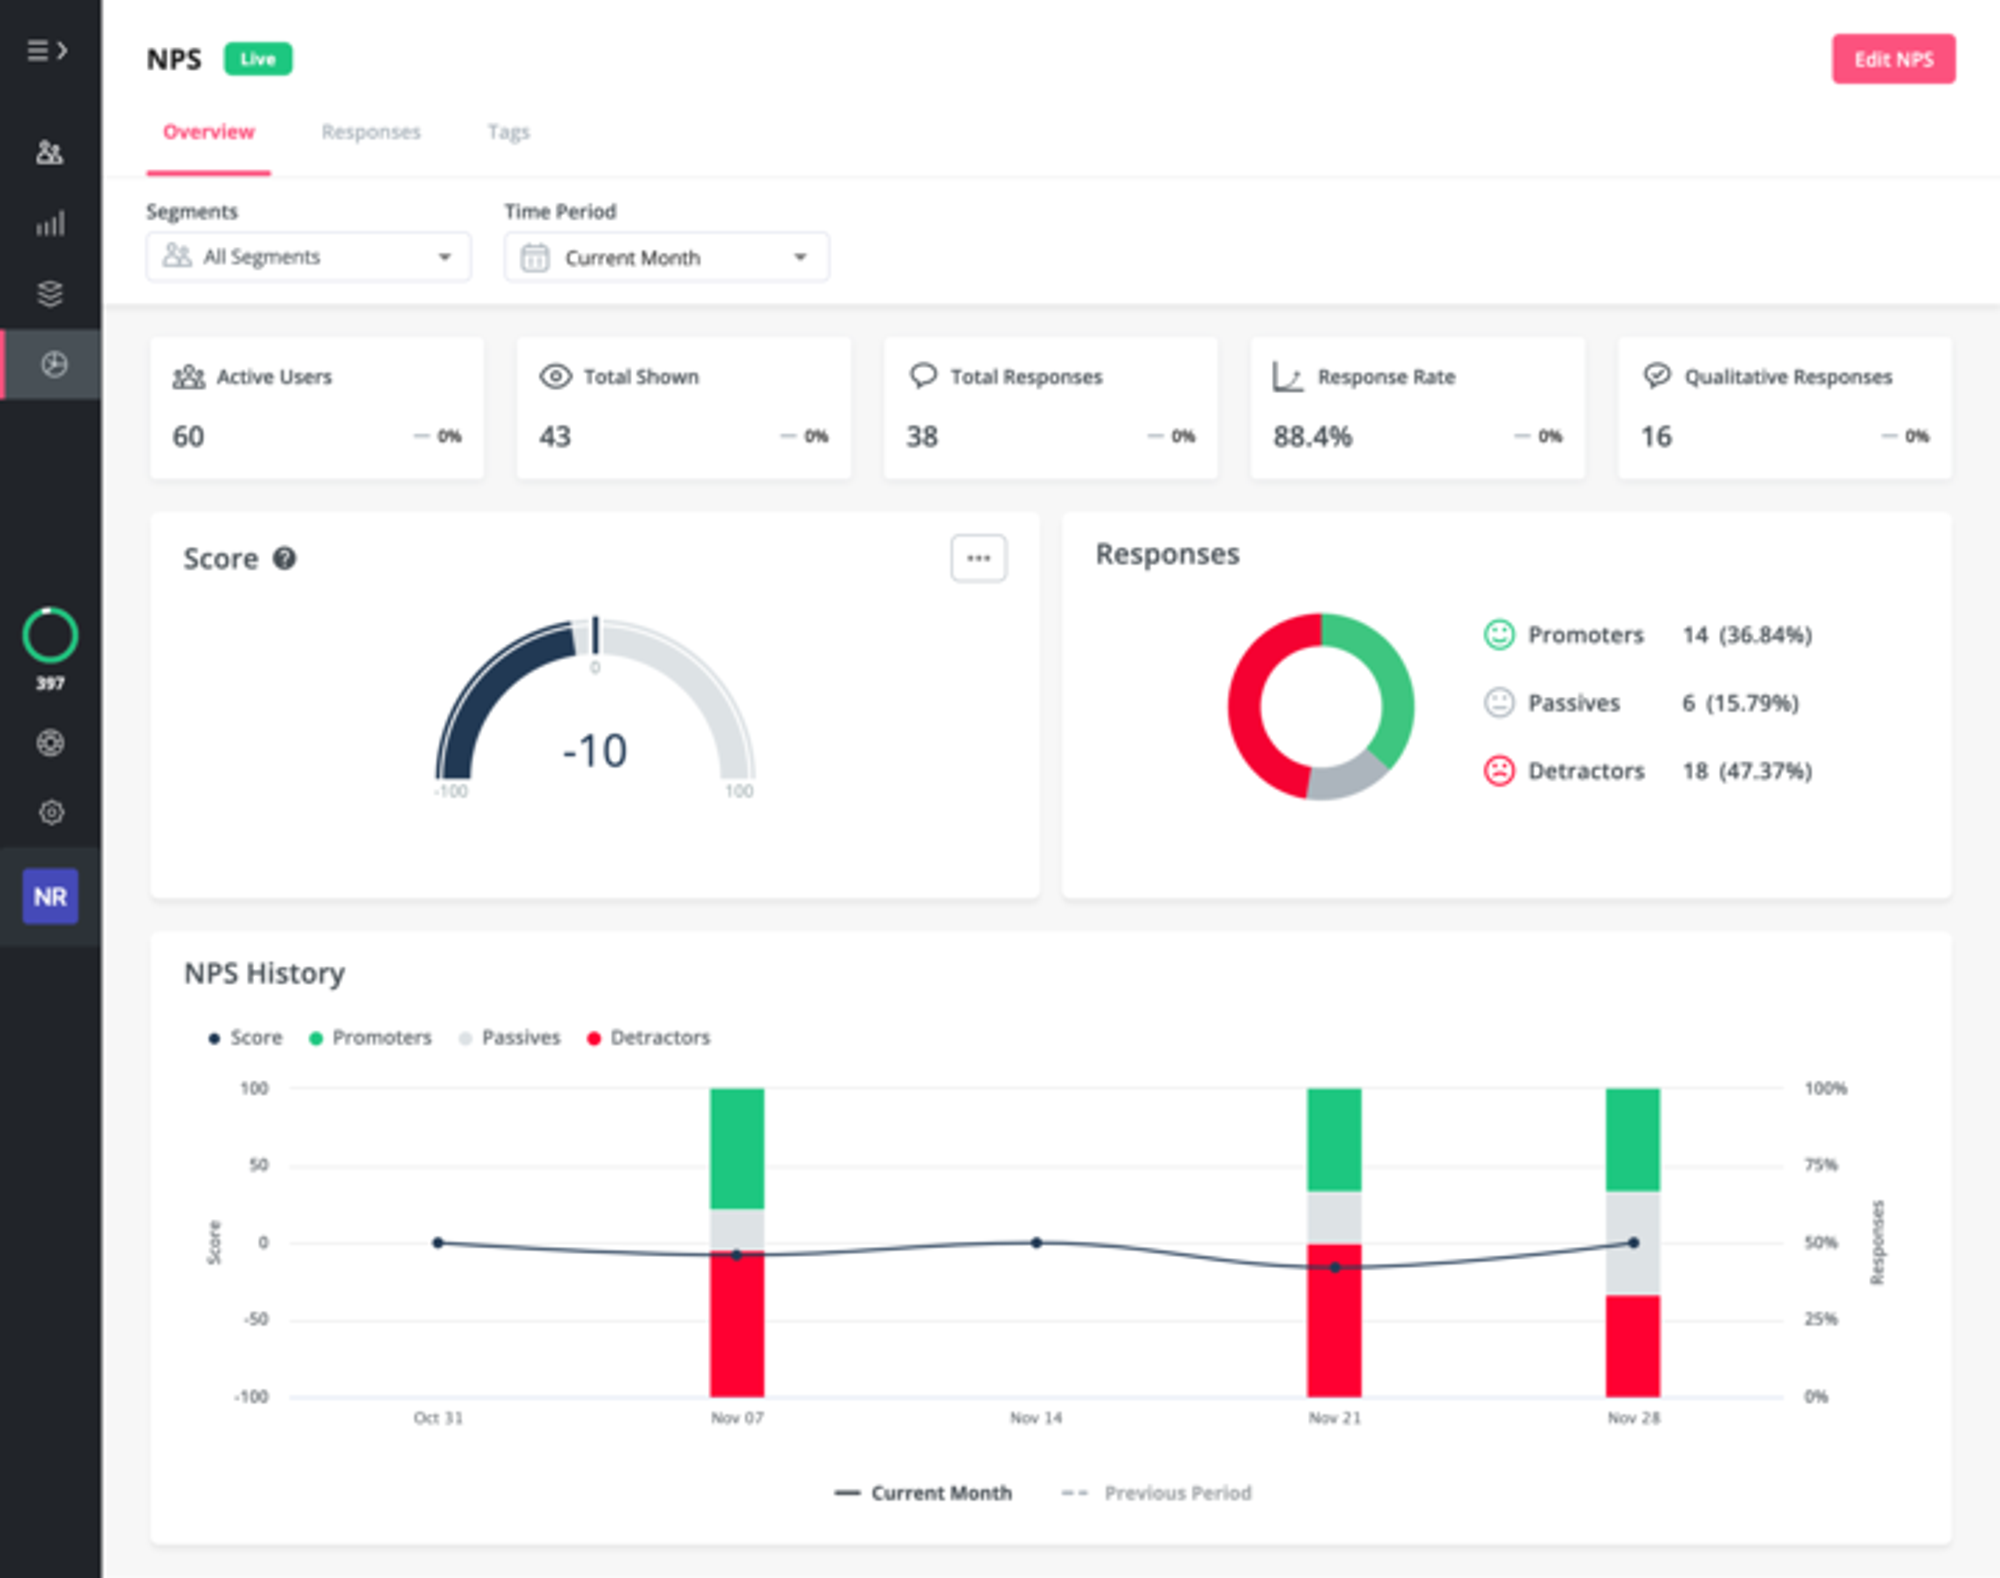
Once you’ve sent out the survey and have received responses, it’s time to calculate the NPS score. You can calculate NPS through the following methods:
- Add all data on a spreadsheet and calculate manually
- Use an online NPS calculator
- Automatically get the figure through your feedback/product growth software
Now you can compare your NPS score against your industry’s standard figure. This helps you to:
- Know how your business is performing relative to its competitors.
- Find gaps in experience that you can mitigate.
- Get an idea of how much effort you need to give to beat your competitors.
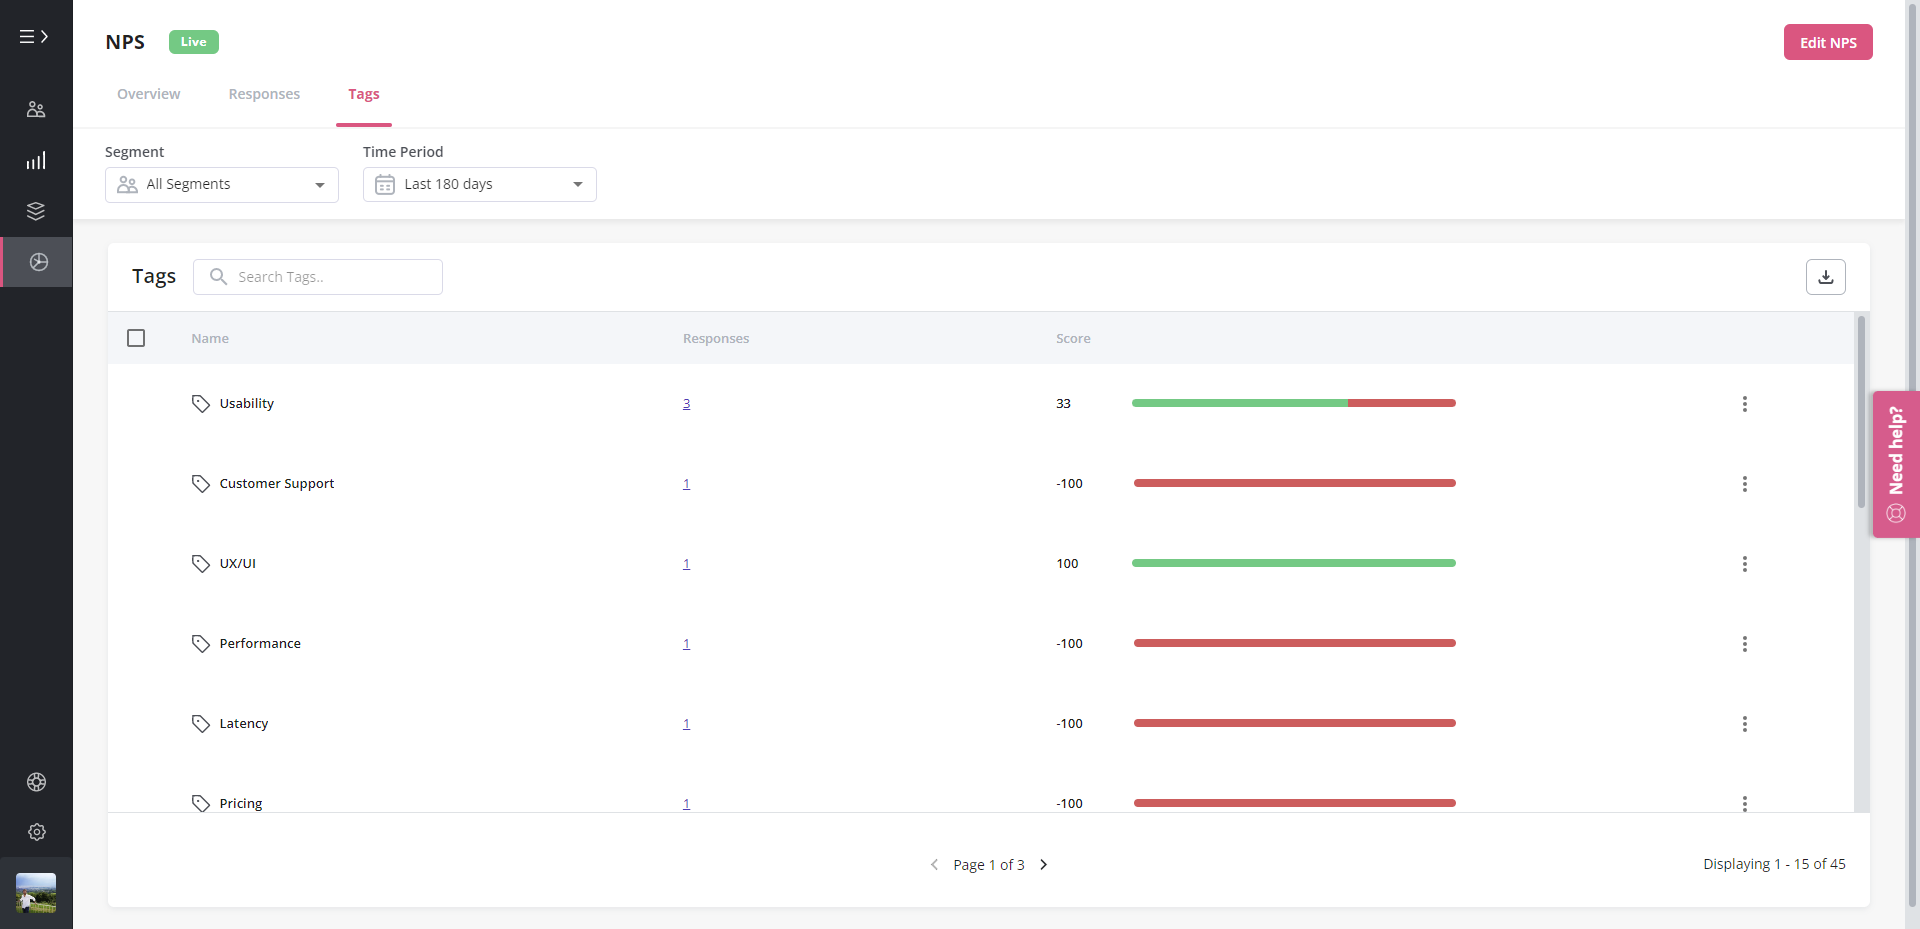
Step 4: Analyze NPS survey results and tag open-ended answers
Follow-up questions lead to open-ended answers, which you need to tag for carrying out the analysis.
A tag is a label you can create and optionally assign to individual responses. This allows you to filter the responses, share them, and perform trend analysis.
Userpilot lets you group the NPS survey responses into separate themes so that you can learn what makes your customers loyal and what does not.
Step 5: Segment NPS responses into groups and identify trends
You can further analyze the open-ended answers by quantifying them. Segmenting the responses lets you quantify the results and give context to the NPS numbers.
For instance, you may find that 90% of the promoters love your product’s usability or that 80% of the detractors have issues with your customer support.
Userpilot not only allows you to create and launch NPS surveys but also segment customers according to their responses. This gives you actionable feedback.
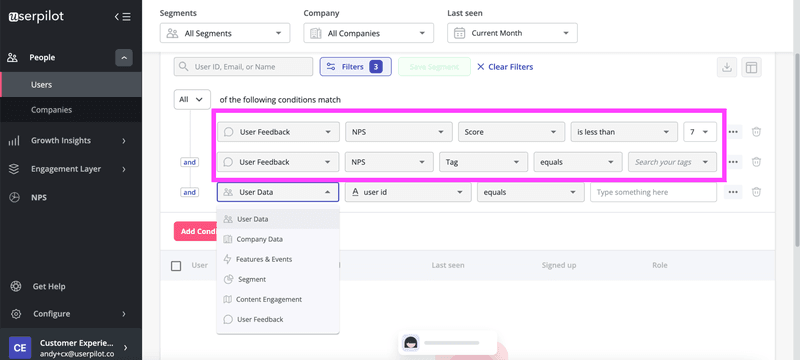
These results make it possible to take data-driven decisions. You can modify your sales and marketing strategies to address all complaints and optimize user experiences.
For example, you can boost your customer referral program by motivating promoters to spread word-of-mouth and give positive reviews.
Furthermore, you can analyze NPS responses for every revenue-based user segment and give special attention to the segment that brings in the highest revenue.
Or, you can assess the subscription plans with the highest scores and include the findings in your cost-benefit analyses on issues such as pricing policies and product upgrades.
You can even segment users according to their lifecycle. It’s particularly useful for long-term customers. They are supposed to show greater loyalty and consequently give higher scores. So you can use their feedback to generate more value and turn them into power users.
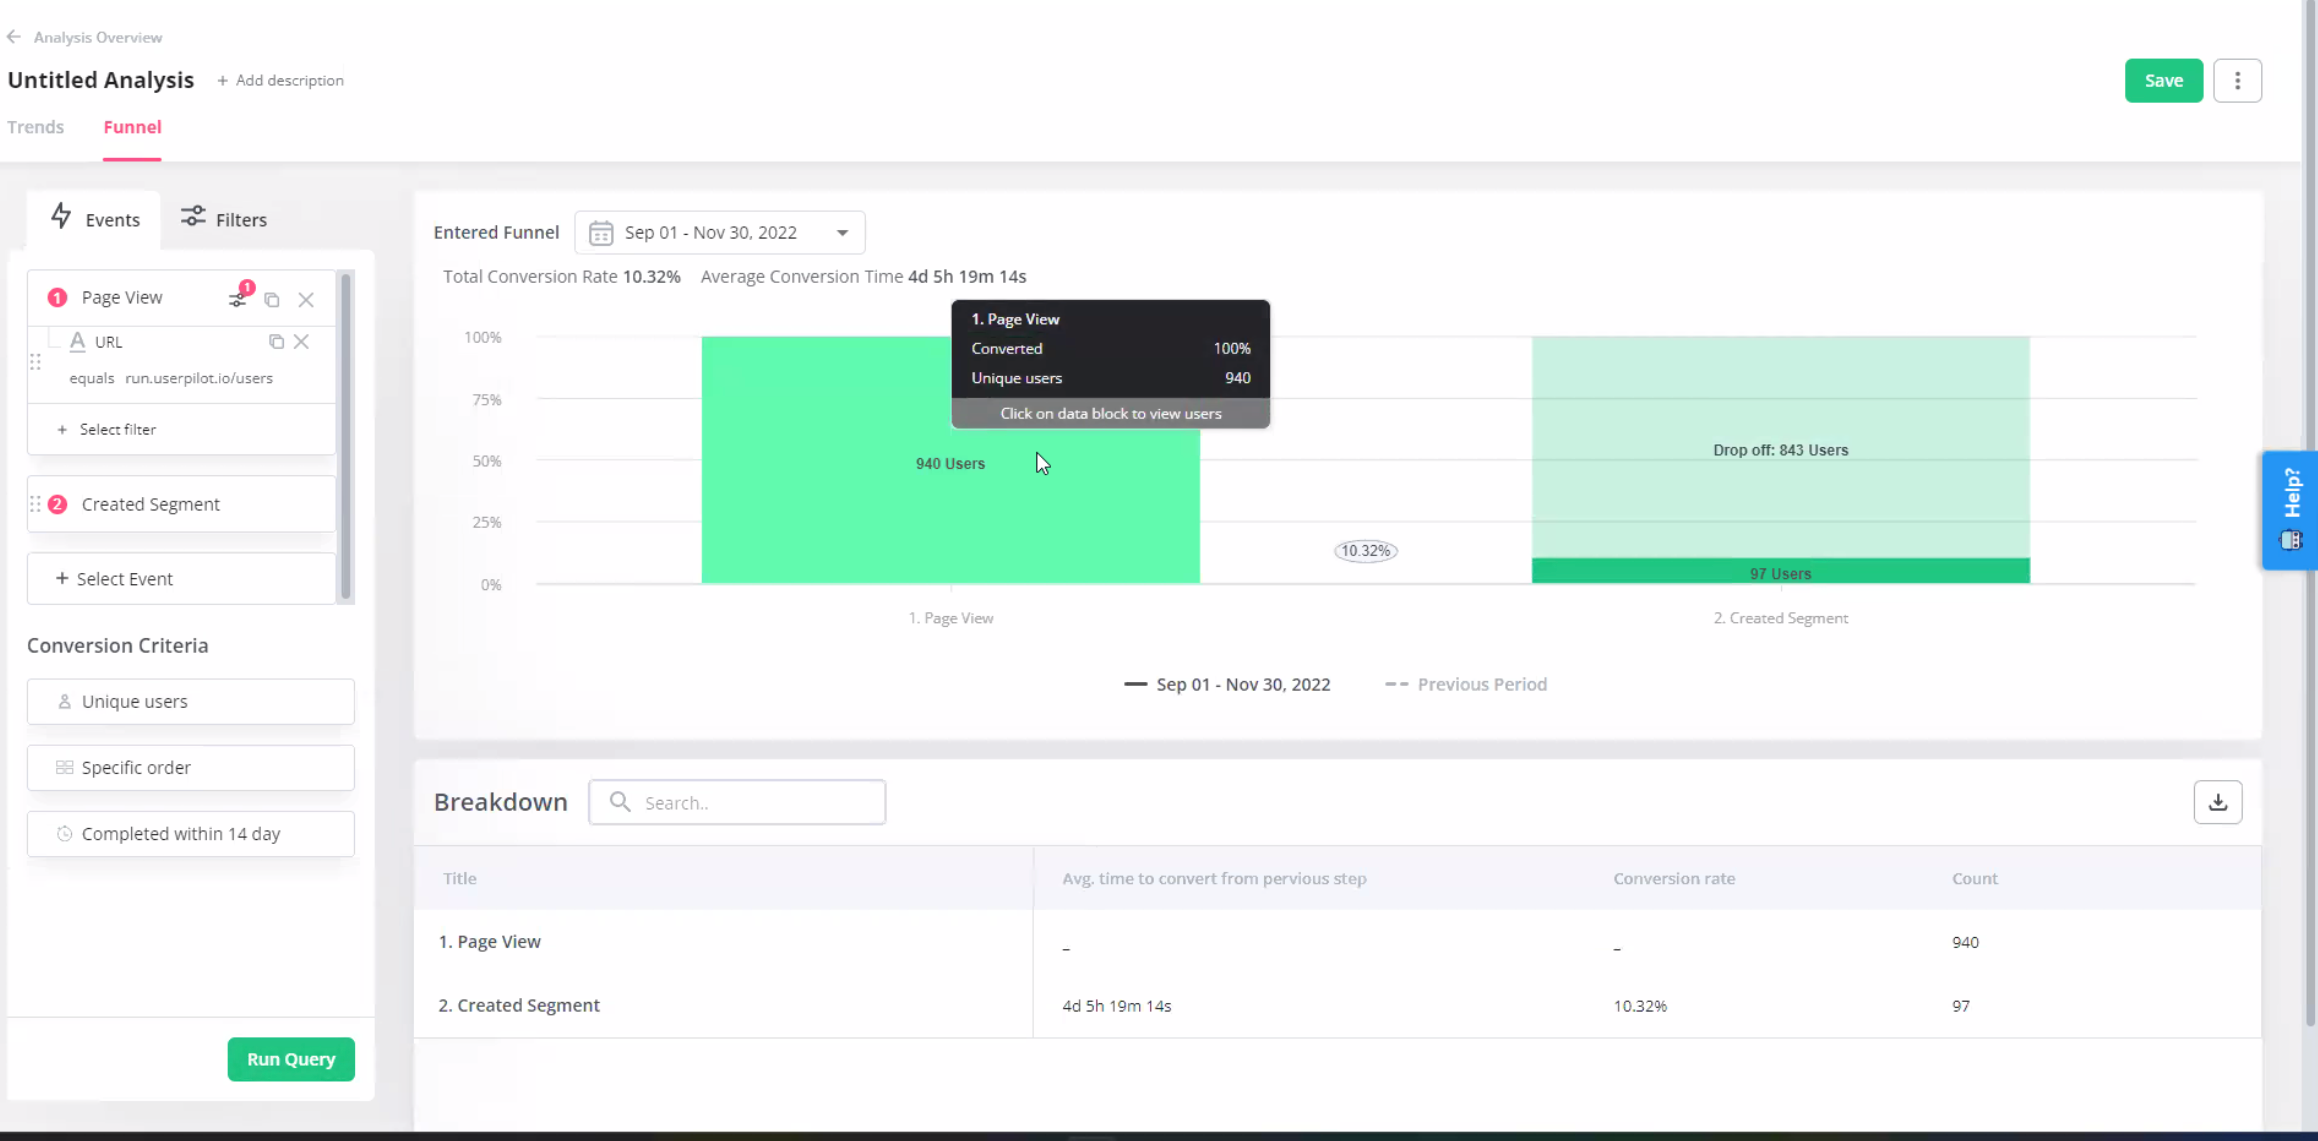
Surely, to determine an accurate analysis, you need to validate your NPS findings with product usage analytics. This will ensure you’re on the right track and give more insights that can be used to optimize the customer experience.
Step 6: Send customer feedback on survey responses and close the loop
What does it mean to close the feedback loop?
You should not leave any customer feedback open. It’s essential to follow up on both positive and negative customer responses.
Closing the loop means implementing an action plan in response to the NPS feedback and letting your customers know.
Get your entire team on board with the NPS program to include them in the feedback process. And always have a plan on how to deal with responses before they arrive. Let’s look at some examples:
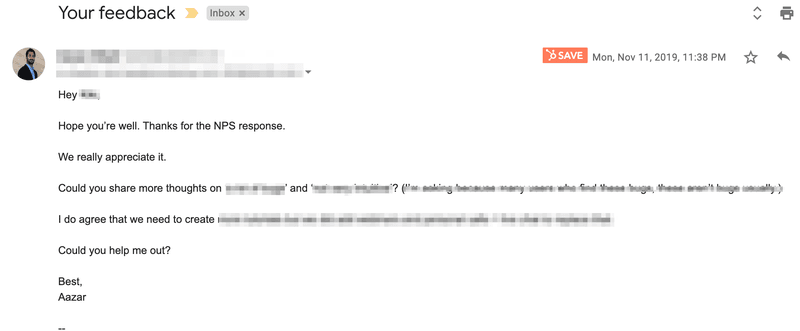
- Scores 0 to 6: The senior manager would call/email the users within 4 hours to apologize and promise to resolve their problem as quickly as possible.
- Scores 7 and 8: Share the customers’ responses with the team members and discussion sessions are held on how to boost customer satisfaction.
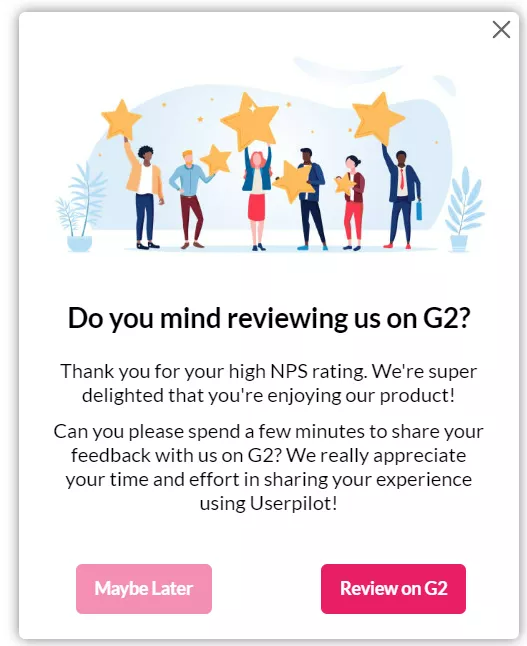
- Scores 9 and 10: Thank the customers, ask them for a review, or offer incentives to the team members responsible for the score. Note down the actions that led to a boost in engagement and replicate them.
NPS analysis best practices for increasing customer satisfaction
Now let’s see two best practices you can use to improve the quality of your NPS survey findings.
Don’t survey your entire customer base all at once
Involving the whole customer base in a single survey will create a bottleneck of data that would be difficult to process and act on.
You can survey all your users but spread the surveys out over a few weeks or months. Or, you can survey each user at a predetermined time from their starting date.
It’s better to concentrate on the customers who have recently interacted with a touchpoint. For instance, they may have logged onto your website in the past week or made a purchase in the past month. There’s a greater chance of getting feedback from such users while their experiences are still fresh in their memories.
Don’t compare data from different geographies
It’s useless to compare scores from different geographical locations.
Several research studies have shown that culture has an impact on NPS results so the scores are bound to vary.
An American organization got to know that the Dutch subsidiary it acquired had a lower NPS score than the parent company. This was not because of any differences in the service quality.
Instead, it found that the NPS score was lower simply because Europeans were more conservative and Americans more extreme with their responses.
We would advise you to take note of the culture in different regions so that you can figure out what matters to different communities of people.
Best NPS tools for collecting and analyzing customer feedback
NPS analysis is incomplete without a perfect tool to serve your purpose. So here are the 3 best NPS software out there.
Userpilot
Userpilot lets you create NPS surveys without any need for coding. It’s a three-step process, whereby you:
- Open the NPS page in the user feedback tab.
- Create a simple survey.
- Customize the survey to suit your visual style and brand guidelines, such as adding your own font and logo.
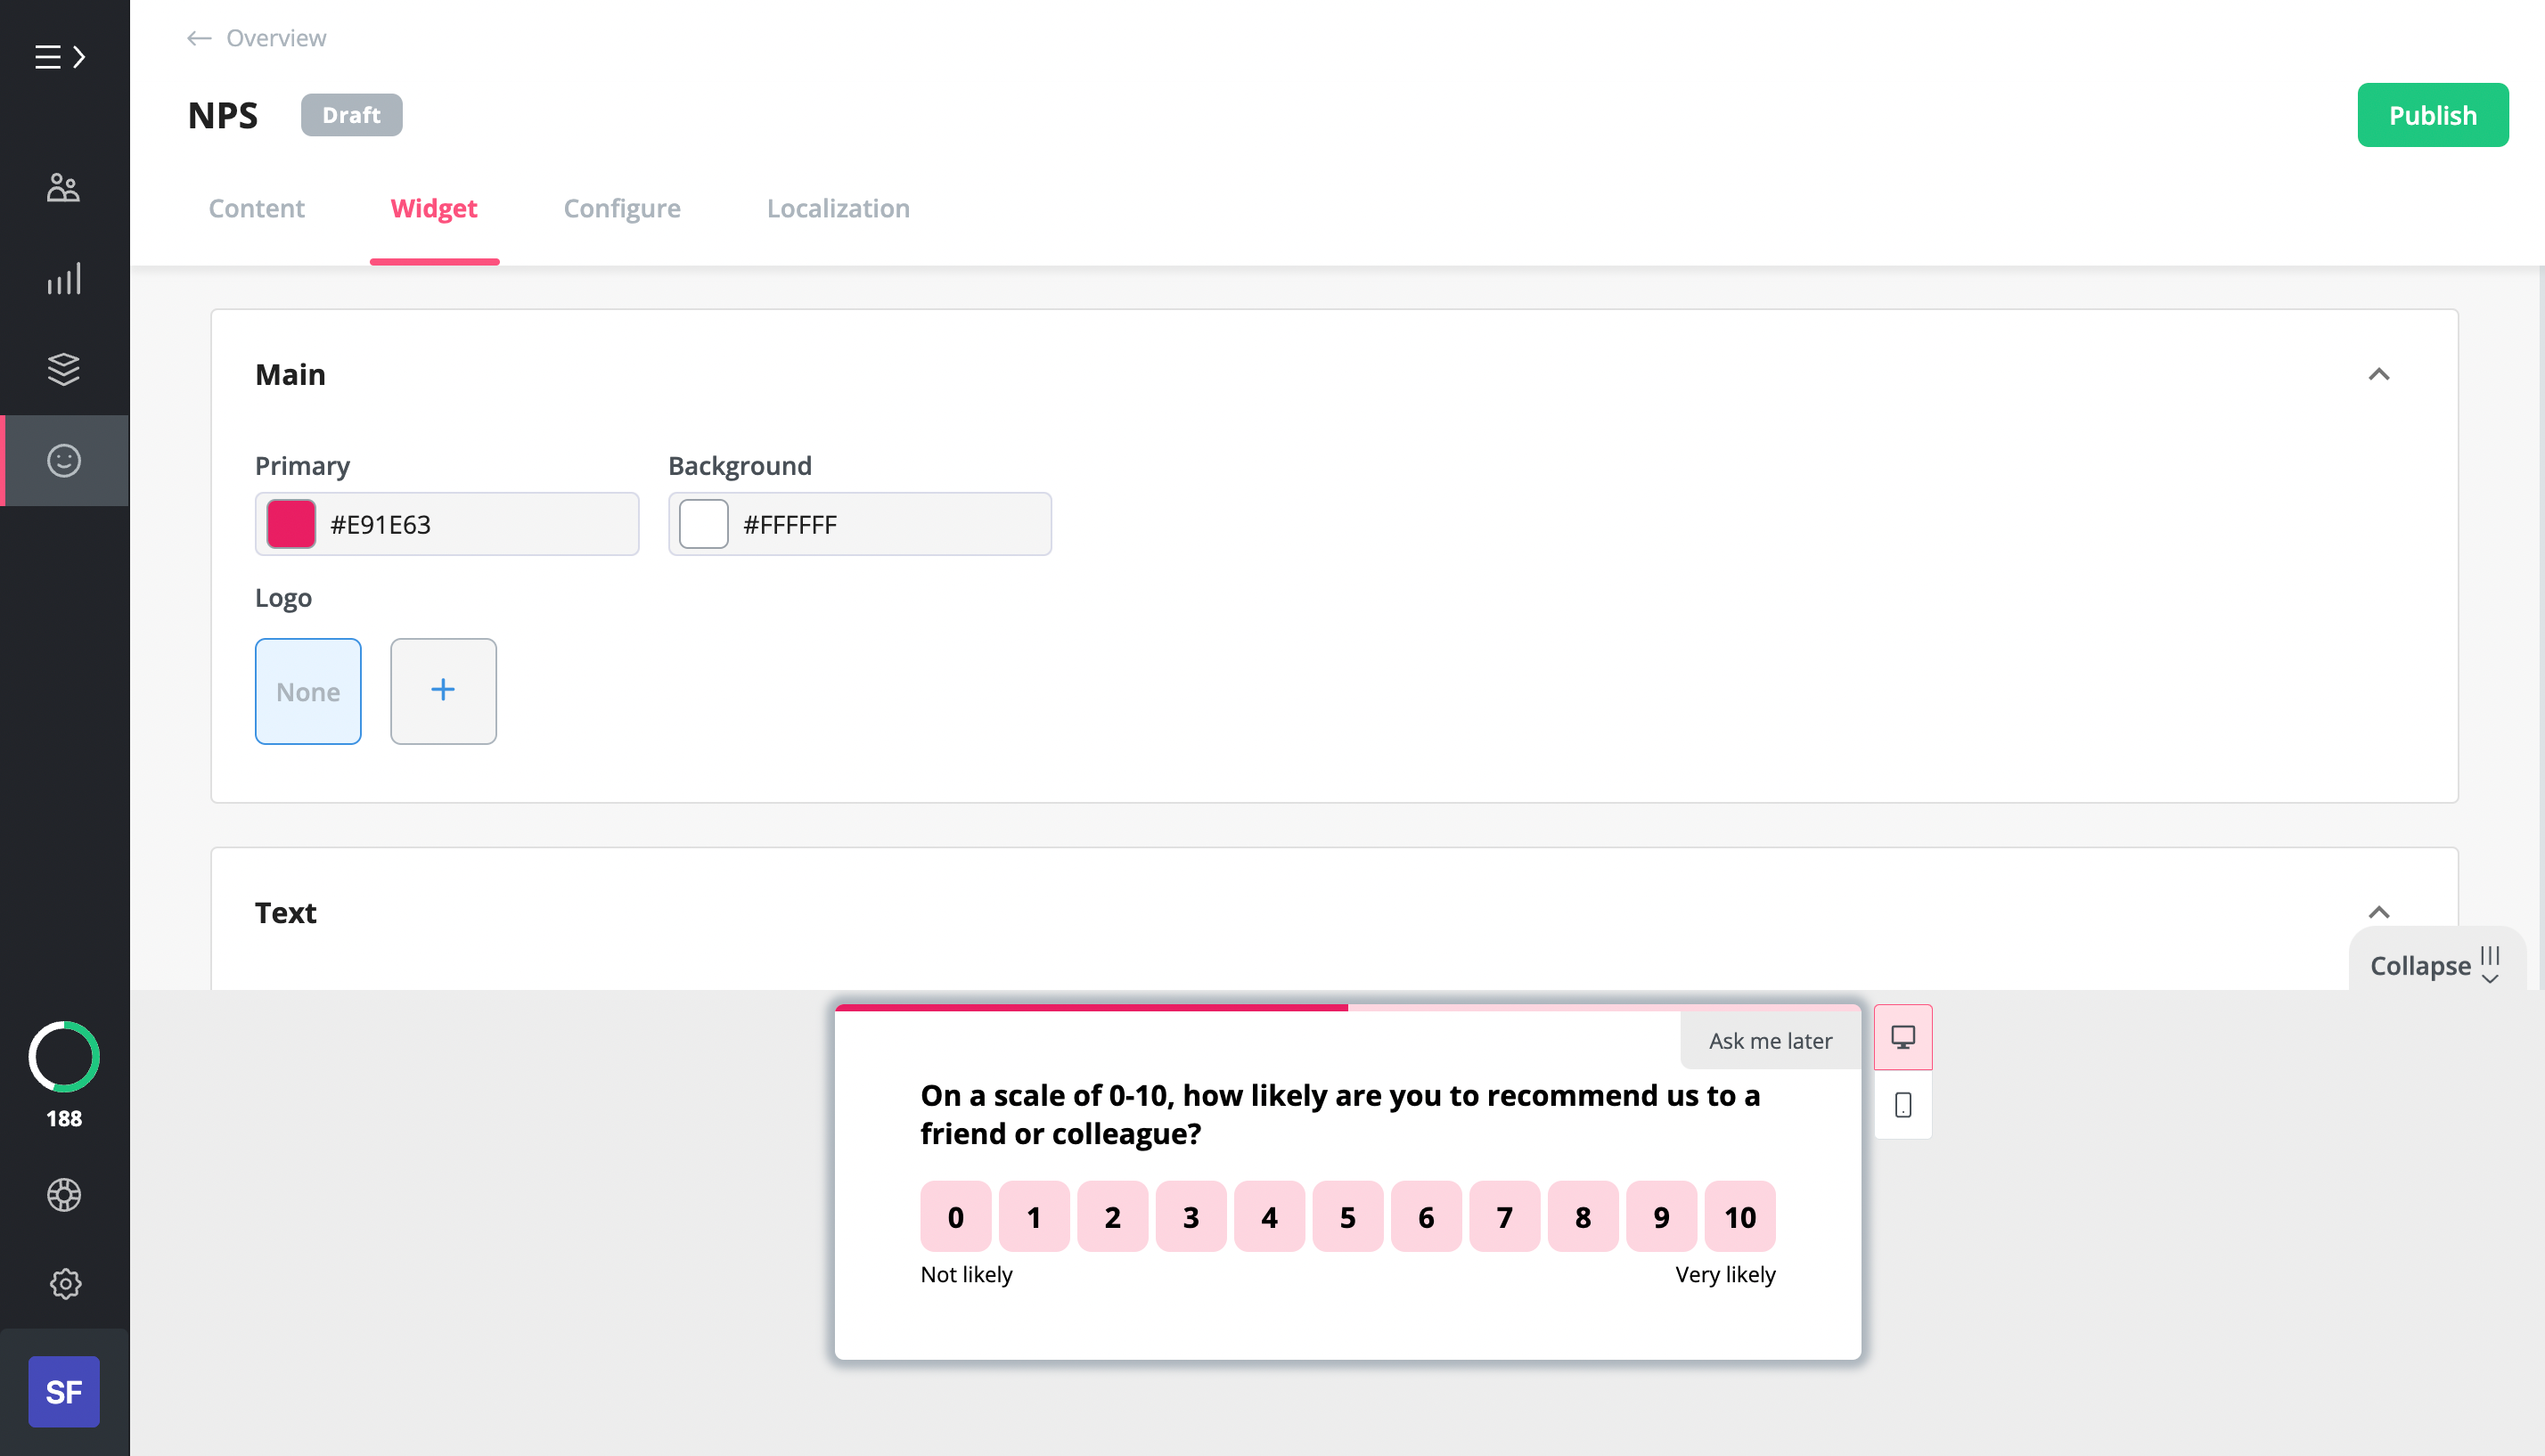
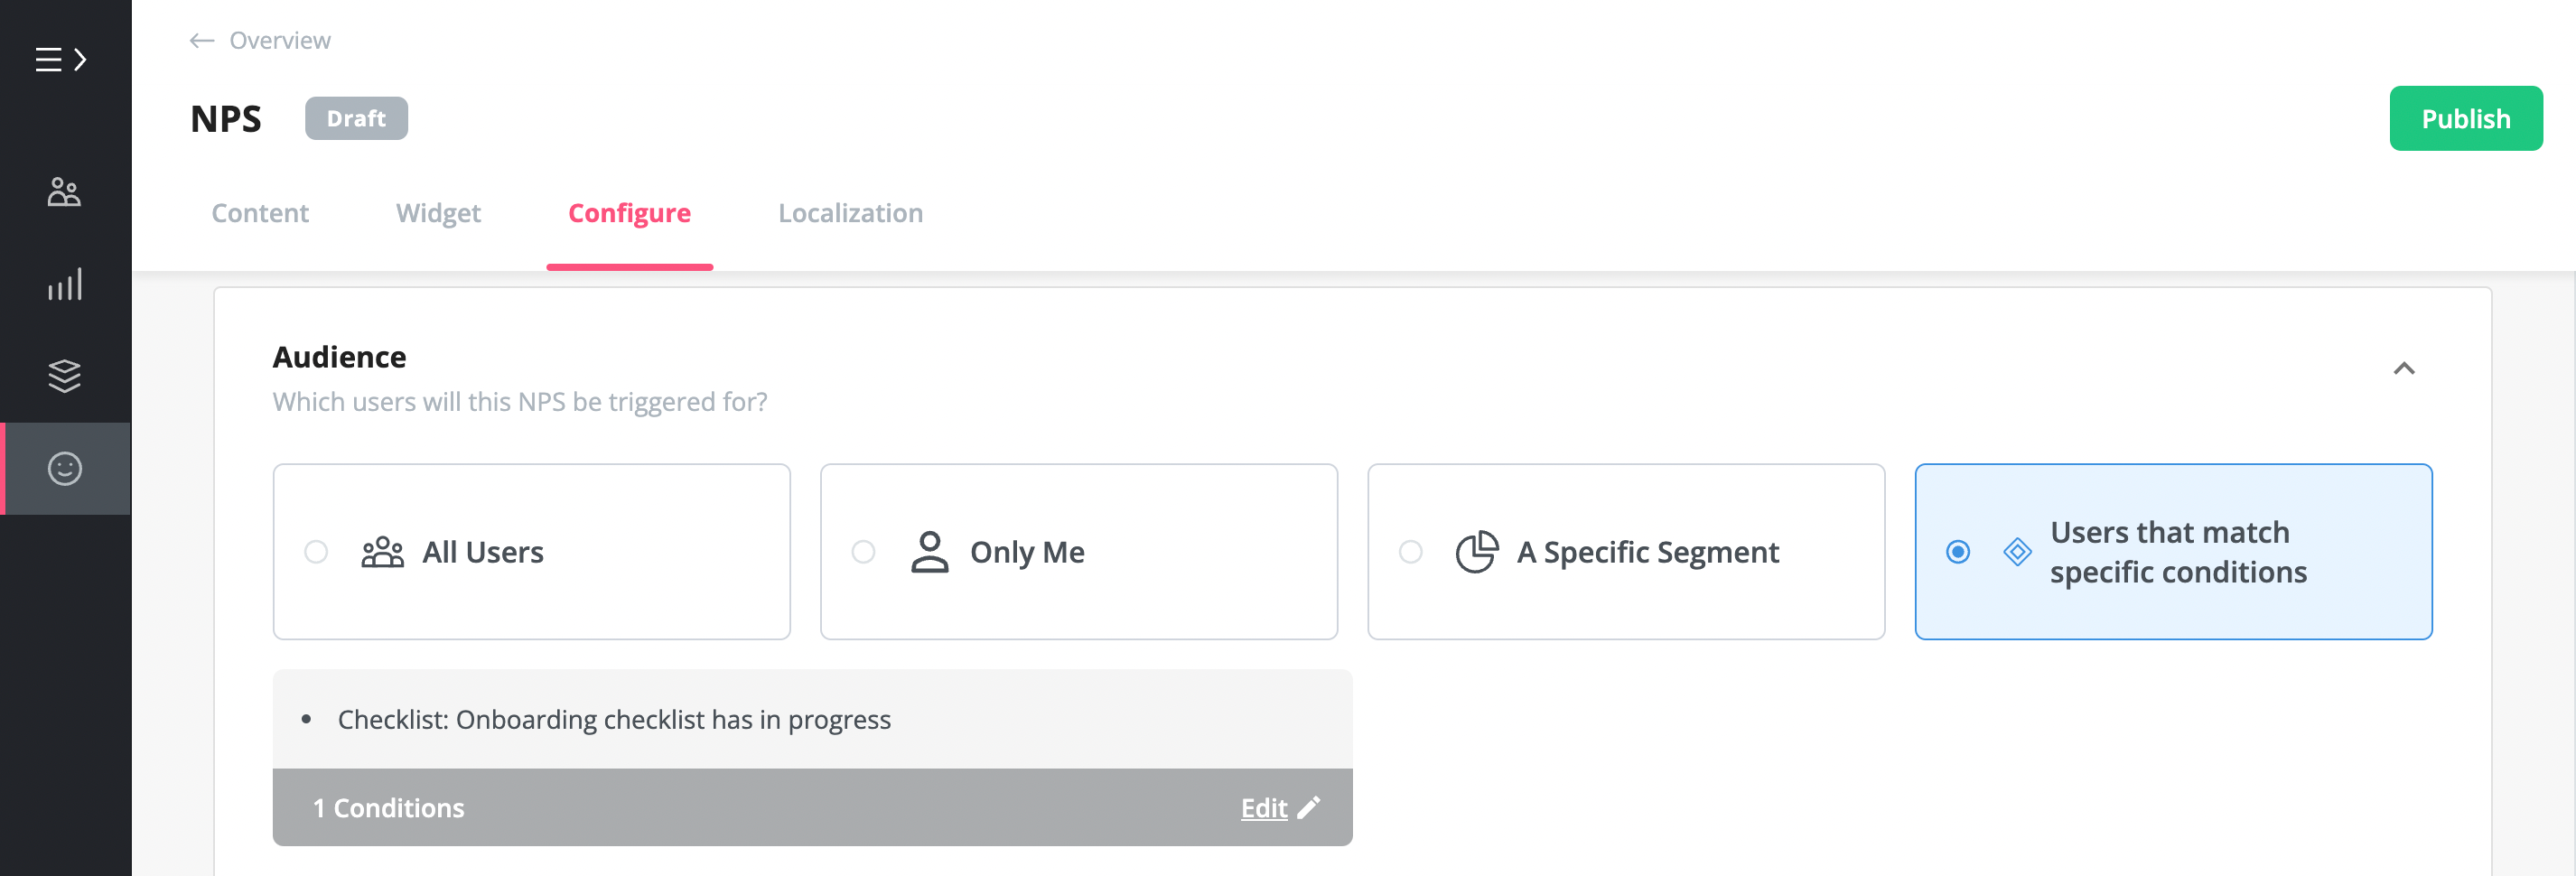
You can also add a qualitative follow-up question to the survey and customize the frequency at which the survey appears to customers who click on “Ask me later”.
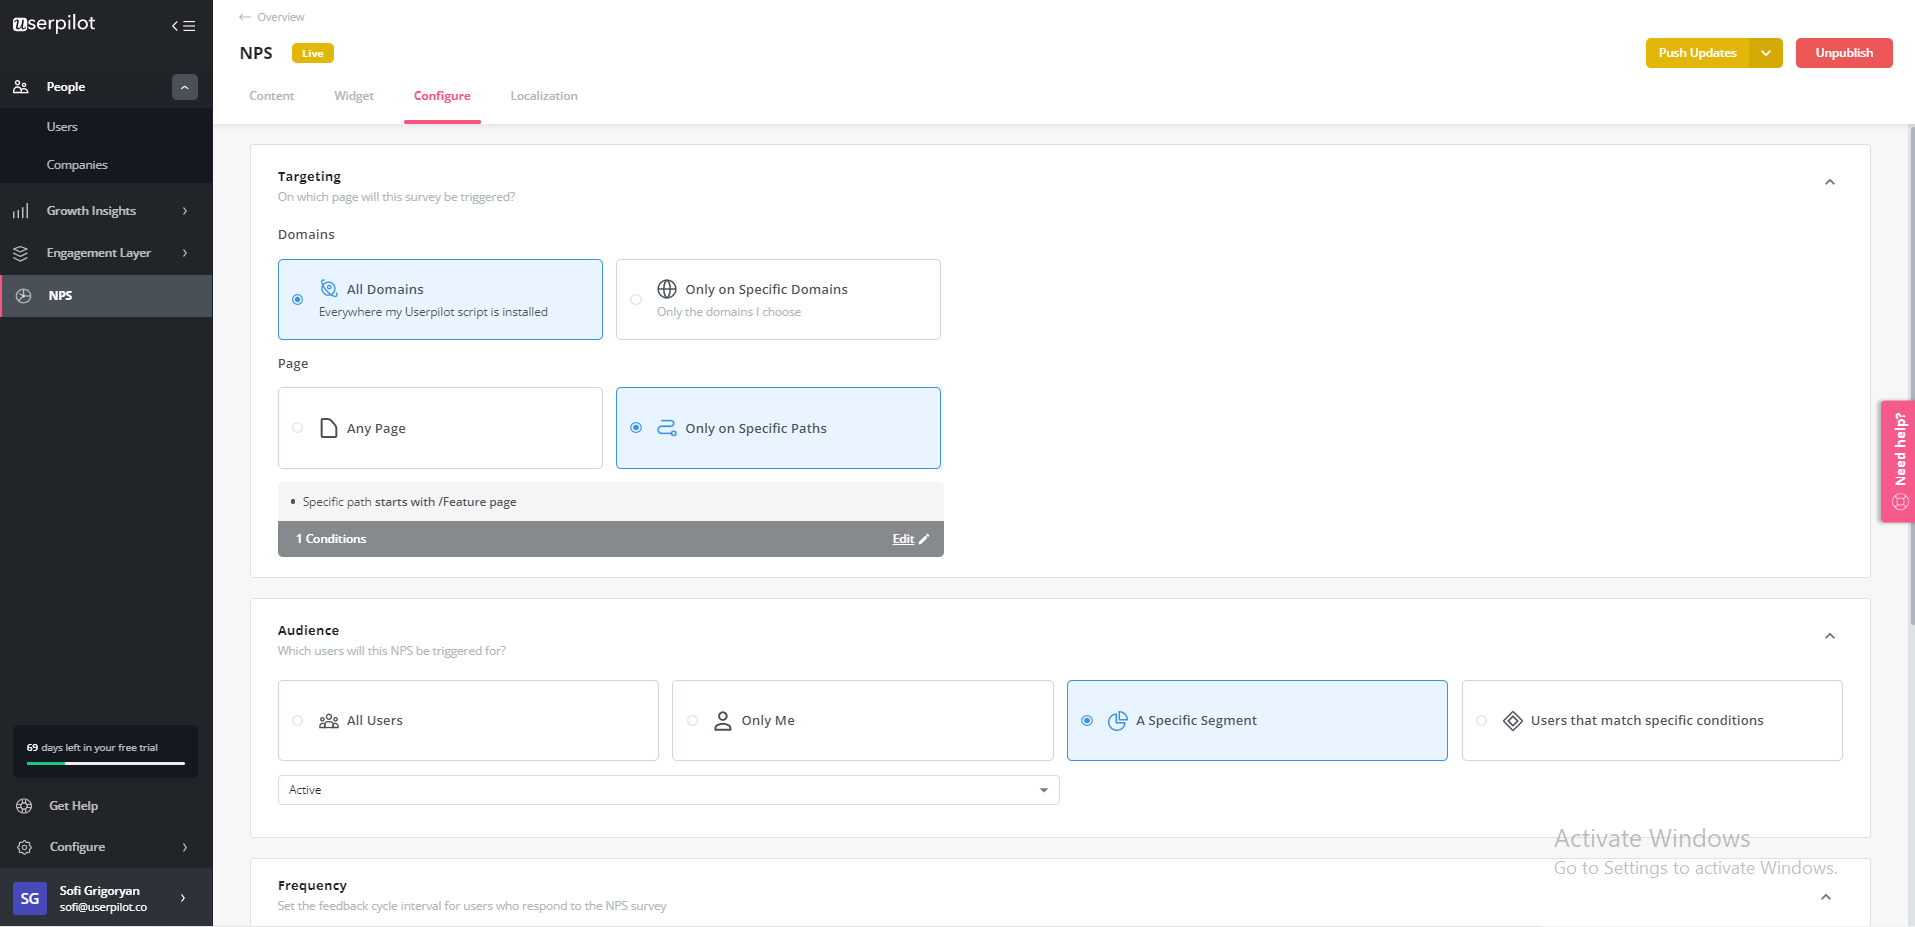
The “Configure” tab allows you to choose the specific recipients of the survey, based on domain, page, and audience.
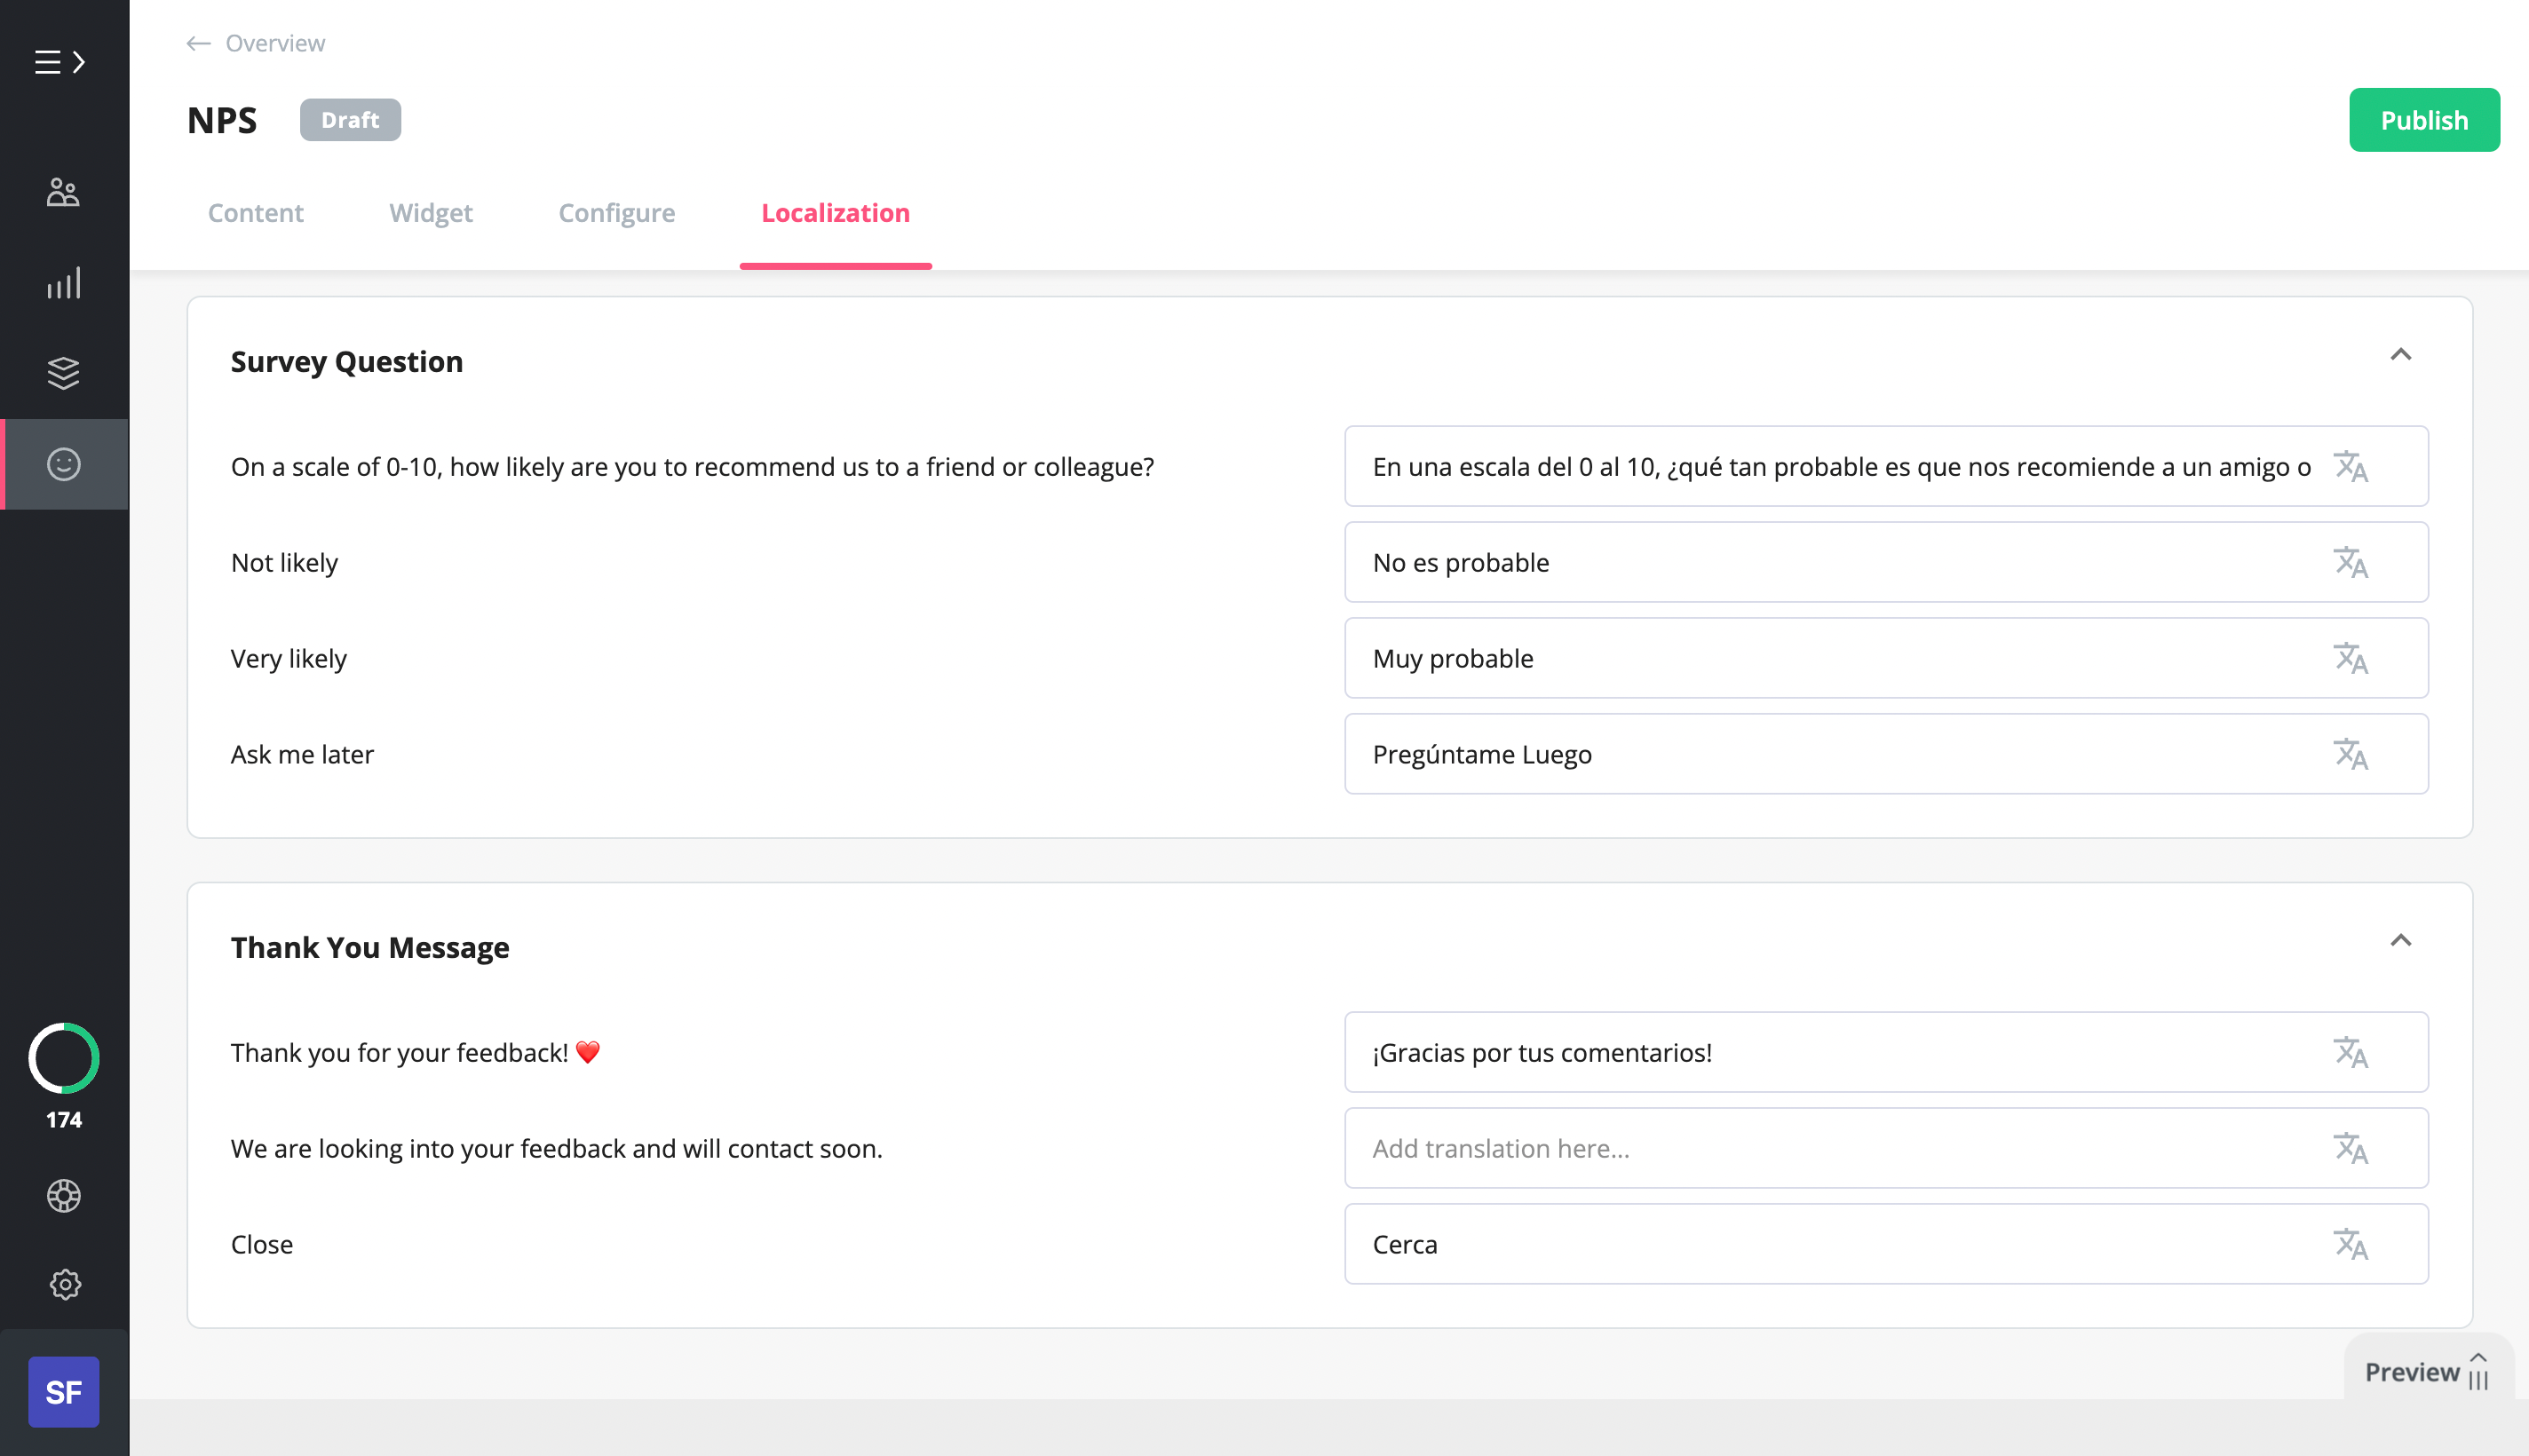
You can also automatically localize the content of the NPS survey in a matter of seconds. This will encourage more users to fill in the survey.
Use the NPS analytics feature to easily segment users into promoters, passives, and detractors. You can further group the feedback into separate themes to understand what inspires customer satisfaction.
Userpilot’s NPS functionality is available in all of its pricing plans, starting at $299 per month(paid annually). As opposed to other NPS feedback software, you’re not limited by survey responses. You also benefit from a complete product growth tool with user onboarding, customer feedback, in-app messaging, in-app resource center, and product analytics features.
Qualaroo
Qualaroo is a SaaS business platform that lets companies get valuable insights from their prospects and customers in real-time, while they are using the app or website. With Qualaroo, you can create NPS surveys and send them via email, desktop, web app, link, and more.

It uses AI to analyze customer feedback by using keyword analysis and sentiment analysis, thus turning qualitative feedback into actionable insights. The tool is mainly used by large organizations due to its price and complexity. Pricing plans for email and contextual NPS surveys start at $79 per month.
Survicate
Survicate is a powerful survey, NPS, and feedback management tool that helps companies gain more user feedback and deliver improved customer experiences.
But it offers limited service when it comes to targeting a specific audience. Survicate offers a free plan so you can test the product before committing to it.
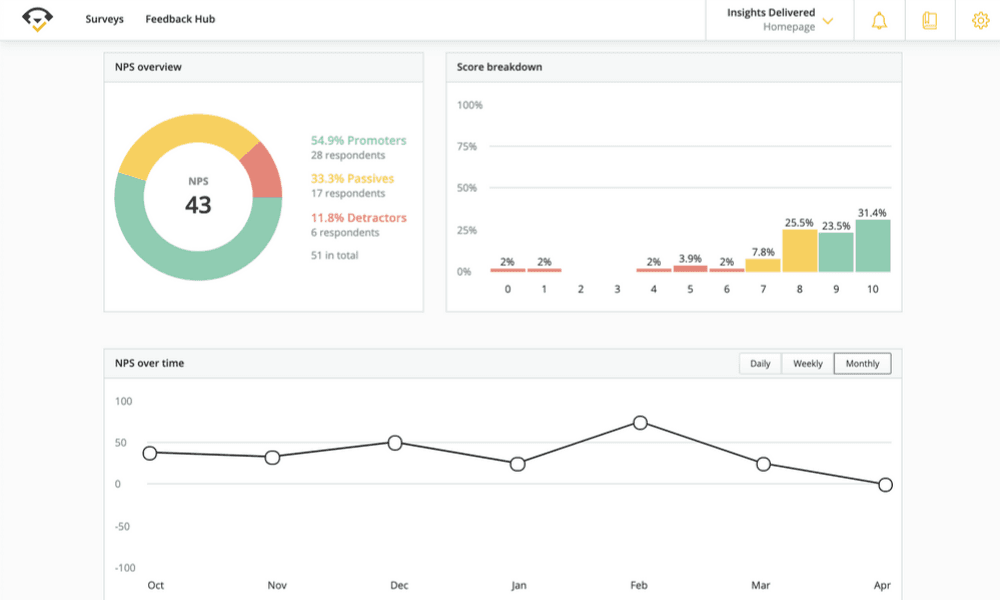
Conclusion
The NPS score is a mere number unless you break it down and assess the parts. Using NPS analysis, you can find gaps in your product and customer service and take steps to close those gaps. You can also identify the best attributes of your product and always maintain them.
Want to get started with NPS analysis? Get a Userpilot demo and see how you can improve user sentiment about your product.


![What are Release Notes? Definition, Best Practices & Examples [+ Release Note Template] cover](https://blog-static.userpilot.com/blog/wp-content/uploads/2026/02/what-are-release-notes-definition-best-practices-examples-release-note-template_1b727da8d60969c39acdb09f617eb616_2000-1024x670.png)

