If you don’t know what metrics to focus on, product analysis becomes more like taking a shot in the dark. You’re doing something, but you can’t guarantee if it will be useful or not.
That’s also probably why product analysis hasn’t been working for you.
This guide will help simplify things so you can reach more accurate conclusions instead of just guessing, covering topics like:
- Key product analysis components.
- Steps of the product analysis process.
- Product analysis traps to avoid.
- How to pick the right product analysis tools.
Try Userpilot Now
See Why 1,000+ Teams Choose Userpilot

Key components of product analysis
Product analysis typically involves 3 main elements, which we discuss below. However, which element/s you prioritize depends on your analysis goal.
For example, startups developing a new product might focus more on market research and competitor analysis. In contrast, companies aiming to go upmarket will concentrate on competitive product analysis and customer feedback.
Market research
Market research is a continuous process of analyzing external factors influencing a product’s potential success. It includes tracking competitors’ actions, market trends, and user behavior and preferences, to ensure your product adapts and stays relevant over time.
Market research always starts with the basics: defining your target market. But there’s more to it than that. It can also help:
- Identify market opportunities, uncovering unmet needs that you can tap into to meet market demand.
- Guide product development, informing product decisions or marketing strategies based on real-time market feedback.
In action, market research could look like surveying potential users to understand pain points, preferred features, and willingness to pay.
Competitor analysis
Competitor analysis involves evaluating your competitors’ strengths, weaknesses, strategies, and offerings. But ideally, not all those things should be evaluated at once.
Instead, it’s best to narrow down your analysis objectives, making it easier to focus on the most useful information.
To do so, consider whether you’re looking at a direct competitor and finding ways to beat them. Or benchmarking your product metrics to find where you stand? Maybe just comparing products in a niche to find gaps you could tap into?
Now, when thinking of competitor analysis, your first thought is probably SWOT. While that isn’t wrong, here are some more creative research tactics to try:
- Google alerts: Enter your competitor’s name and relevant keywords, like “new integration”, into the tool. You’ll receive notifications whenever they’re mentioned online.
- Sales guides: One good practice is to look for competitor docs using the search structure: “company name” “sales guide” or “partner guide”, and even mention the document format like “PDF” or “PPT”. Or more optimized, you can use the original Google search operators, e.g. “site:competitor.com filetype:pdf”
- Demo videos + Help docs: You can look at competitors’ help docs or dig for hidden demos (i.e. on their YouTube page or by providing emails). Personally, I did this too when researching our competitors’ features when most of them are locked behind paywalls.
- Analyst reports: Check Gartner Magic Quadrant, a graphical competitive positioning of four types of technology providers, useful for unlocking the competitor’s customer feedback and complaints.
- Wayback Machine: Use similar tools to see how their messaging and direction changed.
- Competitor analysis pages: Product pages where tools primarily compare their features, pricing, and user reviews to those of main competitors, like Asana vs. Trello.
Customer feedback and behavior insights
Product analysis is supposed to be about giving customers what they want. So what better way to achieve that than by directly listening to the voice of the customer? That’s why collecting user feedback is so beneficial because you get observations straight from the source.
Similarly, tracking user behavior helps better understand how users interact with your product, providing data on product usage, engagement patterns, etc.
Apart from driving product improvements, such insights are also useful for:
- Personalization: Tailor experiences based on behavior to increase user engagement and retention.
- Customer support: Identify patterns in feedback to address common issues proactively.
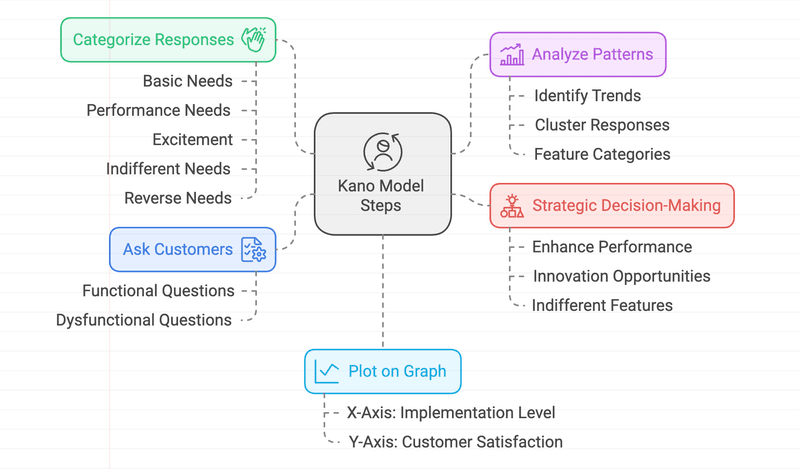
Coming to customer feedback analysis examples, the Kano Model is both interesting and effective. The model helps prioritize product features by categorizing them into 5 types of needs: Basic, Performance, Excitement, Indifferent, and Reverse needs.
Next, it uses feedback to determine how features impact customer satisfaction. With these findings, the model guides you in balancing essential features with innovations that delight customers.
Key steps of the product analysis process
Most product analytics guides are like that friend who loves to give advice but never actually does anything themselves. They’re all about “best practices” and “combining data,” but when it comes to the actual process, they leave you hanging.
That’s why we’re skipping the tips and going straight to the 4 basic steps of the product analysis process.
Define product analysis objectives
Before you even think about opening up your analytics dashboard, you need to know why you’re doing this in the first place. What questions are you trying to answer? What problems are you trying to solve?
This is crucial because it prevents you from becoming a data pack rat, hoarding every single metric “just in case.”
Next, let’s go over the steps on how to define your objectives.
- Start with the “Why”: What user behaviors are you trying to understand or influence? (e.g., “Why are users churning?”)
- Determine what data to collect: Figure out what data you need to answer those questions. Either quantitative metrics or qualitative insights (i.e. “Churn rate, user engagement metrics, feature usage, etc.”).
- Specify key metrics aligned with your goal (i.e. Reduce churn by 10%). These are the metrics that will tell you whether you’re moving the needle in the right direction.
Let’s set up an example to walk you through the analysis process better. Suppose an invoice management tool is aiming to increase revenue. To decide its product analysis objective, the team might start by questioning how they can get more paying customers (i.e. the problem to solve).
To answer the question, they could collect quantitative metrics like conversion rate (the key metric in this case). This naturally makes the analysis objective to be “Improving conversion rates“.
Decide how to collect product analytics data
Once you’ve defined your objective and identified the type of data you need, the next step is determining how to collect that data. This involves two key factors:
- Data sources: Business intelligence tools, analytics platforms, user surveys, customer support tickets, etc. Where’s your data hiding? Consider whether to use analytics platforms, like Google Analytics for website performance or Userpilot for behavioral data and direct user feedback.
- Collection methods: Event tracking, heatmaps, A/B testing tools – what’s the best way to capture the data you need?
Many guides may clump this step with another. However, this deserves to be a separate step because deciding the “how” ensures you gather accurate, relevant data to answer your key questions.
Plus, choosing the right sources and collection methods directly impacts the quality of insights you can extract. Without a clear plan, you risk collecting incomplete or insignificant data, which can lead to misinformed decisions.
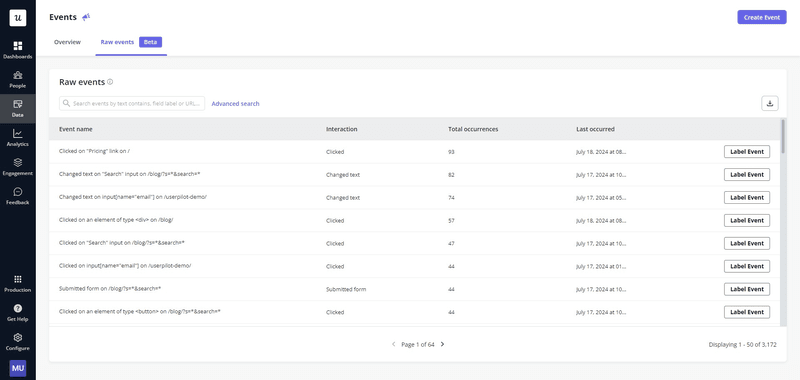
Let’s continue with the invoice management tool example that’s looking at conversion rates, a quantitative metric. So the data source and method that makes the most sense is customer journey tracking. This involves collecting data on conversions at each main event, from signing up for a trial to becoming a paid customer.
This tracking gets easier with Userpilot’s auto-capture feature. You won’t have to worry about deciding which events to track or risk missing any important ones, ensuring a well-rounded view of your customer journey.
Choose analysis methods for your data
Now for the fun part: making sense of all that data. There are tons of analysis methods out there, but here are a few to get you started:
- Funnel analysis: Identify where users drop off in a sequence of actions. For example, how many users add items to a cart but don’t complete the purchase?
- Trend analysis: Track patterns or changes over time. For instance, are daily active users increasing after a new feature launch?
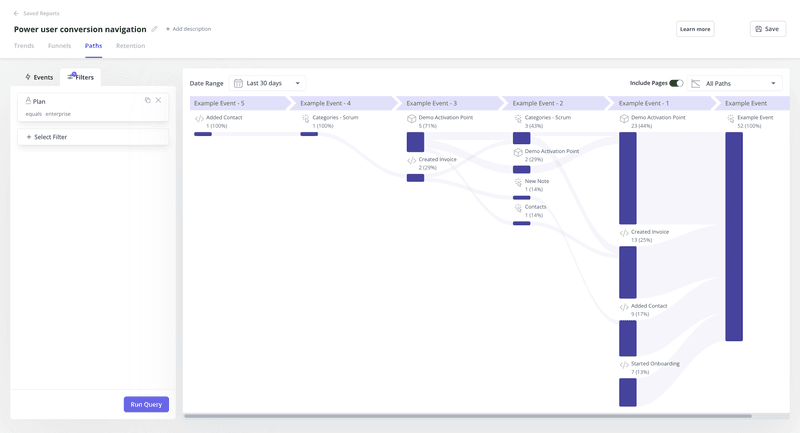
- Path analysis: Understand the common sequences of user actions, asking questions like what steps users take before checking out.
- Cohort analysis: Compare behaviors across groups sharing a common characteristic. For instance, do users who signed up last month retain better than those from six months ago?
- A/B testing: Measure the impact of variations to optimize outcomes. For example, does a blue CTA button perform better than a red one?
Let’s look at the invoice management tool again. The team may hypothesize that poor conversion is due to drop-offs at key events during the customer journey. They’ve already collected the data for it in the previous step.
Now, to validate the hypothesis, you can either use funnel analysis or path analysis. In this case, I’ll go with path analysis to:
- see if users follow the ideal path to conversion.
- identify the path with the most significant drop-off rate.
Looking at our image example, we can tell most people drop off after adding contact and starting onboarding. So now we know where in the journey our customers have issues.
Iterate based on insights
Product analysis is an ongoing process. Iterating ensures continuous improvement by refining strategies based on the latest insights and changing user behaviors.
In practice, iterating means acting on product analytics data by:
- Regularly reviewing the product analysis report and data to identify trends and gaps.
- Adjusting strategies based on findings (e.g., update features, tweak marketing strategies).
- Testing new hypotheses using the same analysis methods.
Going back to the invoice management tool, suppose the funnel analysis reveals a big drop in users between onboarding and first-time use (i.e. activation). To figure out what’s happening there, analyze session recordings of the onboarding flow to track user actions like scrolls, clicks, and hovers.
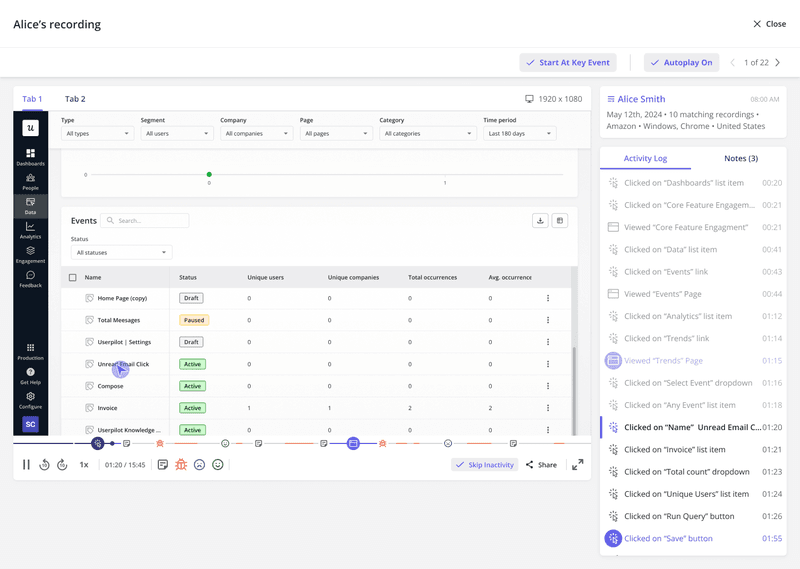
Alternatively, you can also experiment to see what impacts conversion. For instance, run an A/B test on the onboarding sequence where version A is the control group, while version B includes an onboarding checklist to guide users through key steps. Then check the funnel analysis again, and you’ll see a positive impact on conversion between those steps.
So the key is figuring out what might be negatively impacting things and letting that guide what to experiment on. Then just keep reiterating and improving based on these insights, and you’ll have successfully implemented the product analysis process.
Common product analysis traps
To avoid any misleading conclusions, here are the common product analysis mistakes to look out for.
Inconsistent data naming
When different teams or systems use varying names for the same event, it makes data hard to compare, leading to confusion and inaccurate analysis.
For example, let’s say you’re tracking email interactions. All the teams you collaborate with might capture the same event with different names:
- Marketing team: “email_opened” (when a user opens an email).
- Product team: “opened_email” (same event, but worded differently).
- Sales team: “email_clicked” (tracks clicks on links within the email).
To avoid this inconsistency, establish a data naming convention across your team. Regularly document new terms/phrases and communicate these standards to ensure everyone is aligned.
Untested assumption
Untested assumptions occur when conclusions are drawn without validating the root cause first.
For example, if users drop off at a specific page in a funnel, you might assume the page design is the issue. But without testing, that’s just an assumption.
Instead, steer clear of guesswork and let the data do the talking. In the case of funnel drop-offs, you could start by developing a hypothesis like, “Poor page design causes drop-off”. Then A/B test different page designs to confirm or refute the assumption.
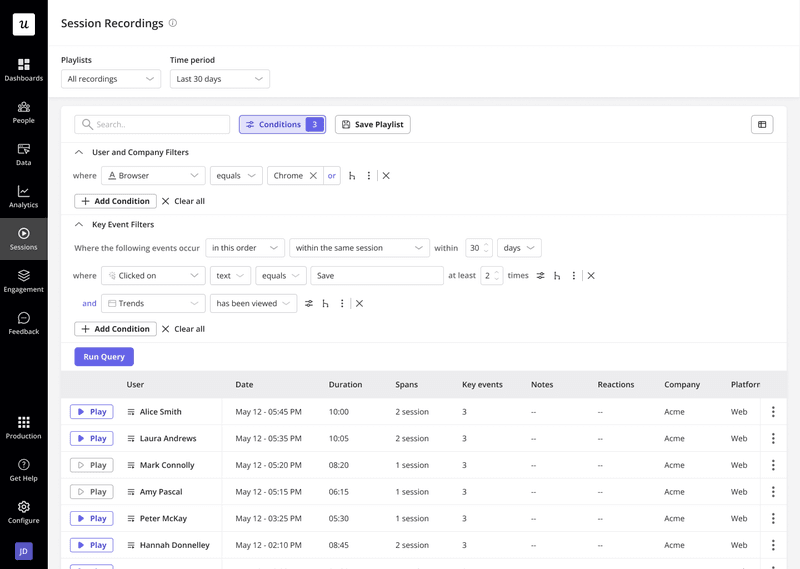
Alternatively, you could use session recordings to segment users who drop off and investigate their behavior for insights.
Vanity product analytics metrics
Vanity metrics are numbers that look impressive but don’t help you make better decisions or prove value. Not all metrics are valuable for all companies, so to avoid focusing on these, consider the following:
- What are you trying to track? Focus on metrics that align with your product’s goals and help answer questions about performance.
- What stage is your product at? For instance, LTV isn’t useful unless your product is decades old. Early-stage products should prioritize usage metrics instead (e.g., DAU/MAU) to gauge stickiness.
- What do you know of users’ pain points? For example, collecting CSAT or NPS won’t explain much. Instead, try effort scoring to pinpoint friction points in user interactions.
These questions provide a good base to start with. In addition, remember that good metrics should be easy to understand, comparative (ideally over time), ratios or rates, and actionable. If a metric doesn’t prompt any changes in behavior, it’s not worth tracking.
How to choose the right product analytics tool
Product analytics tools can make the entire process easier and more accurate. But with so many options out there, picking the right one is a task. To help simplify your search, here’s a list of all the questions you should consider:
- What are your specific needs and goals?
Define your objectives, e.g. user engagement, conversion, or feature optimization. - What kind of data do you need to collect?
Determine if you need behavior, events, or feedback data. - What is your budget?
Ensure the tool fits within your financial limits. - What is your team’s technical expertise?
Opt for no-code options, like Userpilot, if your team doesn’t have a dedicated data scientist. - What features are essential for you?
Focus on must-have features, e.g. reporting, A/B testing, or segmentation.
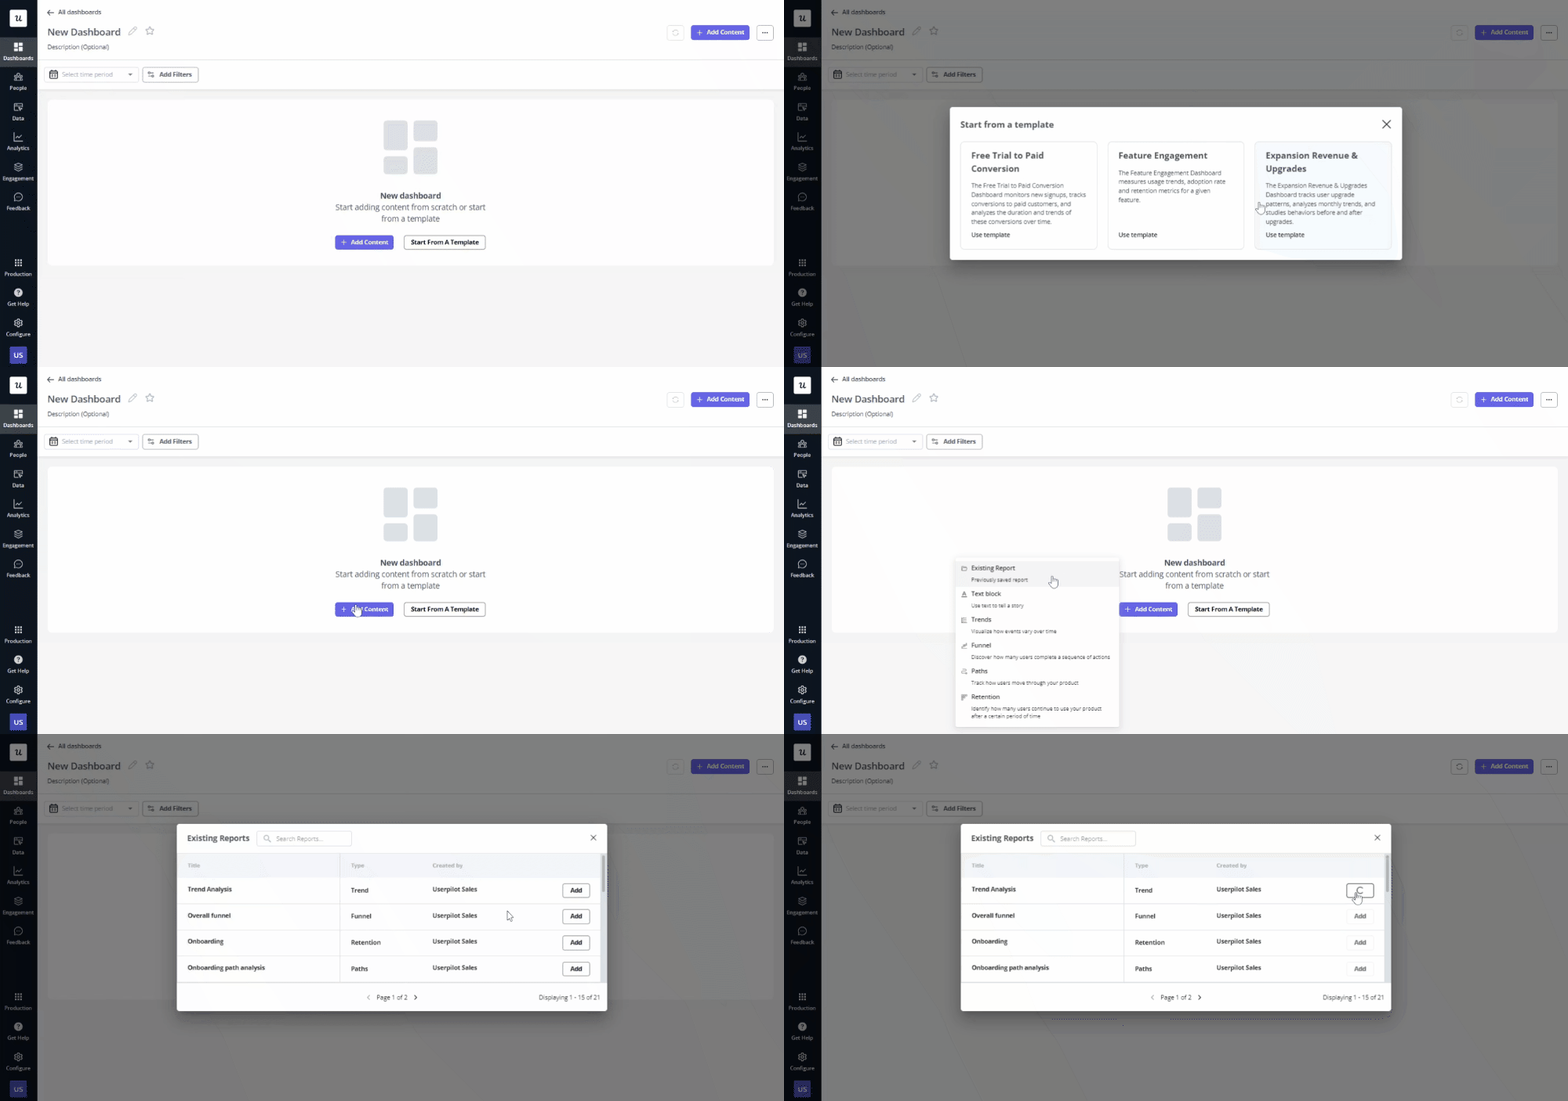
If you’re looking for a solution to drive product growth with data-driven insights, try Userpilot. We equip you with the necessary tools, like auto-capture, session recordings, and tons of data visualization functionalities, to unlock greater product potential.
Conclusion
One thing warrants re-emphasis here: Effective product analysis isn’t just about tracking metrics, it’s about driving strategic decisions.
This means ensuring your analysis is well-aligned with business objectives, so every insight informs growth, innovation, or competitive advantage. So invest in tools and frameworks that cut through the noise, providing precise results and actionable outcomes.
Looking to improve your product analysis? Book a Userpilot demo and see how you can better understand user behavior across the product journey with actionable analytics and event tracking.
Product analysis FAQs
What is product analysis?
Product analysis is the process of examining user behavior and feedback to understand how your product or service is performing. It involves using real user flow data to evaluate the experience and inform product improvements, helping companies make more data-driven decisions.
What is in a product analysis?
A product analysis always includes:
- Market research: Identifying trends and opportunities.
- User feedback: Gathering insights on satisfaction and pain points.
- User research: Understanding user needs and behaviors.
- Product metrics: Analyzing product performance and success.
Why do designers do product analysis?
Designers do product analysis to uncover specific user pain points, assess how existing products solve (or fail to solve) these issues, and identify design gaps. This allows them to create refined solutions that are both functional and relevant in the market.


