Tracking your customer churn rate will help you keep tabs on business growth.
You will have data sets for analyzing your churn/retention history, which will better position you to make intelligent business decisions.
This article shows you various ways to calculate churn, make sense of the data, and create proactive solutions to retain more customers.
Try Userpilot Now
See Why 1,000+ Teams Choose Userpilot

What is customer churn?
Customer churn is the rate at which customers discontinue their subscription or stop using a particular product or service.
Churn could happen for various reasons, from customer dissatisfaction with your brand to changing business needs that make them switch to competitors (more on that later).
Types of churn rates you should calculate
Churn is quite broad. Differentiating the different types will help you track and reduce attrition with ease.
Let’s go over the most common types of churn:
- Customer churn rate: this metric shows how many customers stopped using your products or services during a certain period.
- Revenue churn rate: a measure of the recurring revenue lost by your business through subscription cancellations and downgrades.
- Involuntary churn rate: customer attrition caused by any factor that isn’t the customer’s choice. For example, it’s involuntary churn when customers experience payment failures and can’t upgrade or when a bug in your system mistakenly flags a customer’s account for cancellation.
How to calculate the customer churn rate?
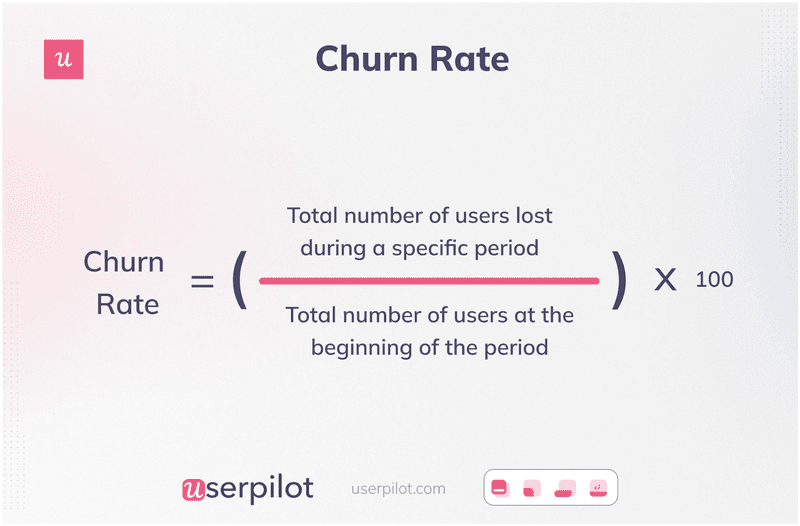
To calculate customer churn, use this simple formula: Divide the number of users lost during the period of interest by the number of users you had at the start of the period. Multiply the result by 100.
For example, imagine you started the year with 700 customers but somehow lost 50 by July. Your churn rate is 50/700 X 100 = 7%
How to calculate the revenue churn rate?
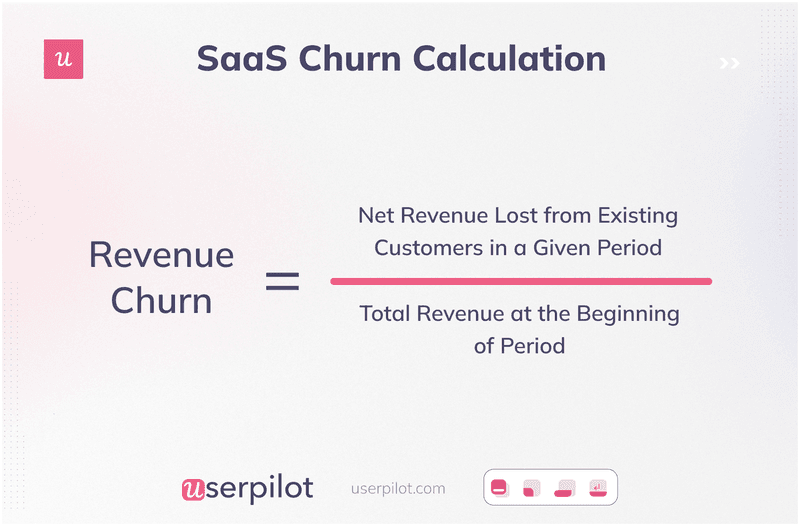
To calculate revenue churn, divide the net revenue lost from existing customers in a given period by the total revenue at the beginning of the period.
For example, if your March loss from downgrades is $4,000 while the MRR is $80,000, your revenue churn is 0.05.
You can calculate your revenue churn monthly or annually.
Having both numbers provides a more nuanced and complete picture of customer retention. It also helps in identifying short-term trends, setting long-term goals, benchmarking performance, and making critical decisions to improve customer retention.
Monthly churn rate formula
Your monthly churn rate refers to the percentage of customers lost over a month.
How to calculate: (number of customers you had at the beginning of the month) – (number of customers you had at the end of the month) / number of customers you had at the beginning of the month X 100.
Monthly tracking comes with several benefits. For instance, you can use the data for cohort and retention analysis or to create a churn prediction model that tells you which months of the year customers are more likely to churn.
Annual churn rate formula
The annual churn rate is the percentage of customers you lose in a year. Similar to the monthly churn rate, calculate this metric by dividing the number of customers lost in a year by the number you had at the start of the year. Multiply the figure by 100.
Annual churn rates will flatten out the influence of seasonality or marketing campaigns on churn so you can see your business’s long-term story and set benchmarks for yourself.
How to use the adjusted churn rate formula?
Fast-growing companies might struggle with a churn rate formula that only accounts for lost customers.
A more complex formula showing churned customers while also including the users added in that period will provide more accurate data.
Use the following formula to get a better picture of your churn rate:
(Y / [ (W+X) / 2 ] ) x 100 = Z
- W = Number of users at the start of the period
- X = Number of users at the end of the period
- Y = Number of churned customers during that period
- Z = Churn rate percentage
What is a good churn rate: SaaS customer churn benchmarks
The ideal churn rate varies, depending on your growth stage.
For established SaaS companies, the average is between 5% to 7% churn per year and around 1% or less monthly.
Early-stage startups will understandably have higher churn as they’re still getting their footing, may still be struggling with product-market fit, or have products needing improvement. If you’re an early-stage startup or SMB, expect an average annual churn of 10% to 15%.
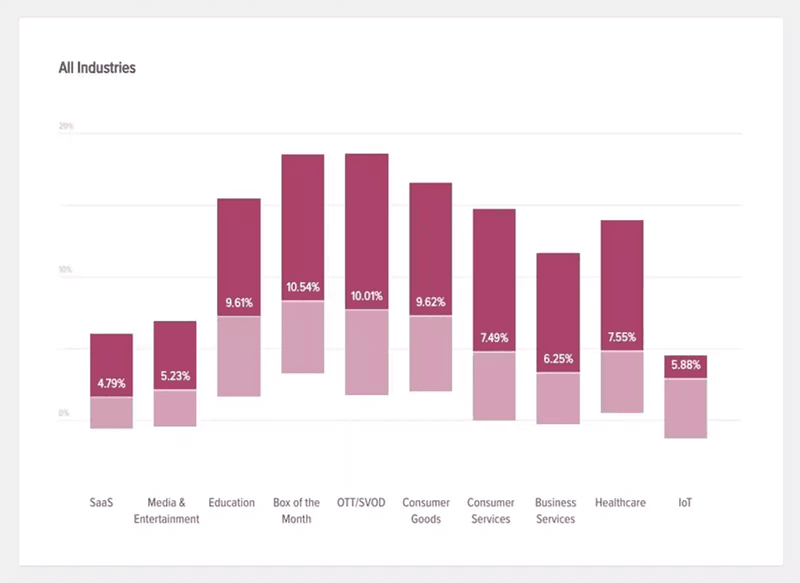
Churn also depends on your industry. Subscription management platform Recurly sampled over 1,500 sites in 19 months and reported how churn rates differ between industries. Take a look:
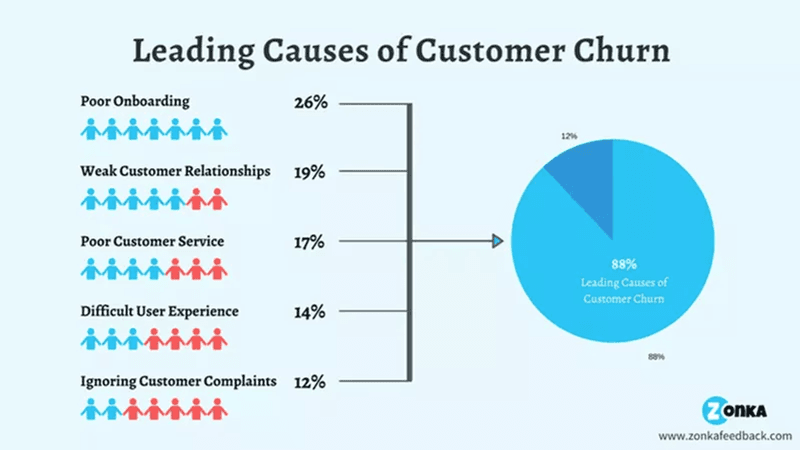
Most common reasons behind high churn rates
Churn can happen for a thousand and one reason. But here are the most common ones:
- Bad product-customer fit: Some companies attract customers through wrong positioning or overpromising. Then the customer gets in and realizes the product can’t solve their problems, and they churn.
- Poor onboarding: Even with the right audience, a bad onboarding experience can result in churn. Users will experience delayed aha moments, and many won’t have the patience to wait and see if the tool is for them.
- Bad customer service: Long wait times, back-and-forth conversations, and any such support friction-weary customers. The negative experience leads to churn.
- Weak customer relationships: Failing to listen to customers through active and passive feedback leads to weak company-customer connections. These users are quick to replace you with competitors—they don’t feel valued and won’t have a problem leaving.
- Price increases: Price increases are tricky. More often than not, existing customers won’t feel it’s justified and would rather switch to cheaper alternatives.
Other metrics subscription-based companies should track
By tracking the following metrics, you’ll have a more holistic understanding of your business and identify improvement areas:
- Customer retention rate: This is the opposite of the customer churn rate; it refers to the number of customers your company keeps over a given period. By analyzing retention rates over a specific period, you can better understand customer behavior and identify potential churn patterns. Calculate your retention rate by dividing the number of customers who remained active by the total number of customers in that period and multiplying by 100.
- Monthly recurring revenue: This is the predictable recurring income generated from customers on a monthly basis. To calculate, multiply the number of monthly subscribers by the average revenue per user (ARPU).
- The average revenue per user: This is the amount your company can expect to generate from an individual customer. Analyzing the ARPU across different customer segments helps identify variations in revenue generation. With this data, you can predict if specific customer segments are more likely to churn or need additional attention to prevent churn. Calculate ARPU by dividing your total revenue in a specific period by the total number of users in that period.
- Customer loyalty: This is an ongoing positive relationship between customers and your business that results in repeat purchases and word-of-mouth referrals. Measure loyalty through NPS surveys—your loyal customers are promoters that give you a 9 or 10 NPS rating. By tracking NPS and analyzing the distribution of scores, you can identify segments of customers who may be more prone to churn and focus on improving their experience and loyalty.
- Overall customer satisfaction: This metric measures how well your company’s products meet customer expectations. Track it using CSAT microsurveys with a rating scale at important touchpoints in the user journey.
7 Customer retention strategies to reduce customer churn rates
We’ve already discussed numerous ways to calculate, track, and benchmark churn. The next logical step would be actively working on improving your rates.
Implement the following strategies to increase customer retention in your SaaS:
Personalize user onboarding for different customer segments
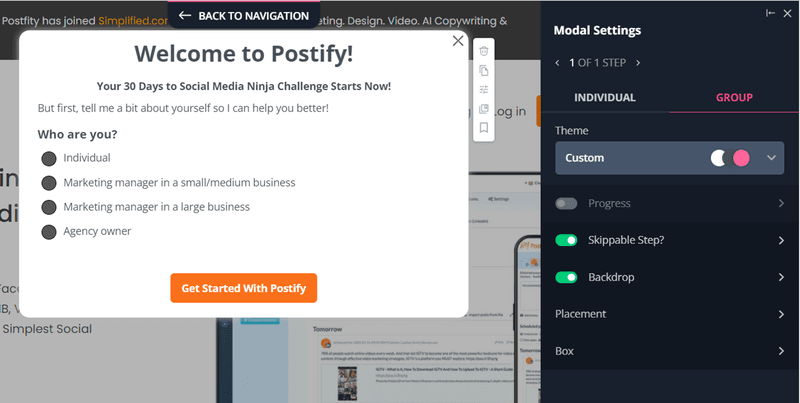
Personalization streamlines your onboarding flow and ensures users only see the features they need. Users will experience value fast, reach activation quickly, and be more willing to stick with you.
You can create personalized onboarding by using a welcome survey to collect new user data. Focus your survey questions on understanding the user’s pain points and jobs to be done. Use that data to personalize their onboarding paths.
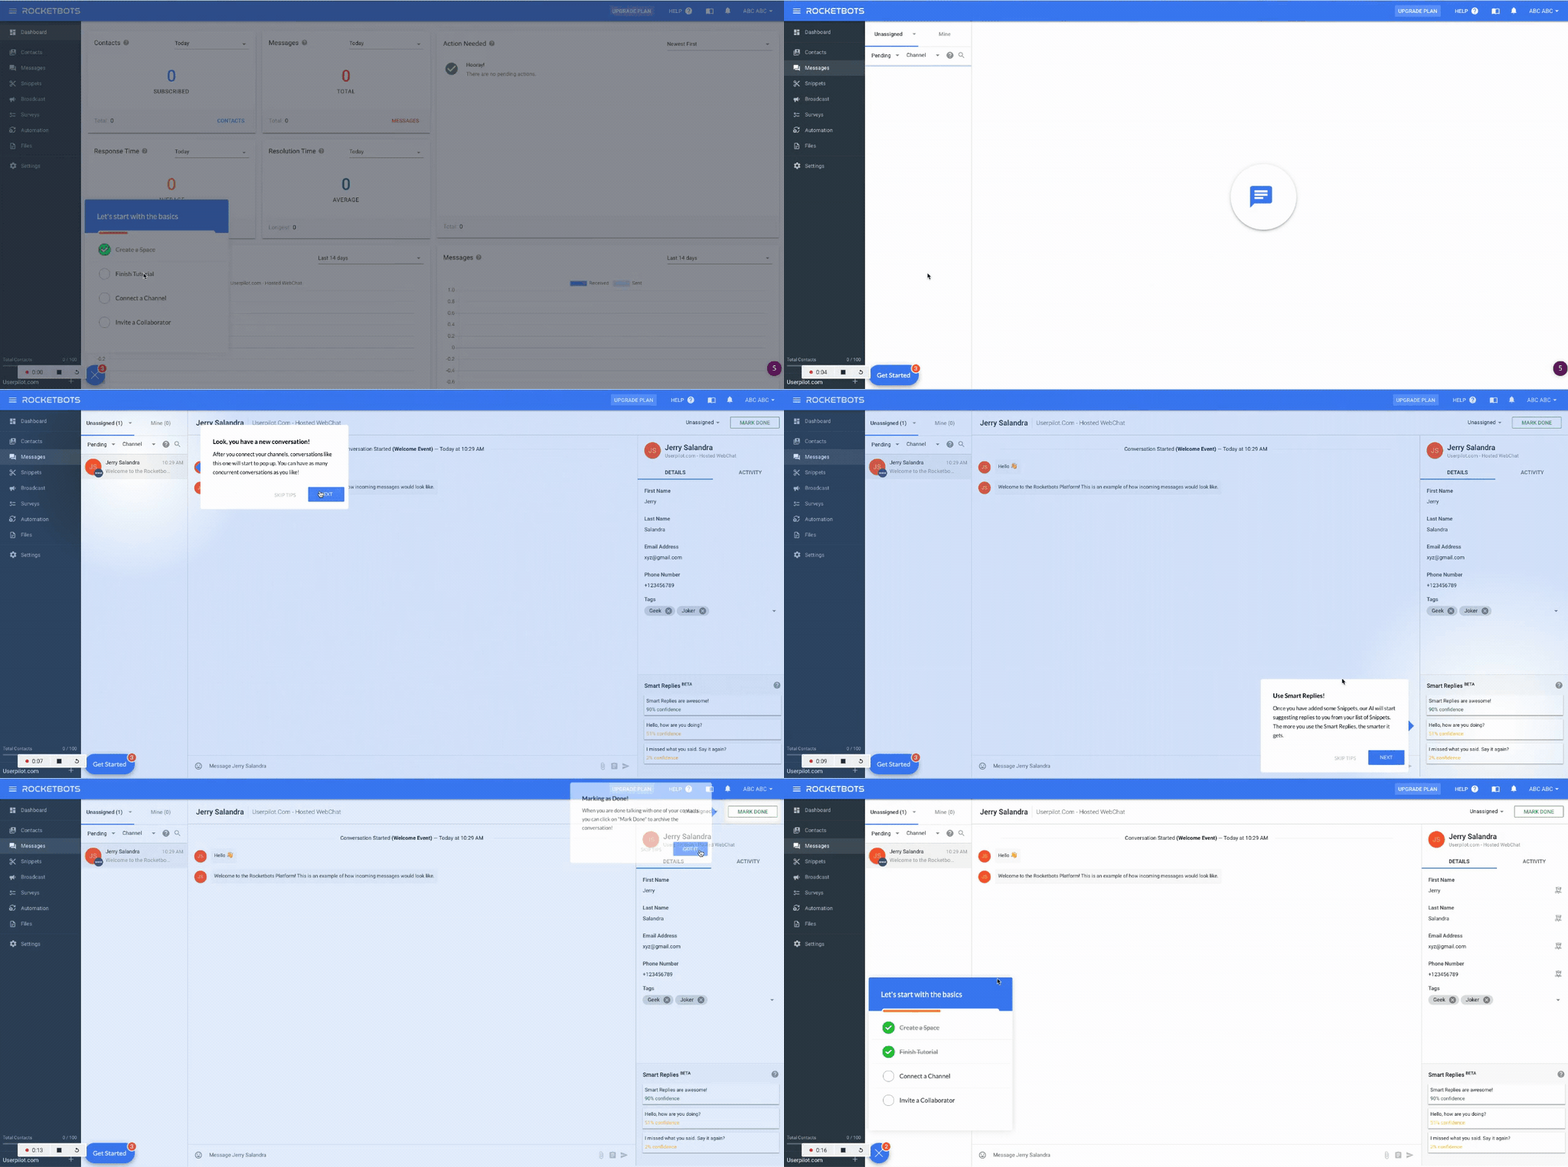
Use interactive walkthroughs to contextually guide new customers
Interactive walkthroughs show users how to use a feature step-by-step. Trigger it contextually to eliminate confusion and help users gain value from your features.
This is much better than bland product tours—or worse, leaving users to figure out your tool on their own.
Contextual guidance improves feature adoption rates, and churn will reduce as customers begin to use and find your features valuable.
Leverage secondary onboarding to retain existing customers
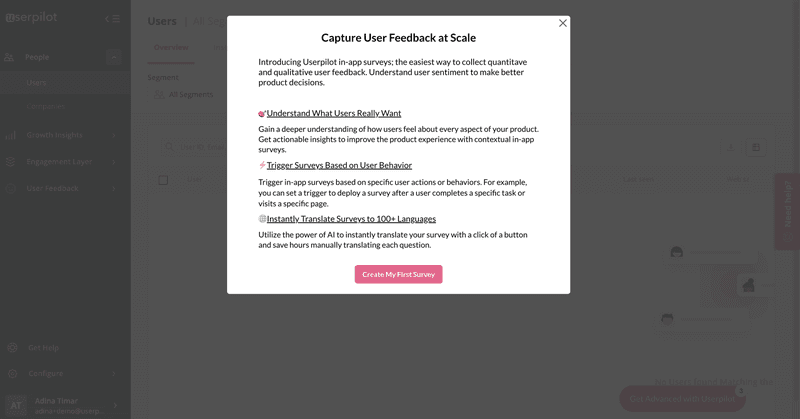
Onboarding doesn’t stop when new customers start using your tool comfortably. Employ secondary onboarding—introduce users to more advanced features and use cases once they’ve adopted the key features.
You can do this with contextual in-app messages such as modals, hotspots, tooltips, etc.
Secondary onboarding drives repeated value and improves product adoption breadth and depth. Churn also reduces because the more users integrate the product into their lives, the less likely they are to stop using it.
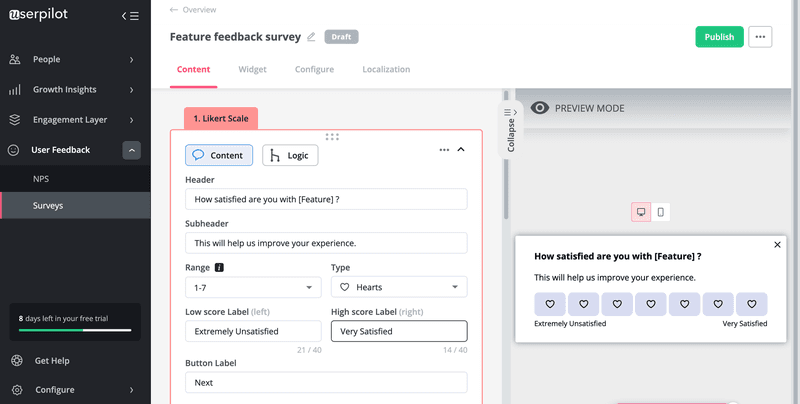
Measure customer satisfaction across the user journey
Use short microsurveys to measure customer satisfaction at different touchpoints. The typical CSAT survey is quantitative, but you can also ask follow-up questions for qualitative insights. Combining both will help you better understand what causes dissatisfaction.
The next step is to segment unhappy customers and proactively reach out to them to offer help and prevent churn.
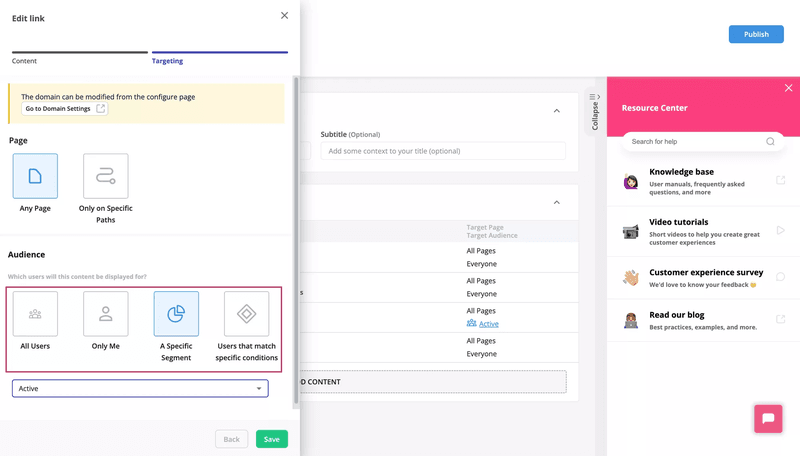
Offer self-serve support to remove friction and improve customer experience
Making customers who already have a problem wait for hours before receiving help will only push them away further. Prevent this by building robust self-serve support that allows users to get quick and easy help no matter the time of day.
You can go one step further and personalize the help according to users’ JTBD and place it in the customer journey. For example, you might have sections such as “Getting Started,” “Troubleshooting,” “Advanced Features,” “Account Management,” etc.
You can also utilize user data and behavior to dynamically recommend relevant knowledge base content.
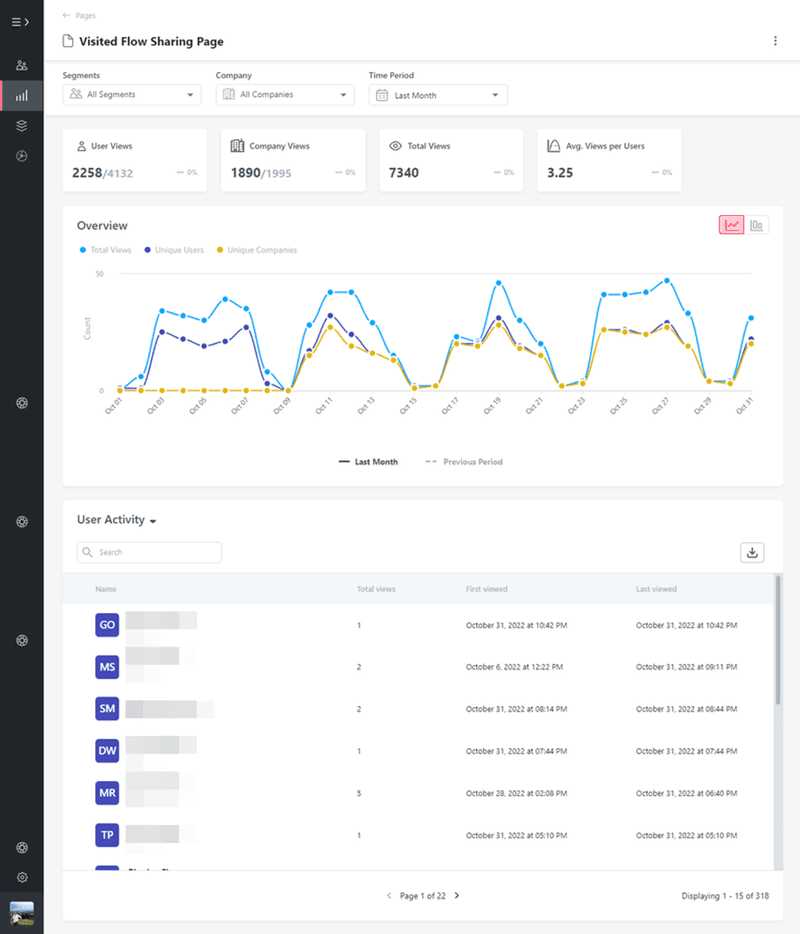
Track in-app customer behavior to identify at-risk customers
Definitely keep tabs on customer pulse and monitor user behavior to identify drops and spikes in user activity. Try to analyze further to find the reasons for the sudden changes.
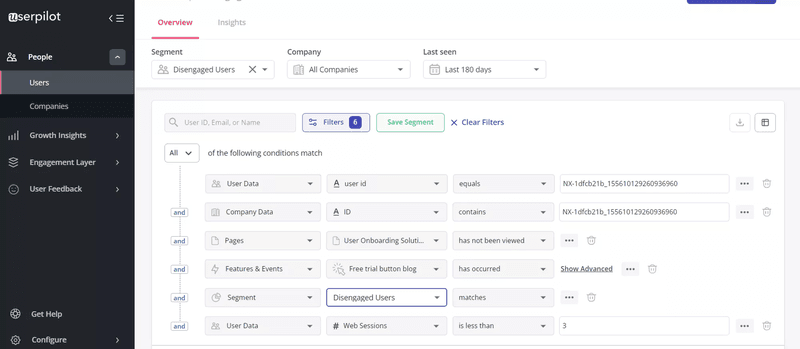
Segment disengaged users and trigger re-engagement flows to win them over. This could be anything from win-back email campaigns to tooltips that prompt users to engage with a key feature that will bring value to them.
Collect feedback from churned customers to understand what went wrong
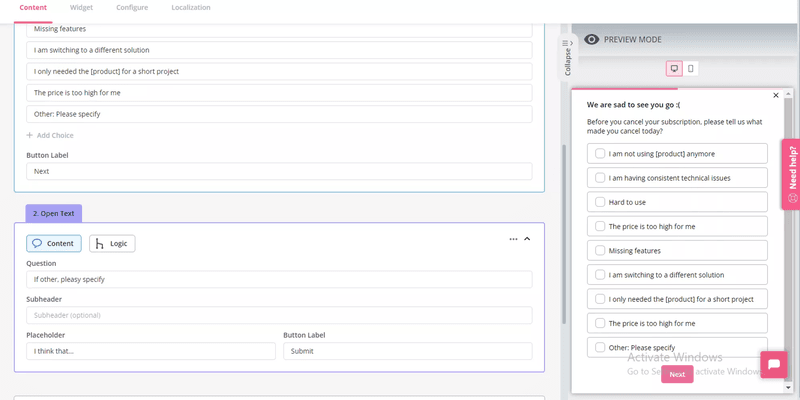
Churn surveys let you know the reasons behind churn and fix them to prevent other customers from leaving for the same reasons.
As with every survey, timing is important here. Trigger your churn surveys in-app as soon as users hit the cancel account button. No one will go ahead and answer a survey they got via email after they finished canceling their account.
Conclusion
Ensure to regularly track churn rates (monthly is ideal). This will enable you to make data-driven decisions that proactively prevent churn among new and existing users.
Userpilot can help with that. As previously mentioned, our platform lets you understand churn through user behavior tracking and in-app surveys and triggers customized product experiences to drive retention.
Book a demo now to talk with our team and begin the process of reducing the customer churn rate for your business!


