7 Product Analytics Examples Every SaaS Team Should Steal


Most SaaS teams collect data but fail to act on it effectively. A Salesforce report found that 94% of business leaders believe they could get more value from their data, while 78% of analytics and IT heads admit their companies struggle to turn data into action.
Missing out on customer insights means lost opportunities to improve experiences and unlock revenue growth.
In this guide, I’ll share practical product analytics examples showing how real companies make smarter decisions. We’ll look at the types of analyses they run, the data they track, and action steps you can take to turn raw data into measurable growth.
Why invest in product analytics?
Product analytics provides actionable insights to help you understand user needs and behaviors. Instead of guessing, you see exactly where customers drop off, which features drive stickiness, and what separates your power users from detractors.
In practice, this translates to:
- Faster onboarding: Spot friction early and guide new users to value sooner.
- Reduced churn: Identify warning signals before customers leave, and fix the experience in real time.
- Higher expansion revenue: Understand which behaviors predict upgrades, then double down on them.
And there’s data to back it up. In a 2024 Product-Led Alliance survey, 32.3% of respondents cited revenue growth as their primary goal with product analytics, followed by user retention (29.8%) and activation (23.4%). More than two-thirds said analytics visibly helped them achieve these outcomes.
What’s your biggest challenge with product analytics right now?
Which tools are you currently using for product analytics?
What is your main goal with analyzing product analytics examples like these?
Ready to see actionable product analytics examples in your own product?
Stop guessing and start seeing. Userpilot can help you track user behavior, build beautiful in-app onboarding, and increase feature adoption. Get a personalized demo to see how.
Who does product analytics help?
It’s easy to think product analytics benefits only product managers. But in reality, its impact cuts across the entire SaaS organization.
Take Userpilot, for example. Here’s how different teams in our company put product insights to work:
- Product teams use analytics to prioritize features, track adoption, and spot drop-offs in real time. It’s a faster, more reliable user feedback loop than relying solely on surveys or customer interviews.
- UX designers analyze behavioral data to see how users interact with interfaces, where they hesitate, and which elements underperform, then refine user flows for better usability.
- Growth strategists depend on user behavior data to build, test, and measure growth ideas. For example, they might track funnel drop-offs in onboarding, experiment with in-app nudges to improve conversion, or analyze which campaigns lead to lasting user engagement.
- Customer success teams track usage patterns and feature adoption to identify at-risk accounts early, reduce churn, and proactively offer help.
- Development teams leverage error tracking and event data to debug issues faster, prioritize fixes that affect the most users, and improve release quality.
- Marketing & sales use data analytics to segment audiences based on actual product behavior (not just demographics). This helps them run sharper campaigns, qualify leads, and uncover upsell opportunities faster.
From our experience, the best results come when these teams share insights rather than operate in silos. The latter keeps teams busy but blind, while the former transforms analytics into a collective growth engine.
7 Real-life SaaS product analytics examples
From onboarding to retention and revenue expansion, the examples I’ve handpicked show how SaaS teams use analytics to fuel success:
1. Cuvama: Using path analysis to resolve errors and build trust
Cuvama is a value-selling platform that helps sales teams demonstrate business impact and close deals with confidence.
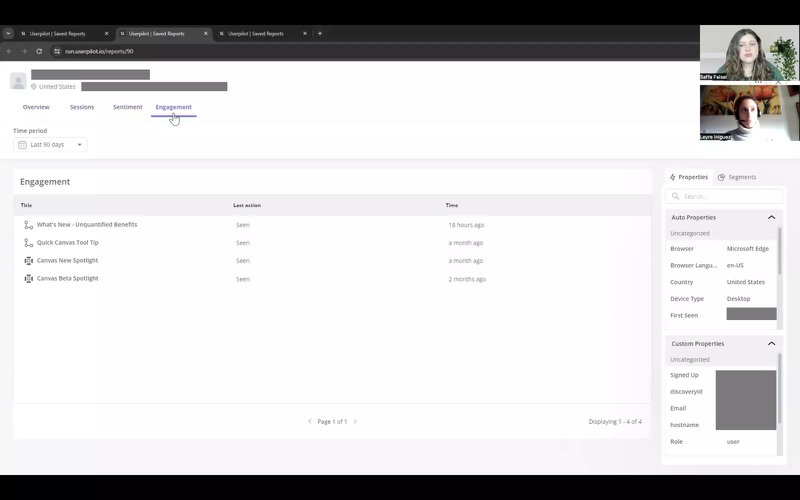
But they also knew customer success starts with something simpler: user confidence in their own platform. To strengthen this, the team used Userpilot’s path analysis tool to automatically track user behavior and ensure customers were moving smoothly through key product areas.
That’s when they spotted something unusual. A handful of users were encountering persistent error messages. Because these users never filed support tickets, the issue remained invisible, quietly creating frustration.
To resolve the issue, Customer Experience Lead Leyre Iniguez drilled down into the affected segment using Userpilot’s user profiles feature. This allowed her to identify exactly who had run into the error, then reach out to each user personally to explain the issue and offer a fix.
In her words,
“I love the user profiles feature. I can come here and directly see who is my user who is having those problems so I can directly contact the person and check out what’s going on.” – Leyre Iniguez, Customer Experience Lead
Cuvama’s proactive approach showed customers that the company was paying attention, and it resulted in higher customer satisfaction, stronger trust, and a smoother user experience across the board.

Key takeaway
Turn error analytics into a customer success tool. Like Cuvama, that might mean reaching out directly to affected users. And if the problem is widespread, loop in your development team, ship a fix, and communicate updates clearly so users know the issue is resolved.
2. RecruitNow: Measuring onboarding success with behavioral surveys
OnRamp’s 2025 State of Customer Onboarding Report shows 48% of customers abandon onboarding if they don’t see value quickly.
Every customer success team will tell you that the number is probably even higher. Yet 62% of onboarding leaders admit they lack real-time visibility into whether new customers are progressing toward activation, adoption, and renewal milestones. That blind spot often leads to missed engagement opportunities and preventable churn.
RecruitNow, a Dutch recruitment tech company, found itself in exactly this position. As the business expanded into new markets, relying on face-to-face training was no longer sustainable. They needed a scalable way to onboard customers while still understanding what was (and wasn’t) working.
The company turned to Userpilot and built in-app onboarding flows that guided users through core features step by step. Once live, they tracked how customers engaged with each interaction, revealing where users were dropping off or hesitating.
To make these insights actionable, they paired the flows with behavioral surveys that triggered automatically based on user actions. This gave the team a clear picture of customer progress and surfaced friction points in real time.
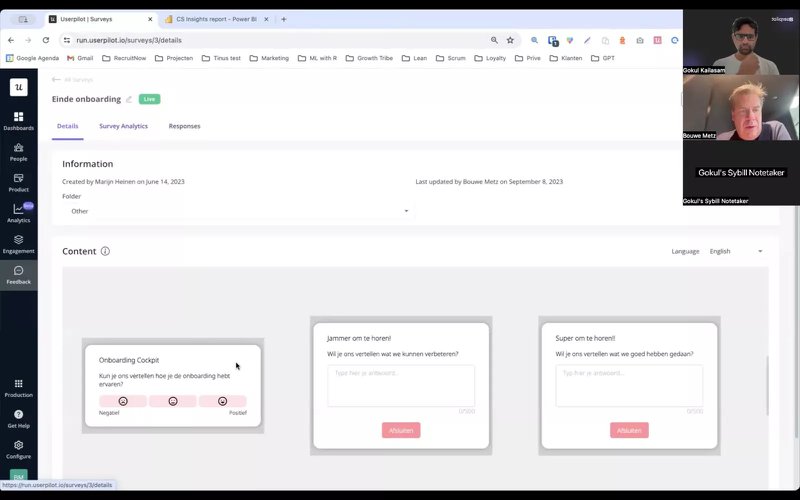
The result? This data-driven approach cut onboarding time from hundreds of hours a month to just 4. RecruitNow’s user training became consistent, scalable, and measurable, without the need to expand its customer success team.
Key takeaway
Trigger in-app surveys immediately after users complete onboarding milestones. This helps you capture fresh, specific feedback you can act on quickly.
And to close the loop, use a no-code product analytics and engagement tool like Userpilot to iterate on your flows fast without waiting on engineering support.
3. ClearCalcs: Using cohort analysis to shorten time-to-value
Remember how I mentioned that customers will abandon onboarding if they don’t see value fast enough? ClearCalcs experienced this first-hand.
The company provides structural design calculators that help engineers work faster, but many new users dropped off within minutes if they couldn’t find the exact calculator they needed.
To tackle this, ClearCalcs turned to Userpilot. They created a welcome flow that asked new users about their job roles, goals, and company size. This did two things at once: it allowed ClearCalcs to deliver personalized onboarding experiences, and it gave the team rich data for running cohort analysis over time.
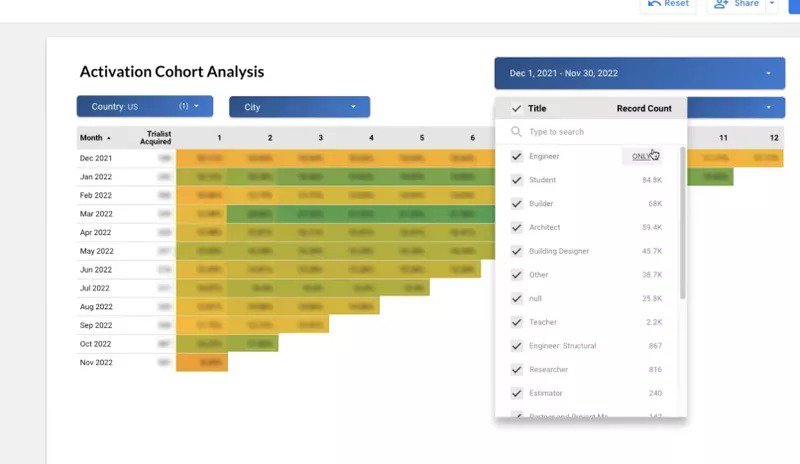
ClearCalcs compared engagement patterns across different cohorts, such as engineers and architects, trialists and paid accounts, or small teams and large organizations. This analysis revealed trends and friction points that weren’t visible in aggregate data.
Armed with these valuable insights, the team ran in-app experiments that guided users to value faster and improved activation rates.
“The value that Userpilot creates for us is that it lets us test things that we can’t necessarily allocate dev resources to” – Chris Borzillo, CEO and founder of ClearCalcs.
Key takeaway
Use cohort analysis to go beyond averages. Segment users by role, company size, or goals, and track their activation separately. The differences will highlight hidden friction points and give you the clarity to design targeted experiments that cut time-to-value.
4. Pictory: Segmenting high-LTV customers to boost conversions
While ClearCalcs focused on user activation and shortening time-to-value, Pictory wanted to boost revenue by zeroing in on the customers most likely to convert and stick around.
Pictory’s approach centered on detailed segmentation. They broke down their user base by factors such as location, industry, job title, and behavior, then tracked key product and business metrics for each segment. The result was the creation of a clear Ideal Customer Profile (ICP) worth doubling down on.
With that ICP in place, Pictory tailored its product development and marketing strategies toward the users who mattered most.
Cohort analysis then helped the team monitor engagement patterns over time, revealing which features drove stronger retention and which behaviors signaled churn risk. Acting on these insights led to a measurable impact: a 16% lift in conversions and churn reduced by half, from 30% to 15%.
Key takeaway
Your product may be attracting a diverse user group, but it can’t serve everyone satisfactorily.
Focus on identifying your high-LTV customers, then pay close attention to meeting their needs and optimizing their journey. This will help you increase conversions, reduce churn, and build a more sustainable growth engine.
5. LinkedIn: Using predictive account prioritization to increase renewals
LinkedIn has access to a vast amount of customer data, but turning that information into actionable insights is what drives real growth. To help its teams prioritize where to focus, LinkedIn developed Account Prioritizer, a feature within its CRM designed to surface accounts with the highest upsell and renewal potential.
The tool analyzes usage frequency, feature adoption, team size, and engagement signals to predict which customers are most likely to renew or upgrade. Instead of relying on gut feeling, sales and customer success teams get a ranked view of accounts with the greatest potential impact.
This predictive layer helps LinkedIn proactively engage customers before renewal dates arrive or churn risks appear. It also puts high-value accounts at the center of attention at the right time, which leads to stronger customer relationships and better revenue outcomes. In fact, LinkedIn’s internal A/B testing revealed that Account Prioritizer drove an +8.08% increase in renewal bookings.
Key takeaway
The true power of product analytics isn’t just explaining what happened; it’s anticipating what will happen next.
Use product analytics software like Userpilot to analyze customer behavior, predict actions, and set automated signals to help you act decisively. For example, you can set up custom events to flag when a customer reaches the limits of their current plan or engages heavily with premium features. This creates a natural upsell opportunity. Similarly, you can detect declining activity in renewal-critical accounts and trigger in-app nudges or personalized outreach before churn risk escalates.
6. DocuSign: A/B testing to boost onboarding and upgrades
DocuSign is a leading digital transaction management platform with millions of users worldwide. But that scale also meant big challenges: free users weren’t always converting, and too many new signers dropped off before creating an account or sending their first document.
To fix that, the team turned to product analytics. They mapped the entire customer journey from initial sign-up to paid upgrade, used funnel tracking to spot key drop-off points, and then ran A/B tests to experiment with different onboarding paths.
One experiment exposed premium features to free users, which delivered a 5% lift in upgrades. Another streamlined the account creation process, leading to a 15% increase in new signer accounts.
The most impactful change came when DocuSign introduced a guided first-time experience. Instead of leaving new users to explore the app alone, they walked them through sending a document right away. This shift led to a 10% boost in sign-to-send conversions, which is one of DocuSign’s core activation points.
Key takeaway
A/B testing isn’t just for landing pages. Use it inside your product to test onboarding flows, paywall prompts, or feature exposure. Even small improvements at these stages can compound into big gains in adoption, upgrades, and customer lifetime value.
7. Shopify: Using analytics to improve merchant reporting speed
For a platform that powers millions of businesses worldwide, Shopify knows every second counts. Merchants depend on timely reports to decide what products to promote, when to restock inventory, or how to tweak campaigns.
But traditional reporting was often too slow and left teams waiting for insights instead of acting on them in real time.
Shopify solved the problem by overhauling its analytics infrastructure. They enhanced real-time reporting so merchants could view up-to-the-minute sales and performance data without delays. On top of that, they introduced reusable reporting templates that let teams generate tailored reports quickly instead of rebuilding them from scratch. Customizable dashboards gave merchants an easier way to track key metrics at a glance.
The result was faster decision-making across merchant teams who could now react to trends as they happened. For example, Decathlon, one of Shopify’s largest customers, reported 50% faster reporting and 60% faster data analysis after adopting ShopifyQL Notebooks.
Key takeaway
Look for ways to streamline how your customers (or teams) interact with insights. Like Shopify, you could enable real-time analytics dashboards or create templates that cut down reporting time.
Don’t have the bandwidth to build internal solutions? Userpilot can help you perform all these functions without writing a line of code and freeing up time to focus on other activities.
How to make product analytics actionable in your SaaS
Looking at product analytics examples is inspiring, but the real growth happens when you actually implement product analytics in practice.
In this section, I’ll share practical steps drawn from our work on Userpilot and with our customers that show how to move from simply tracking metrics to driving measurable results in onboarding, retention, and revenue.
1. Identify the right metrics for your stage
From working with SaaS teams, I’ve seen that the right metrics depend on where your company is in its growth journey. Here’s how to think about metrics at different growth stages:
- Early-stage SaaS: Focus on activation rate, time-to-value, and engagement with core features. At this stage, your biggest question is: are users experiencing value quickly enough to stick around? ClearCalcs, for example, improved activation by using cohort analysis to guide different user types to value faster.
- Scaling SaaS: Once you have traction, you need to dig deeper into feature adoption by segment, retention cohorts, and triggers for expansion or upsells. Pictory took this approach, segmenting users by industry and behavior to zero in on high-LTV customers and maximize retention.
- Enterprise SaaS: When you’re operating at scale, the focus shifts to account-level health scores, role-based usage patterns, and product or feature adoption across entire departments. LinkedIn provides a strong example here. Remember how the company used its Account Prioritizer to spot upsell opportunities and churn risks at the account level rather than just individual users.
2. Choose product analytics tools that fit your workflow
After deciding on your key performance indicators, the next step is to choose a product analytics tool that will help you track and improve them.
There are tons of analytics solutions, and it’s understandably easy to get confused about what to choose.
Here’s what I tell SaaS teams: the best product analytics tools aren’t the ones with the longest feature lists, but the ones that fit seamlessly into your workflow
Some teams need lightweight solutions that complement existing reporting tools, while others need deeper behavioral tracking and in-app engagement features. The key is to match the tool with how your team actually makes decisions day-to-day.
Is Google Analytics enough for product analytics?
I get this question a lot. And the short answer is no.
Google Analytics and other popular tools like Adobe Analytics and Heap are great, but they’re limited when it comes to tracking granular user behavior data.
Here’s the thing about GA: it’s built for marketing analytics, not product teams. It’s fantastic for traffic sources and website conversions, but it falls short when you need deep insights into how users engage with your product. My team doesn’t rely on it for product decisions, and here’s why:
- Limited depth on user behavior: GA focuses on sessions and page views, not the step-by-step breakdown of how users interact with features.
- No true product analytics tracking: Feature usage, onboarding completion, and activation milestones require heavy custom setup and still lack rich context.
- Opaque data processing: Google applies its own logic to group sessions and identify users, leaving little transparency or control over how data is calculated.
💡Why Userpilot is a standout product analytics solution
If Google Analytics gives you the “what” at a surface level, Userpilot gives you the “why” and the “how” right inside your product. It’s built for SaaS teams that need to understand user behavior in real time and act on it without waiting on engineering.
Here’s where Userpilot stands out:
- Behavioral tracking without heavy engineering: With Userpilot’s auto-capture and session replay, you don’t need developers wiring up endless custom events. Every click, hover, and form fill is logged automatically, so you can view user interactions with each feature. For example, if you notice 60% of trial users drop off after clicking “Start free trial” but never complete step two, you can rewind the session to see where hesitation crept in and fix it.
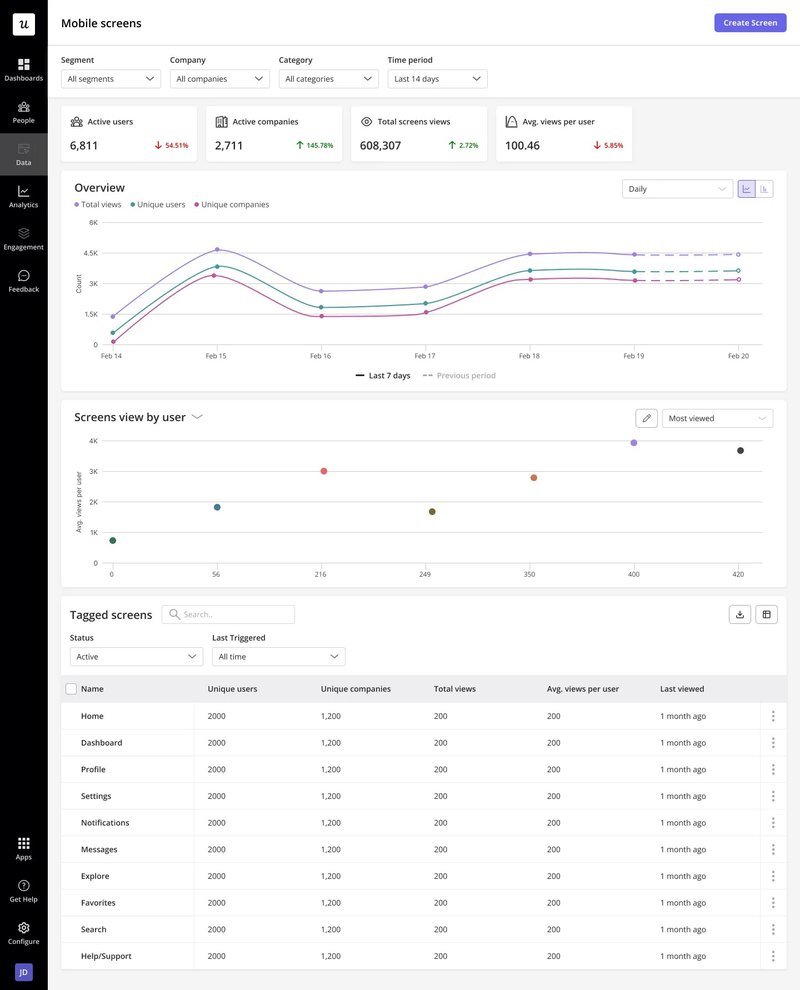
- Built-in segmentation and cohort analysis: With Userpilot, you can slice usage by plan, role, or geography, then run cohort analysis to see how behaviors evolve. This lets you uncover data insights that explain why certain users adopt faster or churn sooner. Additionally, Userpilot tracks behaviors across web and mobile apps to give you a complete picture to act on.
- In-app guidance and nudges from the same platform: Analytics alone doesn’t solve problems, action does. That’s why Userpilot lets you launch UI patterns like tooltips, modals, slideouts, and checklists code-free. Say you find that only 30% of users activate a new integration. Instead of exporting that data elsewhere, you can trigger a contextual nudge the moment they hit the relevant screen. For mobile, you can extend this reach with push notifications and help users stay engaged across devices. And because analytics and engagement live together, you get a unified view of the entire product experience.
3. Close the loop: Act on real-time data
If you spot trends but wait weeks to respond, you’re most likely already losing the window to make an impact.
Here are some examples of actions you can take immediately after analyzing customer data:
- Trigger onboarding nudges: If a new feature is underused, you can immediately surface a tooltip or walkthrough to guide users toward it.
- Launch retention campaigns: When accounts show early churn signals, trigger a targeted message before they disengage completely. For example, if usage drops suddenly, you might prompt them with an in-app survey asking what’s missing or offer a quick-start guide to bring them back on track.
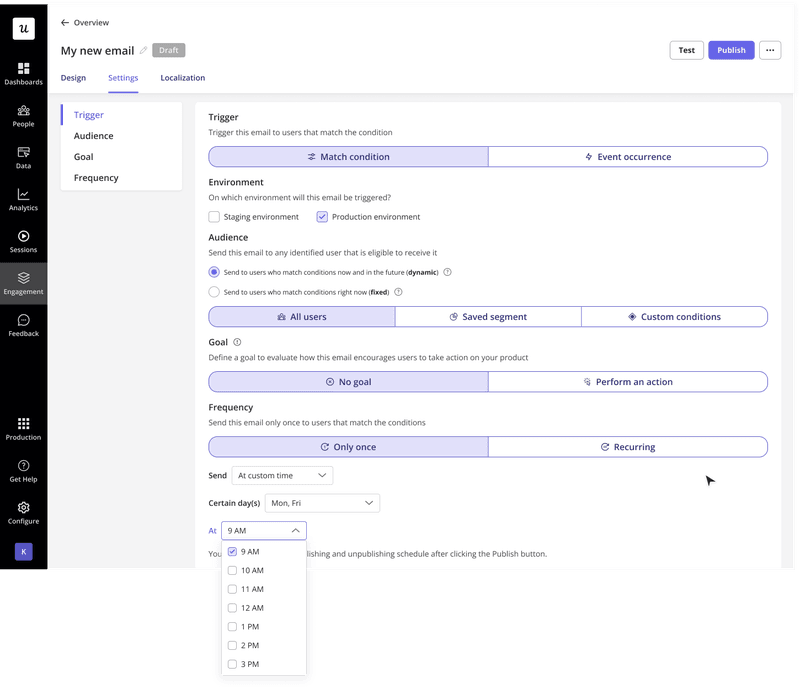
- Personalize upsell offers: Instead of blanket promotions, use feature usage patterns to suggest relevant upgrades at just the right moment. For example, with Userpilot, you can set up automated email triggers targeting users who’ve drifted away. From one no-code workspace, you design the email, schedule delivery, localize the content, and track the email analytics alongside product usage so the upsell offer reaches the right user at the right time.
Track, learn, act
From startups like ClearCalcs to giants like LinkedIn, the examples we’ve looked at prove one thing: product analytics helps you understand customers better, but growth only happens when you translate those insights into action.
That’s why Userpilot provides an all-in-one solution. Our platform lets you track both quantitative and qualitative data, analyze it for actionable insights, launch in-app experiences based on your hypotheses, and then measure performance to keep improving.
Ready to go beyond reading product analytics examples and actually put them into practice? Book a demo with our team today.
FAQ
What is product analytics?
Product analytics is the practice of analyzing how users interact with a product to understand what’s working, what’s not, and why.
Teams use these insights to optimize feature adoption and improve overall product success.
What are the types of product analysis reports?
Here are the key reports you can track across most product analytics platforms:
- Segment analysis: Understand how engagement varies by demographics, plan, or customer behavior.
- Funnel analysis: Track conversion rates between steps in a user journey, like signup to activation.
- Path analysis: Utilize user flow data to spot unexpected behaviors or drop-offs along the user journey.
- Trend analysis: Identify usage spikes, seasonal patterns, or long-term changes in product engagement.
- Cohort analysis: Monitor how different user groups behave over time (e.g., new vs. returning users).
- Churn analysis: Detect early warning signs that accounts may disengage or cancel, then act before it happens.
- Survey analysis: Combine quantitative data with qualitative feedback from in-app surveys to understand why users act the way they do.
What are the 4 types of analytics?
These four types help you understand data at different levels:
- Descriptive analytics: Examines past behaviors and key metrics to explain what happened.
- Diagnostic analytics: Explains why something happened by exploring root causes.
- Predictive analytics: Forecasts trends to anticipate what might happen next.
- Prescriptive analytics: Recommends optimizations based on existing data.
What are examples of analytics?
Analytics spans beyond product-specific tracking. Examples include:
- Behavioral analytics: Understanding user behavior and flow to improve UX.
- Business Intelligence (BI): Aggregating data across functions such as sales, operations, and performance metrics.
- Customer journey analytics: Mapping how users move through your product.
- Retention and churn analytics: Identifying patterns that predict who stays or leaves.
- Revenue analytics: Looking at how feature use or segments drive monetization.
About the author