How to Increase User Retention in 2026: What Strategies Are Working Post-AI?


AI has changed how products are built. Now, features ship faster, and even benchmarks for success are changing as well.
Bryan Kim, former Head of Growth at Snap, captures this change. He said a 1% improvement in Day 30 retention was once “an incredible feat.” Today, he considers 10% Day 30 retention the norm and 30% exceptional.
This means measuring retention through login frequency and other traditional engagement metrics is no longer enough. You need strategies built for the AI era, the benchmarks that reflect today’s reality, and a measurement system that tells you which users are actually on the path to long-term retention.
That’s exactly what this article covers. But first…
What did AI change about the retention problem?
Two things:
The first change is shipping speed. AI compressed product development from quarterly releases to continuous delivery. As Yazan Sehwail, CEO of Userpilot, explains:
“As producing and building features become a lot cheaper, instead of every quarter you’re releasing one or two features, now you’re releasing seven, eight, or nine. It becomes even harder for product teams to manually track each one and understand how users engage with it.”
And every new feature introduces another decision for users. In other words, onboarding flows now lead users through a much larger product before they reach their first moment of value. The longer that takes, the more users drop off before reaching their aha moments.
The second change is how products are used. A growing share of product activity now comes from AI agents rather than humans. And they don’t generate the session and page-view signals that traditional retention models depend on.
Together, these shifts make activity a weaker proxy for retention than it once was. In the AI era, the real question is no longer “Are users active?” but “Are users making progress toward value?”

Four strategies to improve user retention in the AI era
If activity is no longer a reliable signal, your retention strategy needs to change too. These four strategies address the problem:
Shorten the path to value, not the setup
The fastest way to improve retention is to help users experience your product’s value sooner. Bryan Kim, former Head of Growth at Snap, calls this the biggest retention lever: “Minimizing the time it takes users to experience the magic of your product… could significantly improve your user retention.”
The simplest way to do that is to separate setup from value. Elena Verna explains the difference in her piece:
-
Setup prepares users to use the product. Think connecting an integration, verifying a domain, or configuring settings.
-
Value happens when users achieve the outcome they signed up for.
Action plan: Audit your onboarding flow. Remove or postpone any setup step that doesn’t directly help users reach their first value moments.
Viggle AI is a good example of that done right. It doesn’t force users to create an account immediately. Instead, it lets you explore the product and try its core (and free) Mix Video feature first. Registration only appears when you are ready to mix your first video.

The same principle applies to existing products. When I reviewed Userpilot’s email setup flow, domain verification created a noticeable drop-off. Rather than redesigning the feature, I added an in-app tooltip and checklist to guide users through the step. The friction point disappeared, and adoption improved within a week.
Treat every new feature as a retention decision
Every new feature, while making your product more useful, also makes it complex for new users. It adds to their cognitive load.
So, delete new features? No!
Instead, create a “feature kill list.” To build that, don’t ask “what should we build next? Ask “what can we hide, remove, or postpone for new users?”
Action plan: do a quarterly onboarding audit. Review the features released over the past six months and compare them against new-user adoption. Does a feature have low adoption? Does it sit between the sign-up and the first value moment? Remove it from the user onboarding experience (or surface it later).
Jiminny, a conversation and revenue intelligence platform, applied this principle. Using Userpilot features, they track total usage and individual user activity to distinguish genuine adoption from power-user skew.
For new feature adoption, I monitor total clicks and also segment them by individual users. I want to see whether there are specific users who are just power users, and that’s causing the fluctuation. — Galya Dimitrova, Head of Product at Jiminny
Jiminny doesn’t stop at discovery or just creating a list. They follow up on less-adopted features, using nudges (like tooltips) to re-engage users.
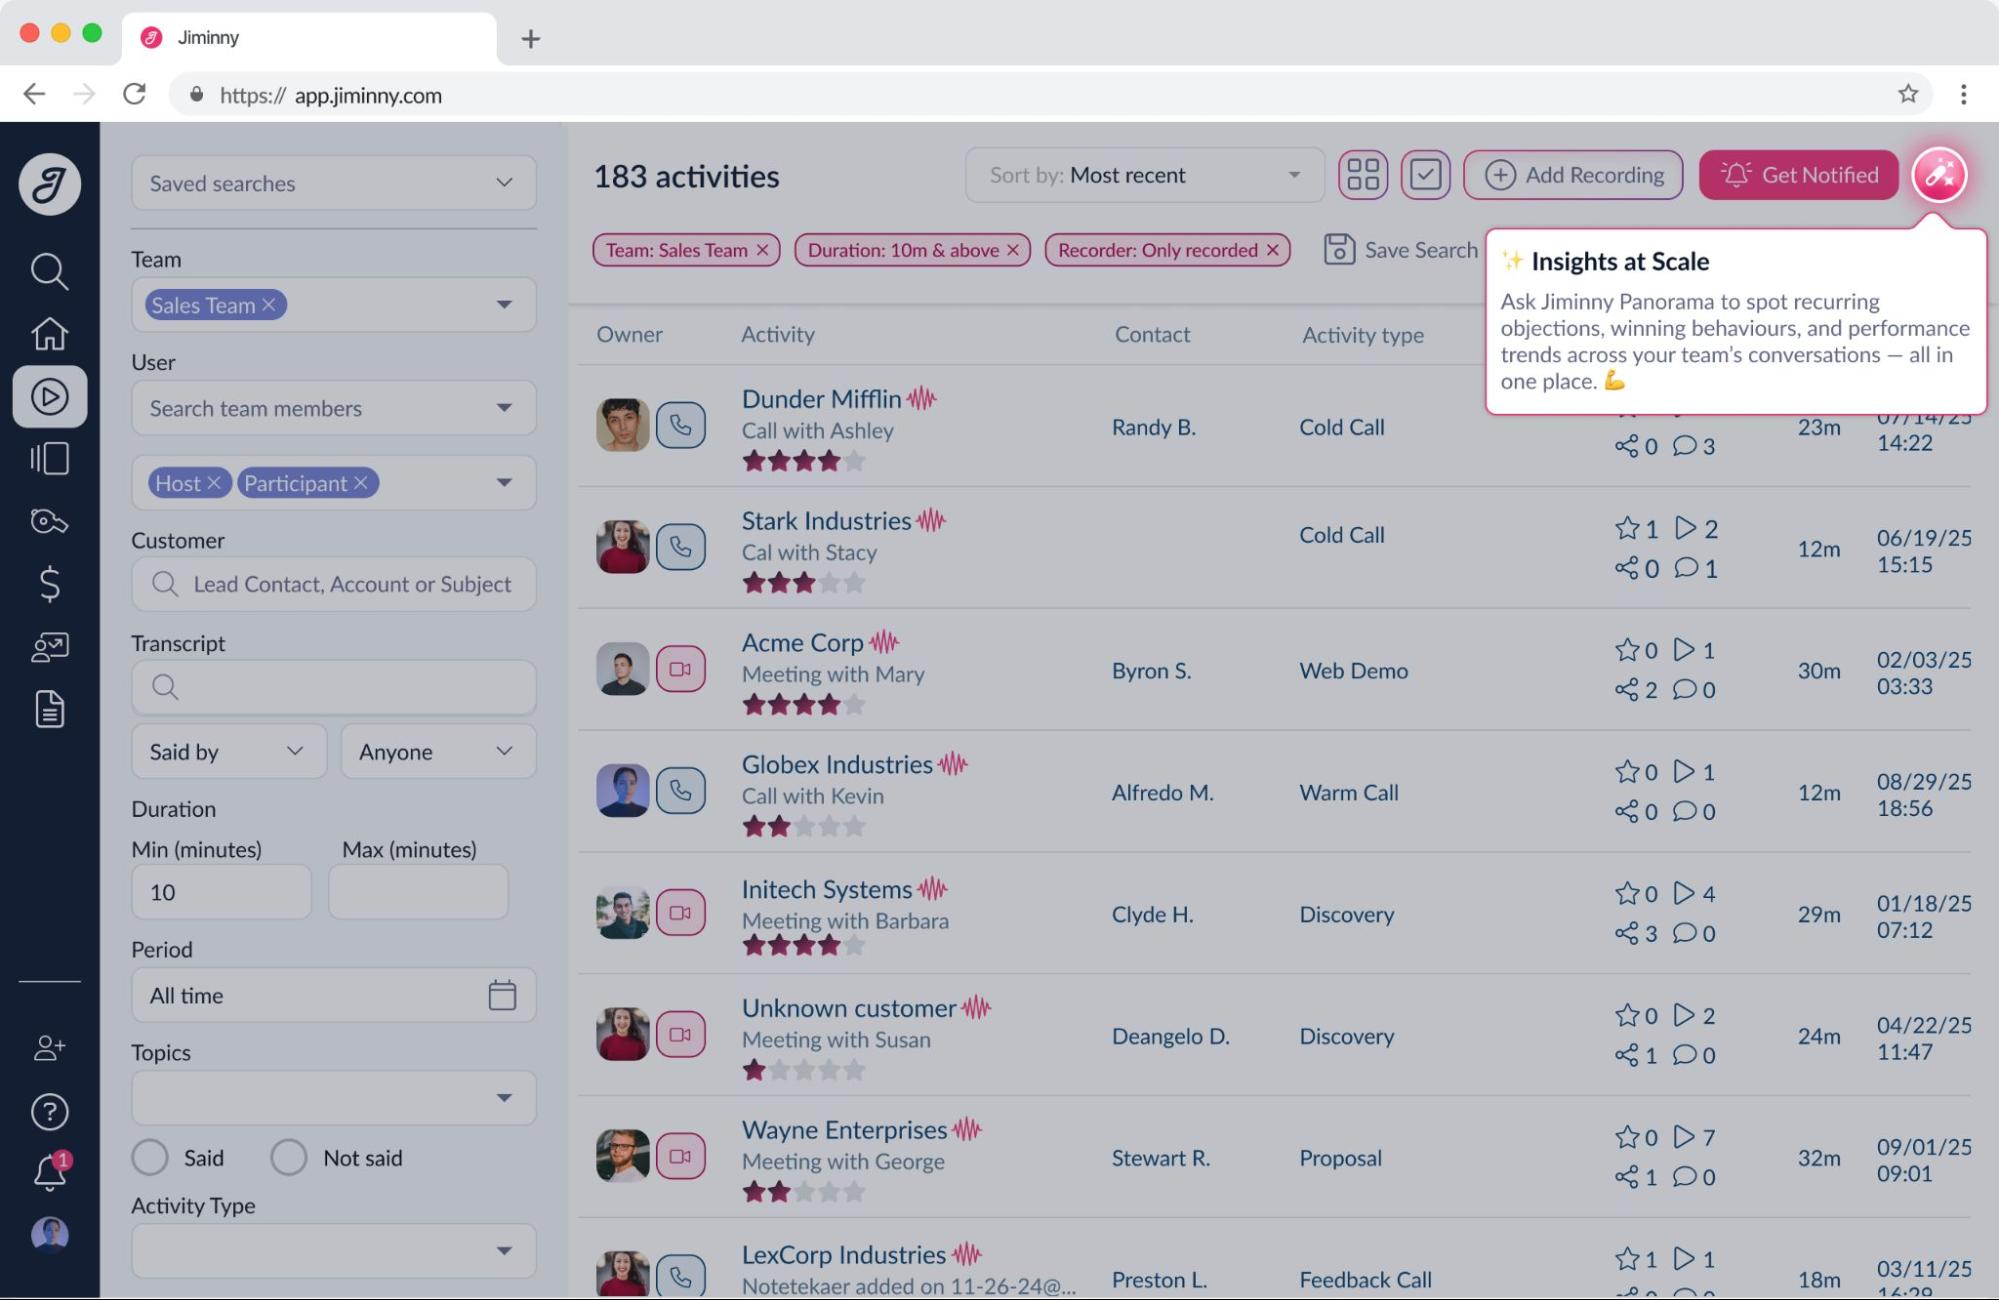
They also use custom onboarding to address different user segments, resulting in 79% renewal rate.
Look for stalled progress, not fewer logins
Declining logins are no longer the most reliable churn signal. In the AI era, users can stay active without making meaningful progress. James Mitchinson, Head of Customer Success at Userpilot, calls this the pattern to watch.
In essence, an account may look healthy on your dashboard. But the customer has stopped getting value. As James puts it:
“…there were still a lot of logins. Lots of activity, but the outcomes weren’t really materializing.”
This is what leads to silent churn, i.e., unhappy customers leaving without complaining. And it happens 25 out of every 26 dissatisfied customers.
James explains it this way:
“If a customer is coming to you and saying they don’t want to continue with the product anymore, it’s already too late. Churn prevention really has to come from earlier intervention where you’re working with a customer when they are still motivated to be successful.”
Action plan: First, identify the product milestones your retained customers consistently reach. This could be publishing a project, sending a campaign, deploying a workflow, or another outcome unique to your product. Then, flag accounts where those milestones stop increasing, even if login activity remains high. Finally, trigger an in-app survey or proactive outreach to understand what’s blocking progress.
Unolo’s case (from 3% month-on-month churn to 1%) shows this strategy in full swing. Using Userpilot, the team triggered in-app surveys during onboarding and after new feature launches to identify dissatisfied users while they were still active. Customer Success could then intervene before those accounts churn.
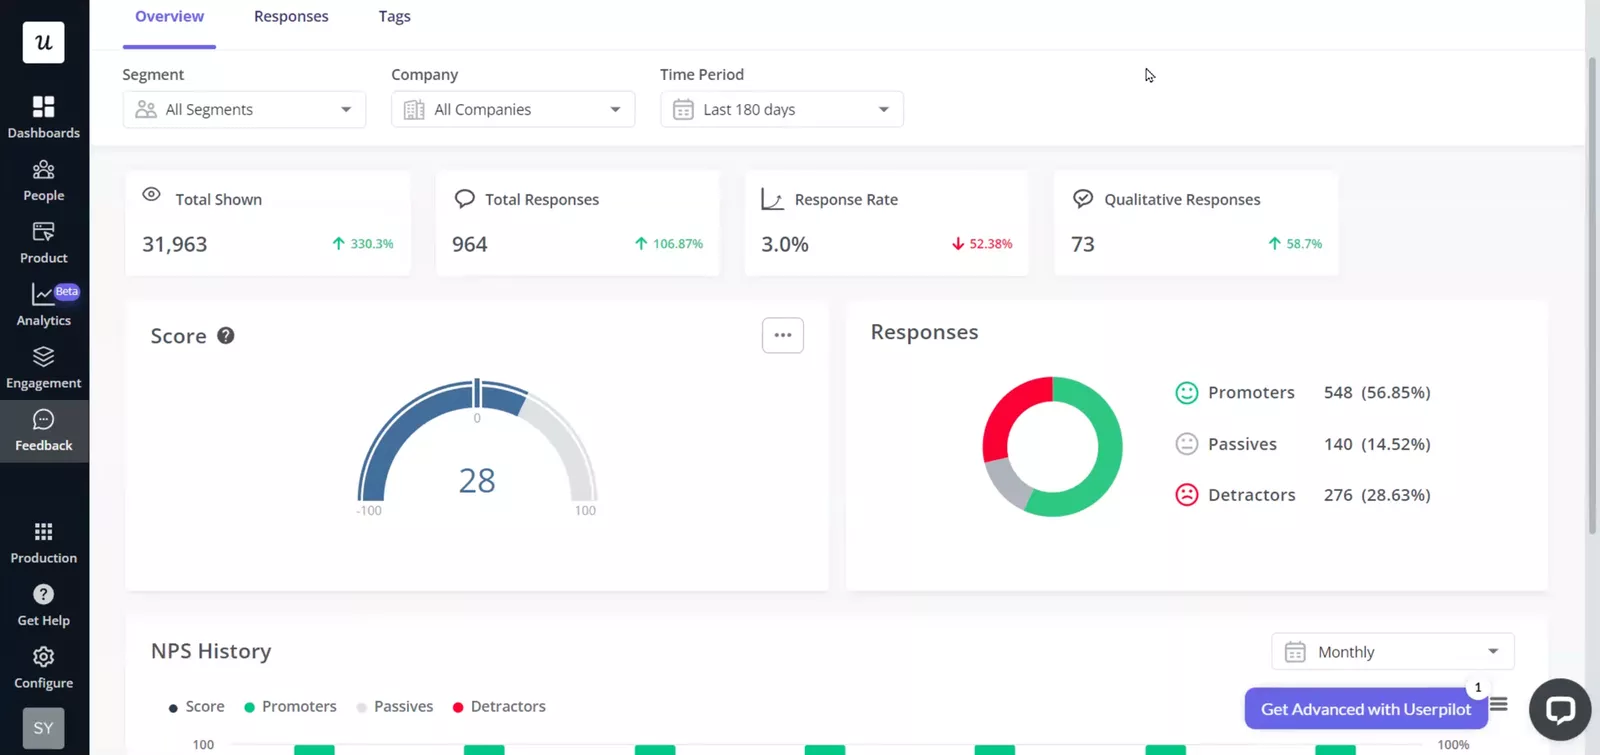
Our average churn rate, month over month, is around 3%. And after we started using NPS, we definitely reduced our churn rate by 0.5 to 1%. — Subhash Yadav, Product Marketer at Unolo
Measure AI agents separately from human users
AI agents are becoming a part of how customers use software, with agentic traffic growing by 131.15% month over month. With such growth, you can’t treat AI agents like human users. Otherwise, you’ll create blind spots in your retention data.
Besides, humans and AI agents behave differently:
-
Humans log in, click through pages, and complete tasks.
-
AI agents execute tasks using protocols such as MCP and don’t generate typical session and page-view data.
When you treat them as one, it’s difficult to tell whether engagement is improving or waning. The solution is to track them separately.
Action plan: Continue user behavior tracking such as logins and feature adoption. Alongside that, measure AI agents using metrics like agent return rate and MCP call success rate. Then, compare the two to identify where retention is actually breaking down.
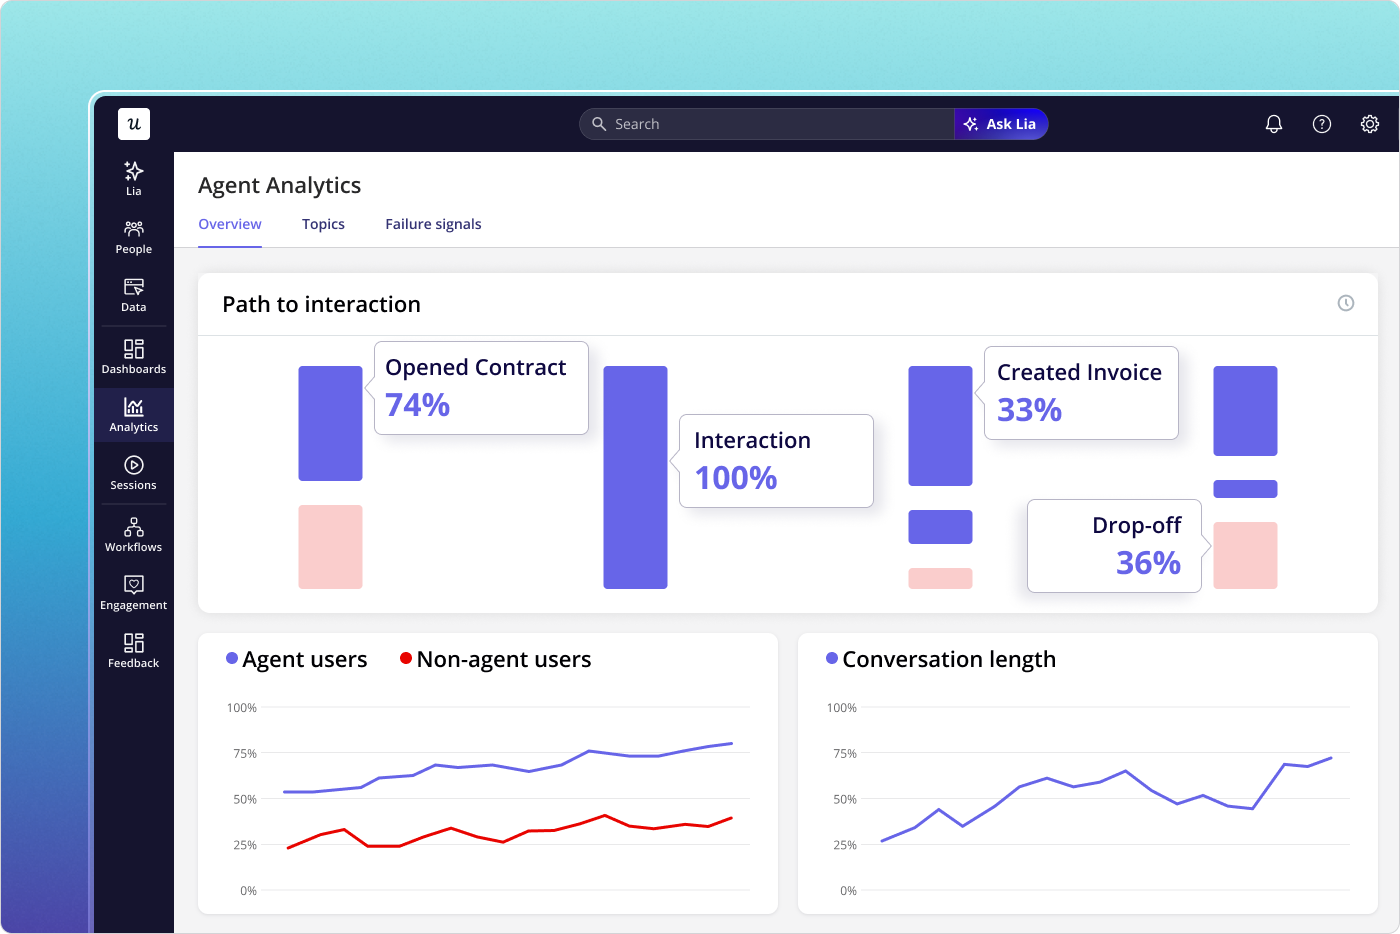
Userpilot’s Agent Analytics helps here. It surfaces agent activity, conversation logs, and failure signals alongside a separate human engagement dashboard. This way, you get a clearer picture of how people and AI agents interact with their product.
Target a retention benchmark or focus on the curve?
I’ve read benchmark reports from UXCam, Mixpanel, and Bryan Kim’s. Despite measuring different products, they all point to the same conclusion:
A good retention curve flattens; it doesn’t continue to decline.
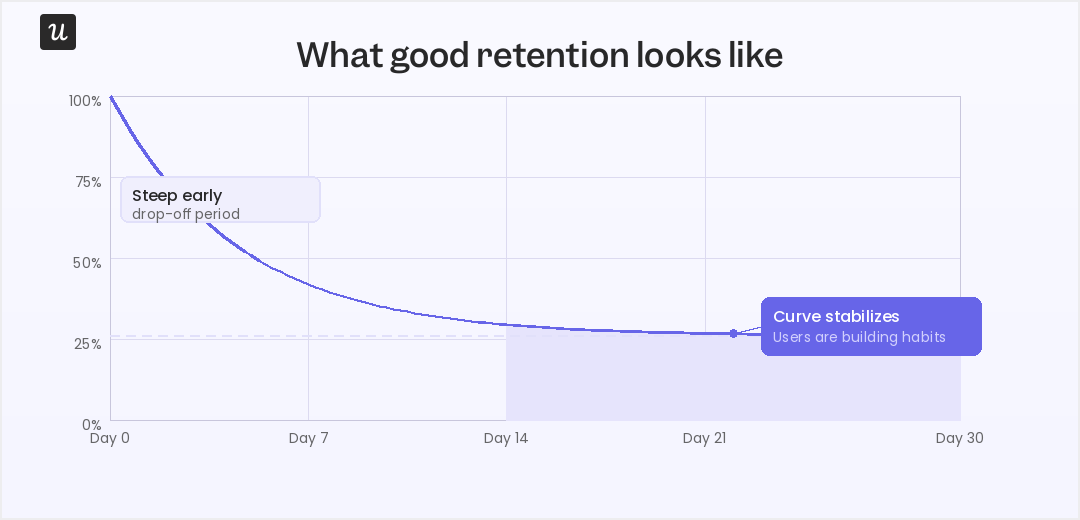
The exact numbers will vary. A consumer app may benchmark Day 30 retention, while a B2B SaaS product is more likely to evaluate Month 3 retention or cohort retention. AI-native products introduce another set of expectations altogether.
However, the underlying principle stays the same. If your retention curve never stabilizes, users aren’t building lasting habits. Fix it.
How do you measure whether your retention strategies are working?
Use this short guide:
| If you’re trying to… | Measure… | Success looks like… |
|---|---|---|
| Get users to value faster | Activation rate and time-to-value | More users reach their first value milestone, and they reach it sooner. |
| Reduce feature complexity | Cohort retention | Newer cohorts retain better than older ones after product changes. |
| Prevent silent churn | Outcome signals | More users continue completing the behaviors that predict long-term retention. |
| Support AI and human users | Separate human and agent engagement | You can identify retention issues without mixing human and AI activity. |
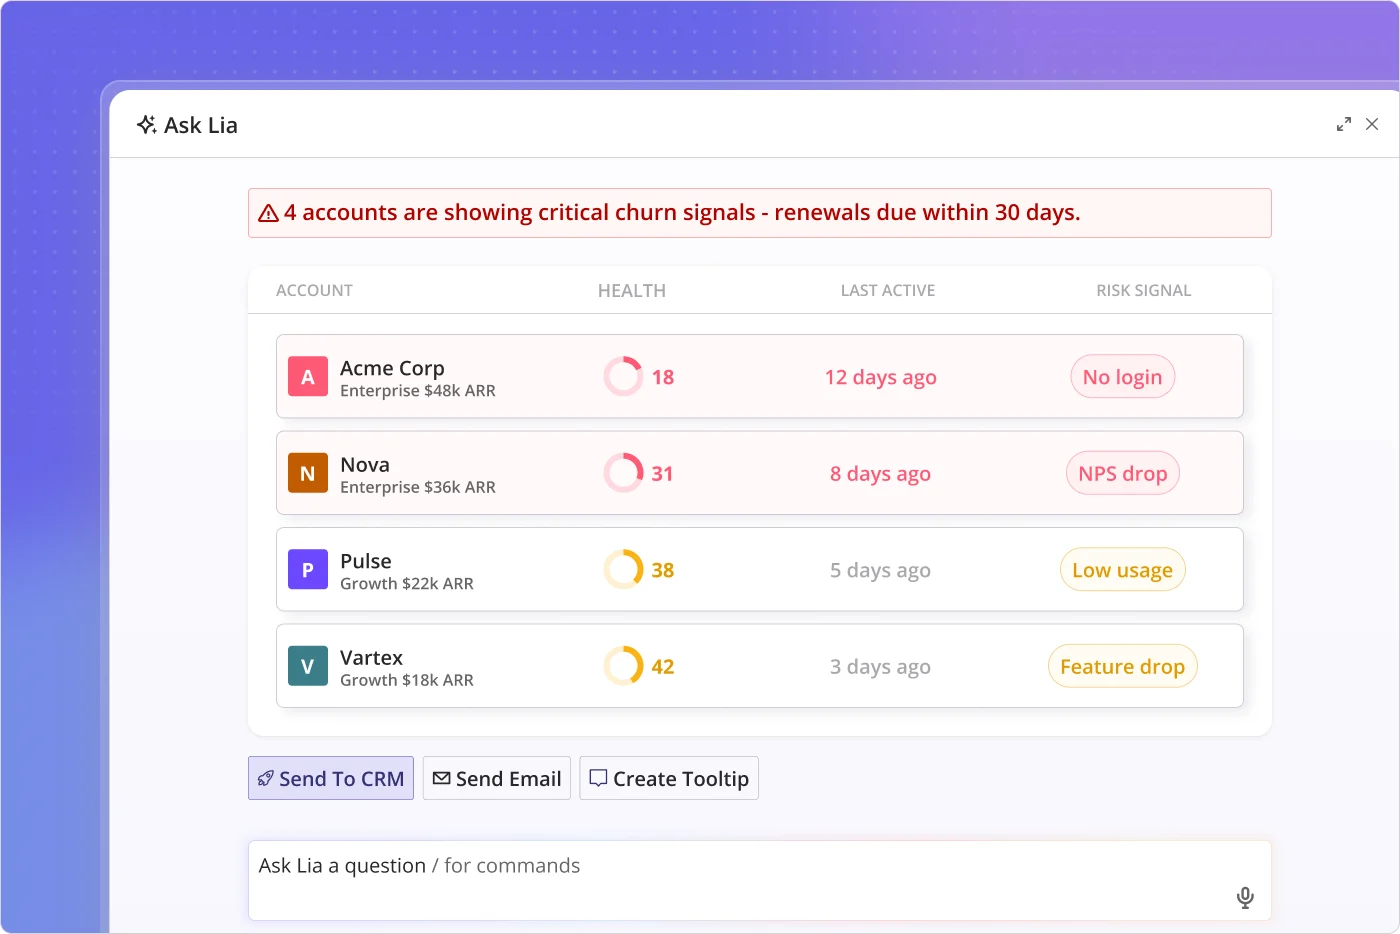
You will need different dashboards to measure each of these goals. Or you can use Userpilot’s AI agent, Lia, to automate the process. It tracks cohorts, identifies the behaviors that predict retention, monitors outcome signals, and separates human and agent engagement into a single view.
Build your retention system before users disappear
The teams that retain customers in the AI era do three things: they reduce time-to-value, they detect when progress stalls, and they intervene before churn happens. The four strategies in this guide work together toward that aim. They:
- Shorten the path to value.
- Keep onboarding focused, even as your product grows.
- Measure customer progress instead of activity.
- Separate AI agent behavior from human behavior.
Combined, these give you a much clearer picture of why users stay or leave. And Userpilot brings it all into one platform, from cohort and funnel analytics to behavioral signals, AI-powered churn detection, Agent Analytics, and Lia.
Book a demo today to see how Userpilot maps to your specific retention challenge.
FAQ
What is customer retention?
Customer retention is how a business keeps existing customers for a specific period. It measures how many customers continue using your product or service rather than churning to competitors. Retention is typically expressed as a percentage and calculated by dividing the number of users at the end of a period (minus new customers acquired) by the number at the start.
How to increase customer retention?
Increase customer retention by:
- Reducing time to value through contextual onboarding.
- Using behavioral segmentation to personalize customer experiences.
- Closing user feedback loops to address user concerns quickly.
- Implementing self-service resources to reduce user friction.
- Creating habit loops through strategic gamification.
- Re-engaging dormant users with value-based messaging.
What are the three R's of customer retention?
The three R’s of customer retention are:
- Retention: Keeping customers engaged.
- Revenue: Increasing customer lifetime value through upsells and renewals.
- Referrals: Turning satisfied customers into advocates who attract new customers.
What are the 8 C's of customer retention?
The 8 C’s of customer retention are:
- Customer understanding: Knowing your users’ goals, pain points, and behavior patterns deeply.
- Communication: Staying connected with users across multiple channels like email, in-app, and support.
- Convenience: Reducing friction by making it easy for users to accomplish their goals.
- Consistency: Delivering reliable experiences that exceed customer expectations.
- Customization: Personalizing journeys based on user behavior, role, and preferences.
- Community: Building strong customer communities to foster connections between users.
- Customer service: Providing exceptional support that resolves issues quickly and effectively.
- Commitment: Investing in long-term relationships rather than short-term transactions.
How can retention be improved?
You can improve customer retention by tracking key metrics, such as cohort analysis and churn rate, to identify drop-off points. Then, implement targeted strategies like:
- Streamlining onboarding for new users.
- Gathering customer feedback to fix friction.
- Segmenting users by behavior for personalized customer experiences.
- Providing in-app resources for self-service support.
- Measuring each change to optimize what works.
About the author