Userpilot NPS Feature: Use Cases, and Best Practices


Most NPS surveys end the moment someone clicks Submit. A score appears in the dashboard, the monthly report gets updated, and the responses slowly disappear into a spreadsheet. I’ve seen teams spend more time discussing whether their NPS moved three points than reading the comments customers took the time to write.
That’s a missed opportunity. A score doesn’t explain why customers feel the way they do, which users are running into the same problem, or whether the issue comes from onboarding, missing functionality, support, or something else entirely. Those answers come from the feedback itself and the product experience behind it.
Userpilot brings those pieces together. You can build and target in-app NPS surveys, review responses alongside product behavior, and follow up while the feedback is still fresh. The rest of this article follows that process from the first survey to the next product change.

What an NPS score tells you (and what it doesn’t)
Start with what the number measures. NPS measures customer loyalty and likelihood to recommend your product. It is a lagging signal rather than a leading KPI, and it should not be treated as a customer satisfaction metric.
The math is simple to calculate. : You subtract the percentage of detractors from the percentage of promoters and multiply by 100 (or let an NPS calculator do it), which puts every result on a scale from -100 to +100. Promoters rate you 9 or 10, passives sit at 7 or 8, and detractors land anywhere from 0 to 6.
Here is the problem a bare score cannot solve: it never tells you why anyone picked their number. On its own, that makes NPS a vanity metric. It turns into something you can act on the moment you pair it with a qualitative follow-up and the behavioral data behind the response.
I treat NPS as a symptom to investigate. And before you can analyze feedback, you have to collect customer feedback worth analyzing, which starts with asking the right users the right question at the right time.
Collect: Build, target, and time the survey
This is the longest part of the workflow, because data quality is decided here and not in analysis. Get the collection wrong, and no amount of clever tagging will save the responses.
Build the survey
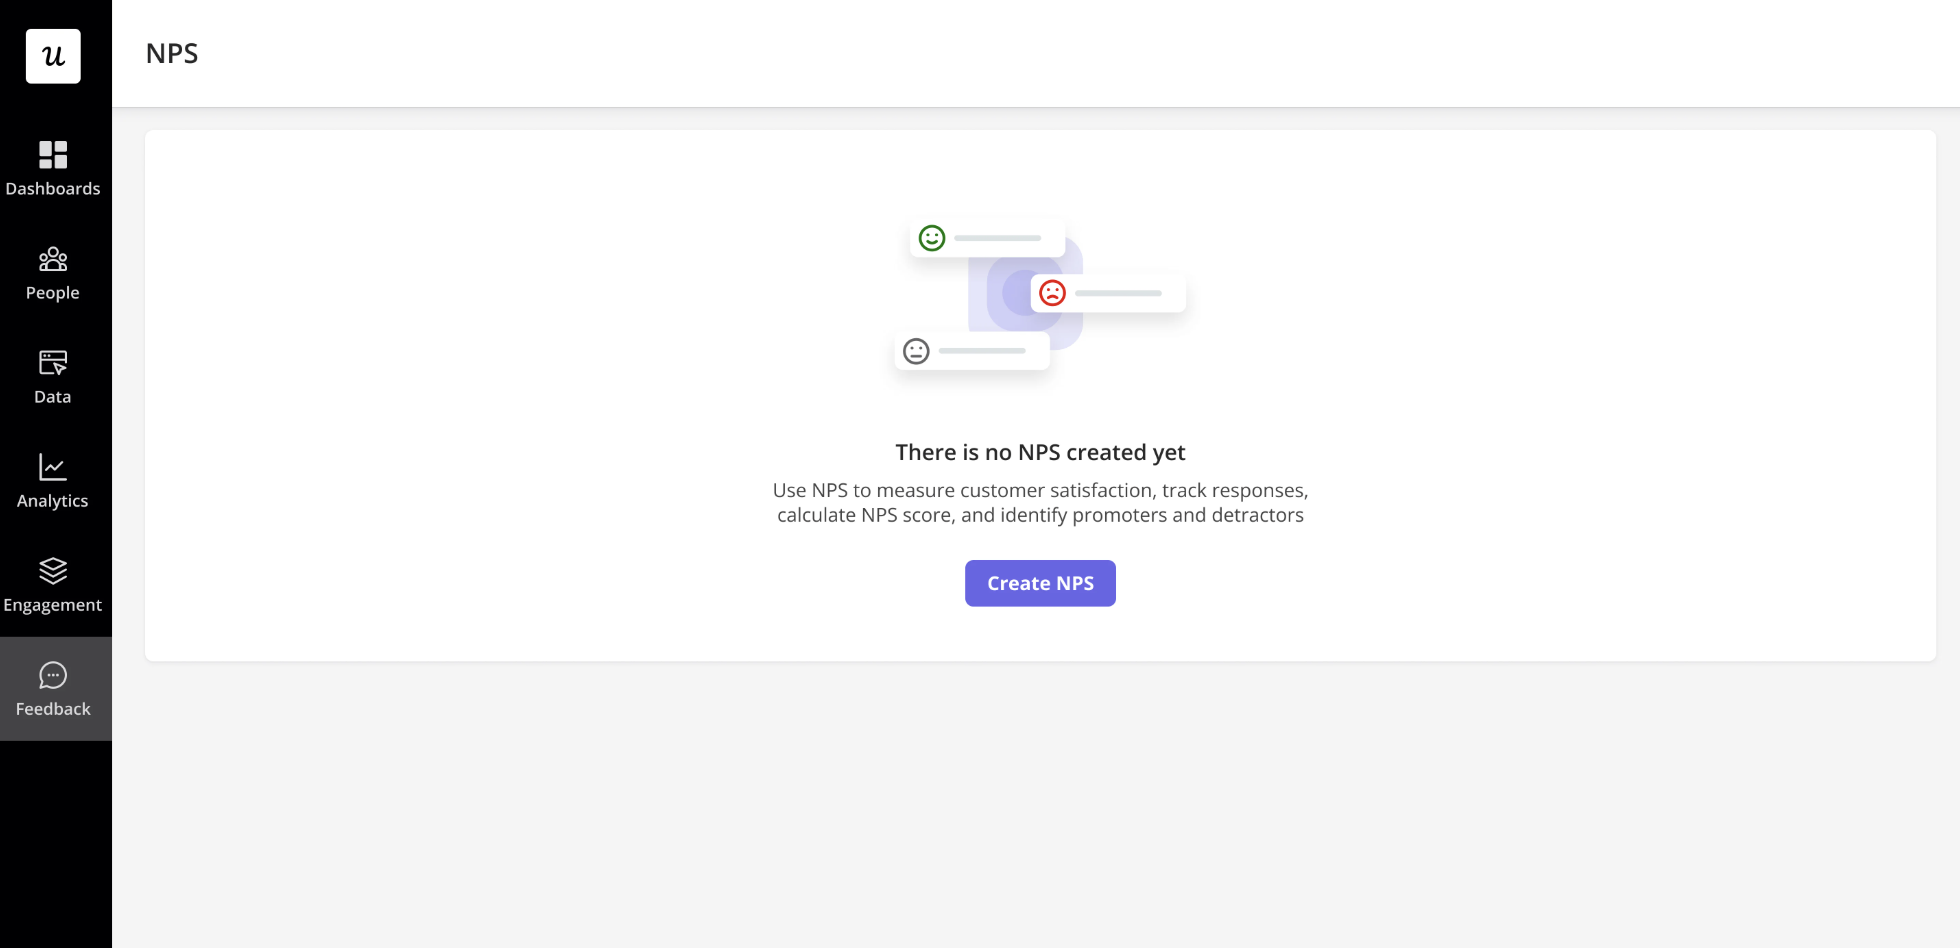
You start in Userpilot under Feedback > NPS > Create NPS. The default question follows the industry standard for good survey questions, “How likely is it that you would recommend [Company] to a friend or colleague?”, and you can personalize it with dynamic variables like the user’s name or company.
The setting that matters most for a workflow, and the one older guides skip, is the follow-up question. You can make it Universal, a single question regardless of score, or Score-Based, a different question for detractors, passives, and promoters. I keep the follow-up open-ended, because that free text is the qualitative material the rest of the loop runs on.
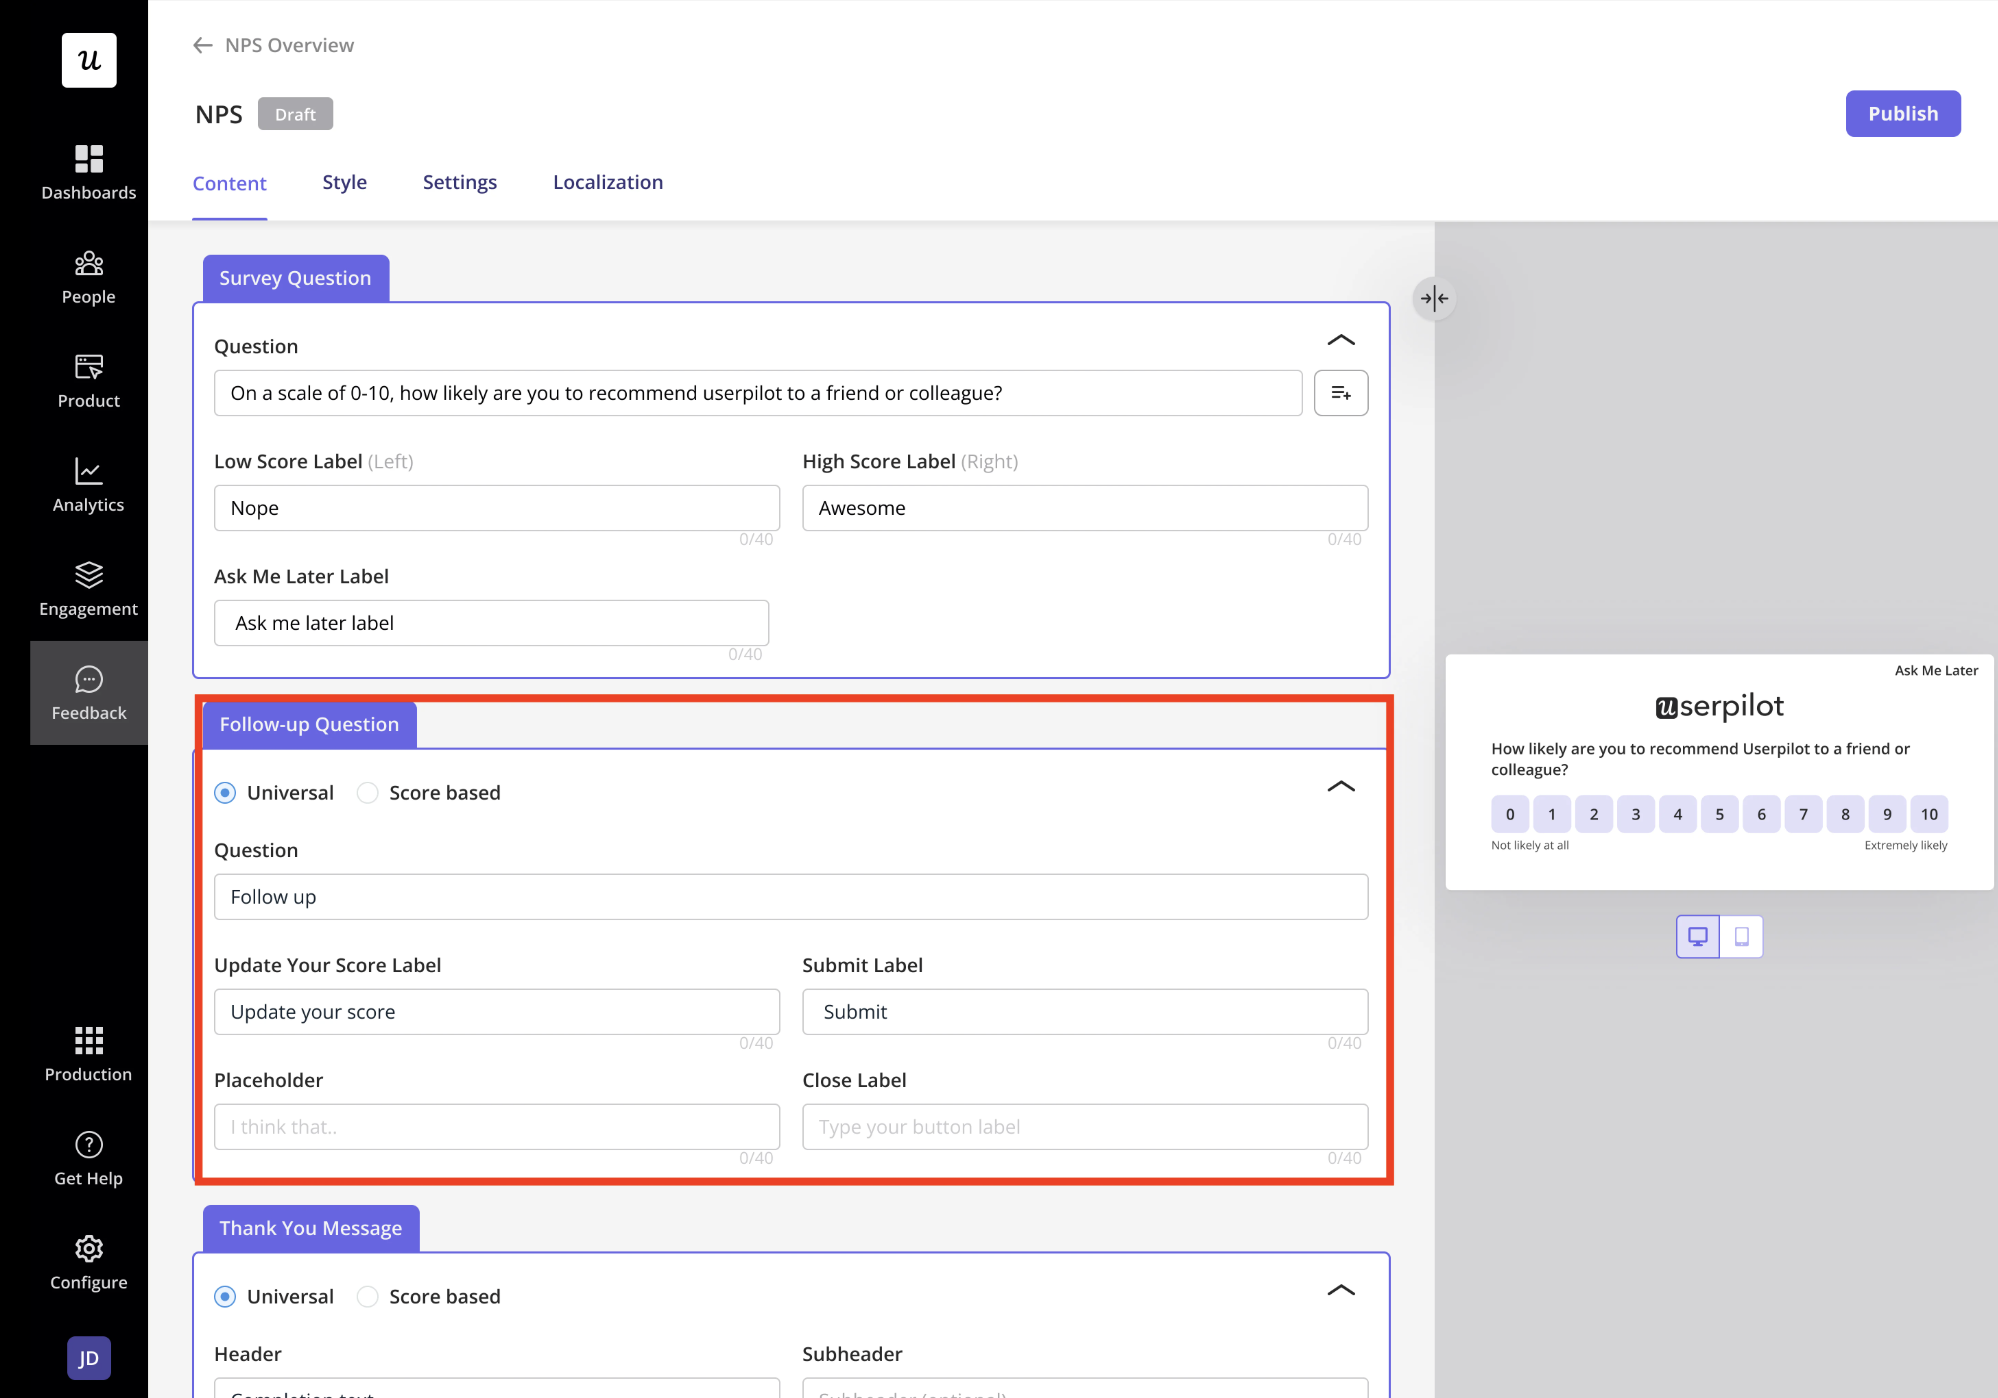
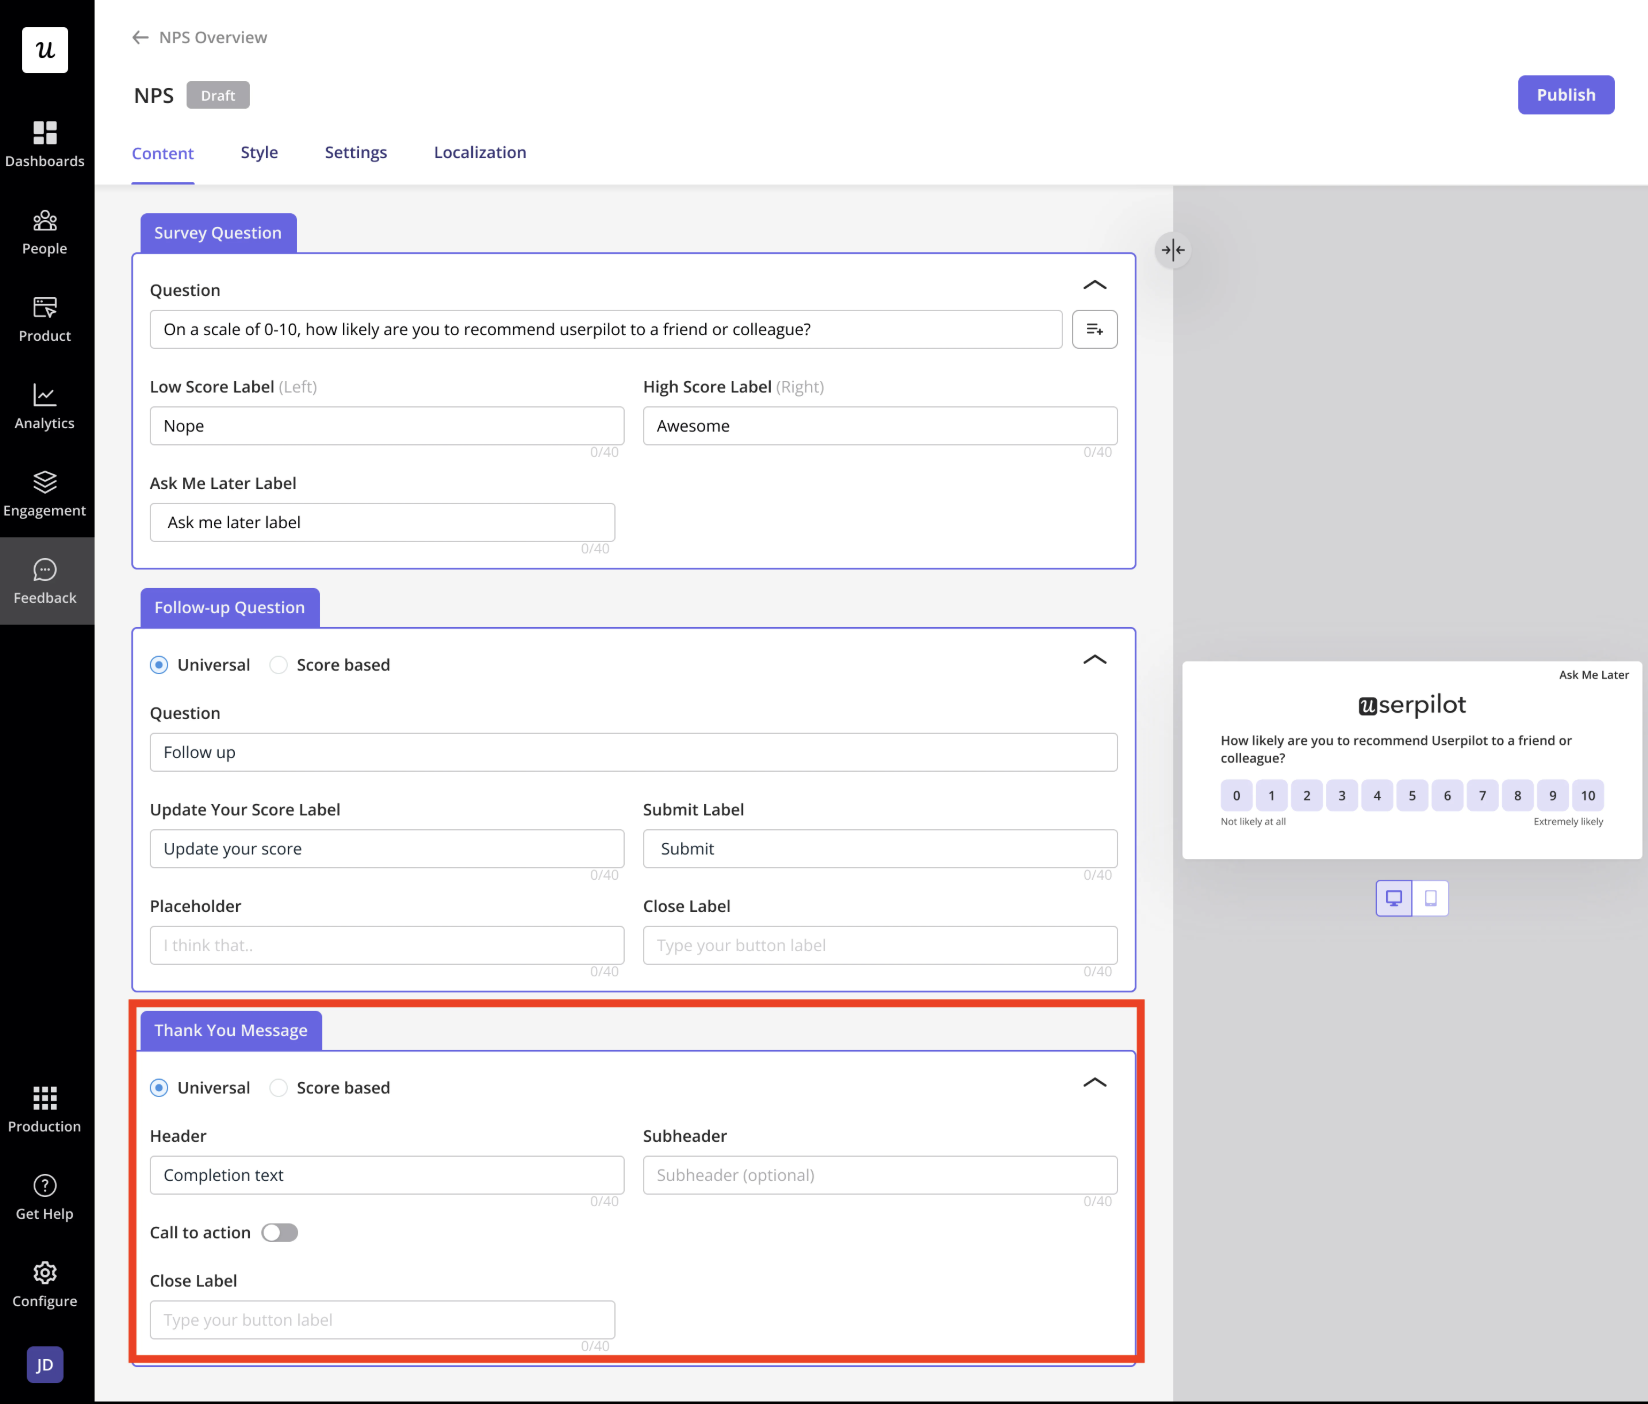
You can also set a custom thank-you message, made score-based if you want detractors and promoters to hear something different. Styling covers colors, logo, fonts, border, and a progress bar, which is worth a minute of attention and not much more.
Target the right audience
Targeting lives in the Settings tab. You pick the Platform first, either web app or mobile app, and running NPS on Userpilot mobile is newer than most write-ups acknowledge. Then you set the Environment to production or staging, so you can test safely before anything reaches a real user.
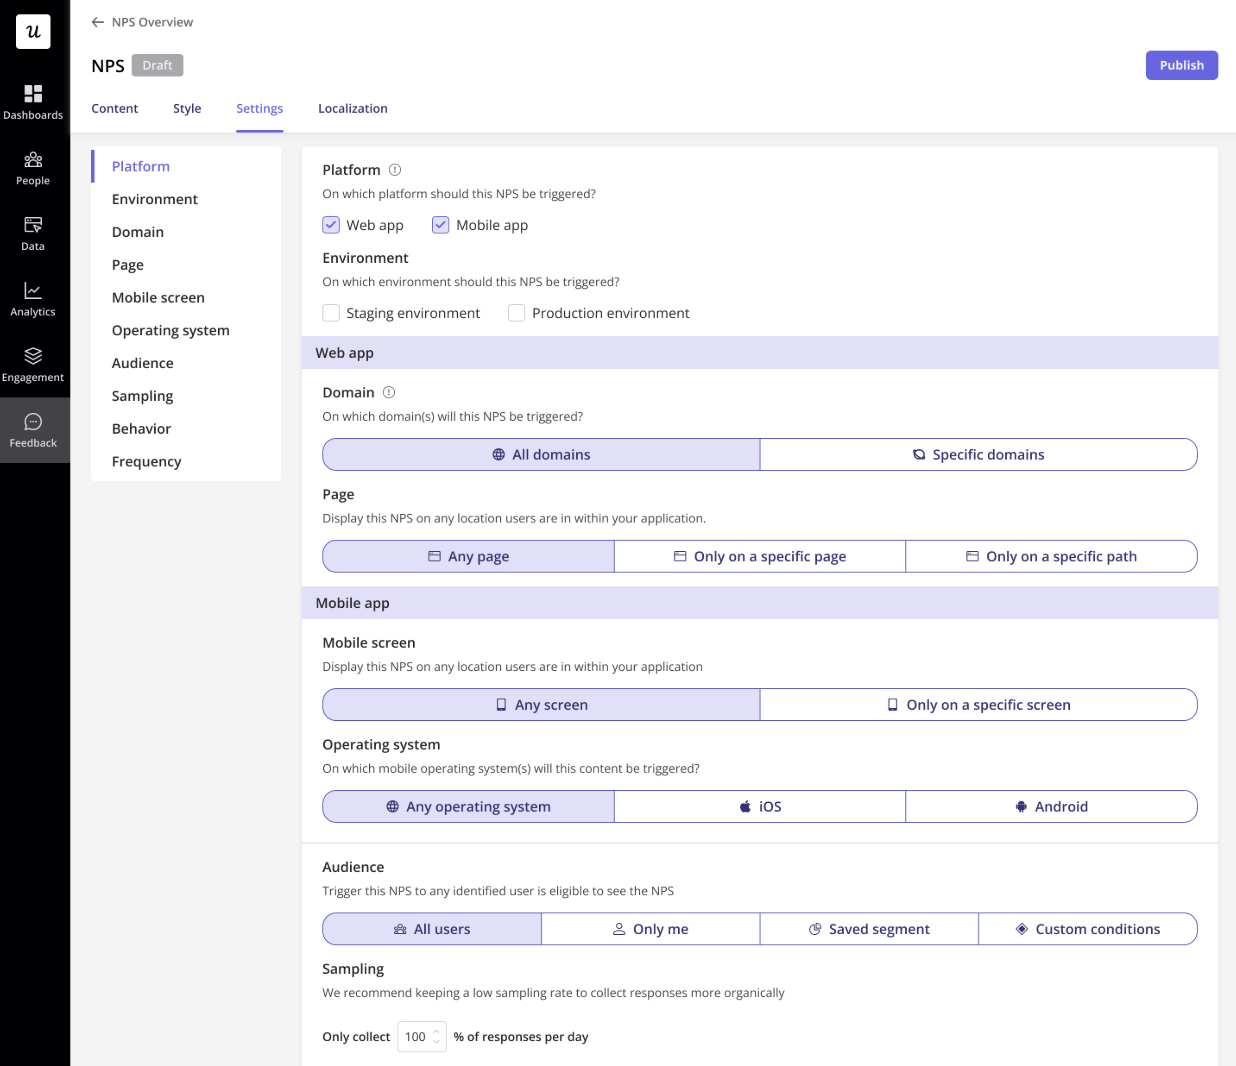
From there, you narrow by domain and page, then choose an audience: Only Me (for testing), a Saved Segment, or Custom Conditions based on user attributes, company data, or product usage. Who you ask decides whether the data means anything. A user who signed up yesterday produces noise, not signal.
Time it so the answer is real
Two controls decide when a user sees the survey. Behavioral triggers fire on the number of page visits or time spent on a page, and the sampling rate sets how many eligible users get asked on a given day. Timing is the difference between signal and noise.
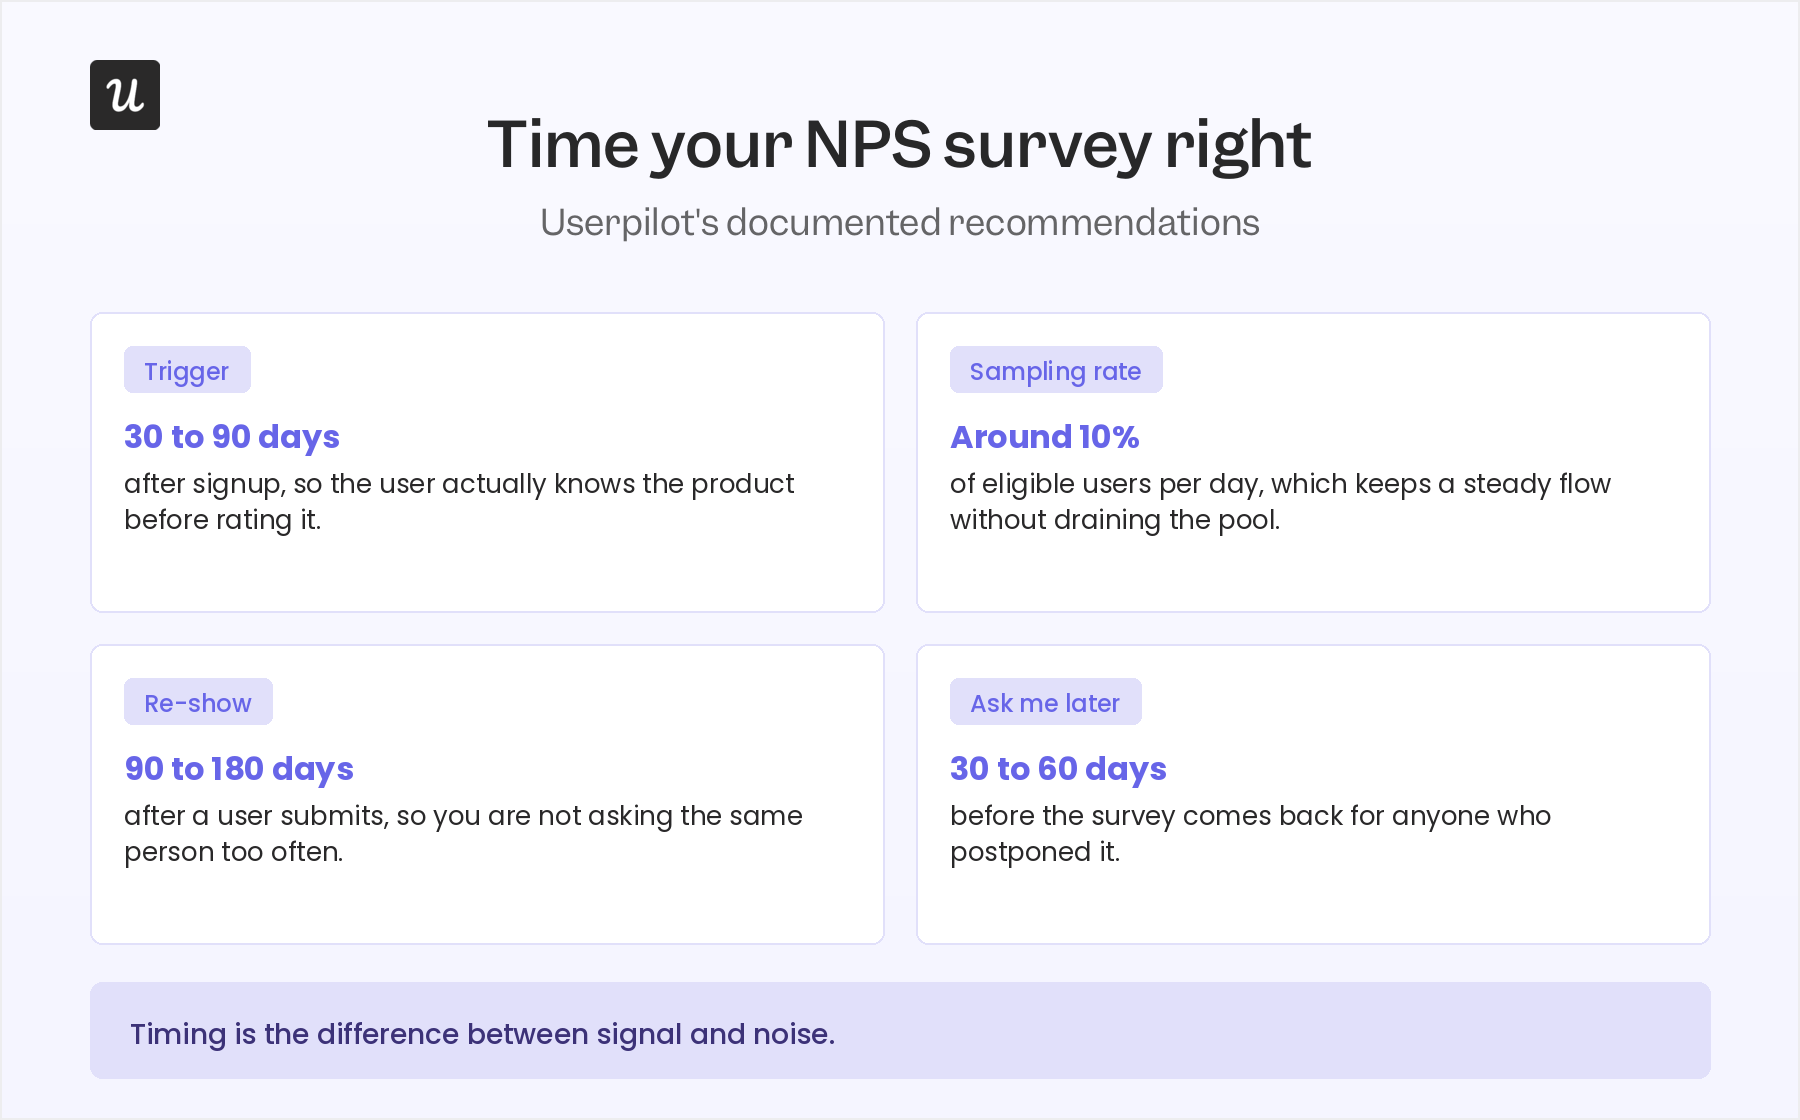
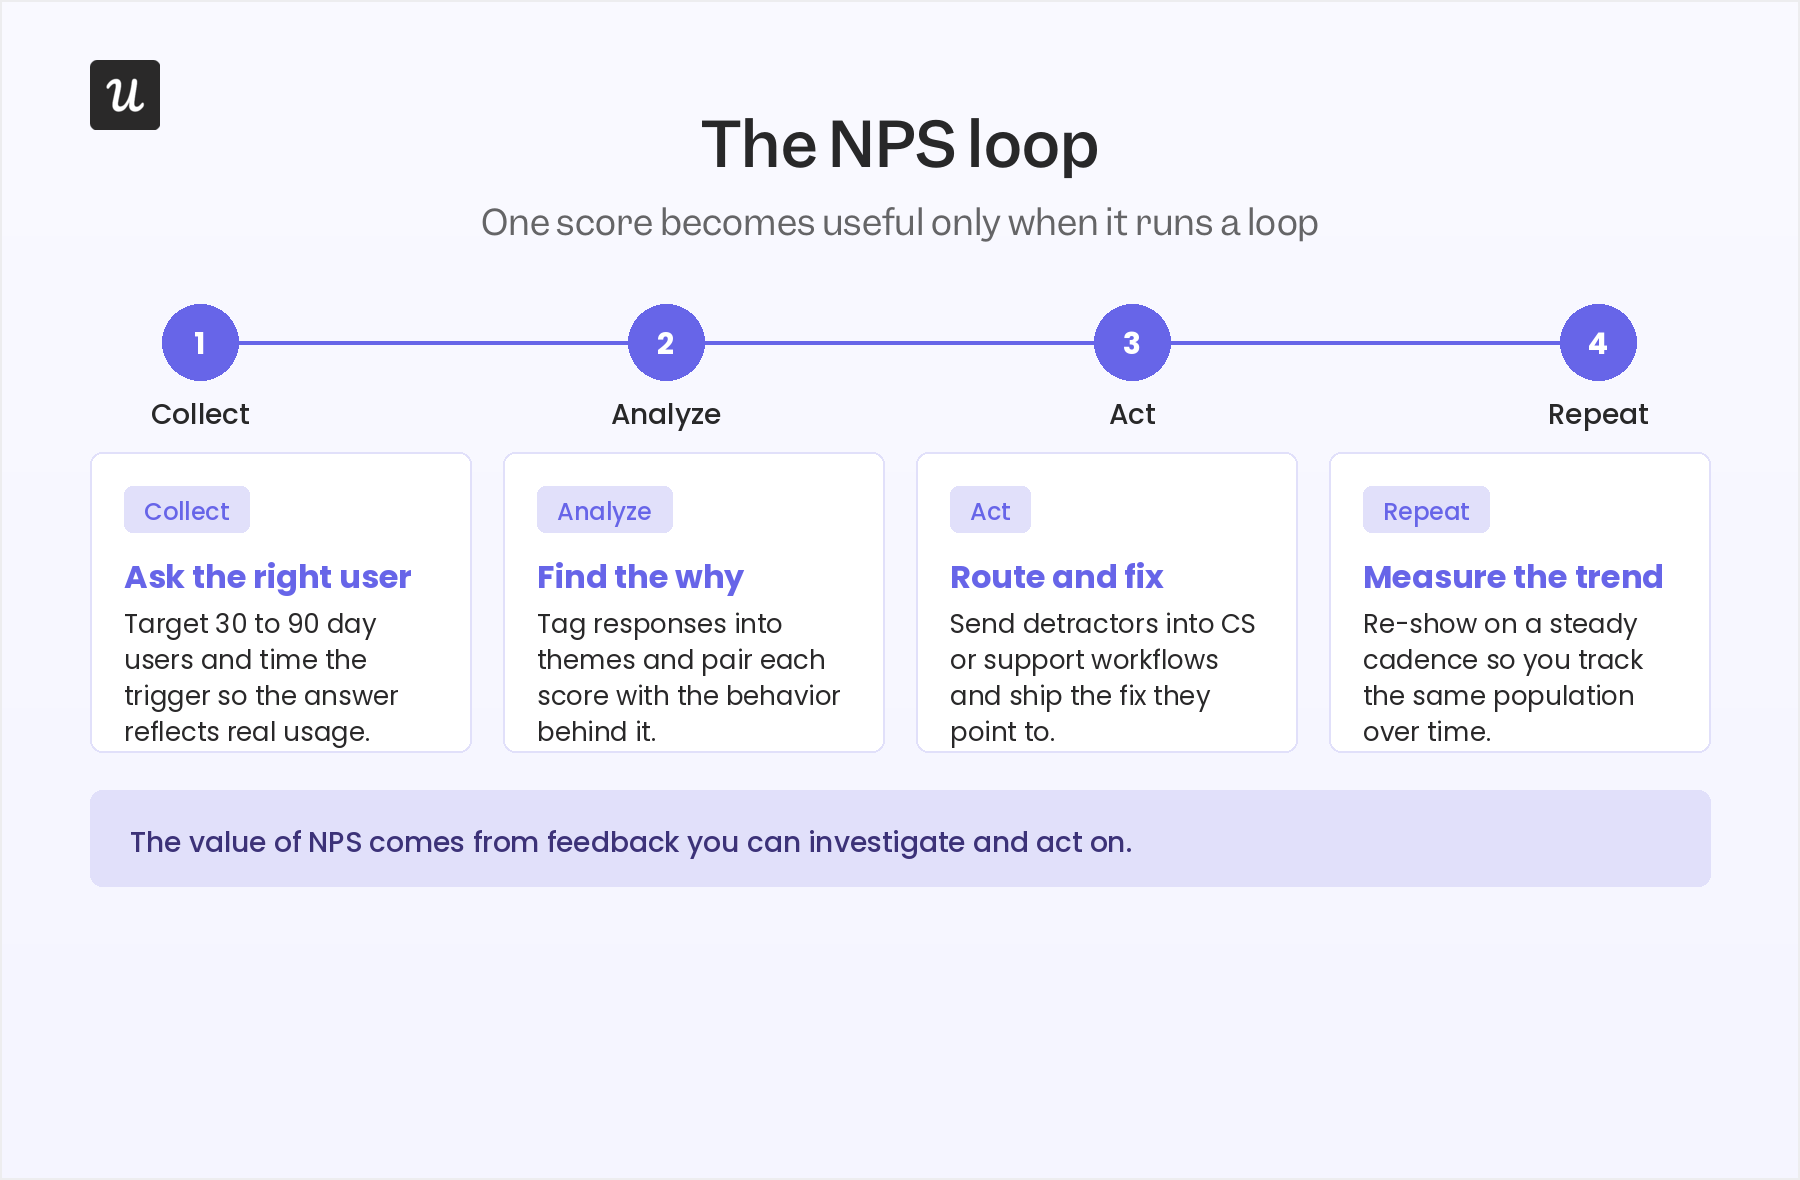
Userpilot’s own documented NPS recommendations make this concrete: trigger the survey for users who signed up 30 to 90 days ago, use roughly a 10% sampling rate, re-show the survey 60 to 90 days after a completed response, and wait 3 to 7 days after someone clicks “Ask me later.” Those recommendations help you collect consistent feedback without overwhelming users.
The failure mode is easy to picture. You get asked to rate a product you have used for twenty minutes, and your answer measures your mood rather than the product. That is exactly the response you do not want in your data set.
I have come to treat every one of these settings as an experiment rather than a fixed answer. Every suggestion you gather, whether from feedback, from AI, or from a teammate, is a hypothesis you try out, and the product is all about experiments. So I set a trigger and a sampling rate as my best guess about who is ready to answer, then adjust both as the responses come back.
As a small aside, NPS surveys support localization through a locale_code property following the ISO 639-1 standard, or the user’s browser language when no locale is passed. If you run in more than one market, it is worth setting once and forgetting.
Analyze: turn responses into themes and root causes
Read the dashboard
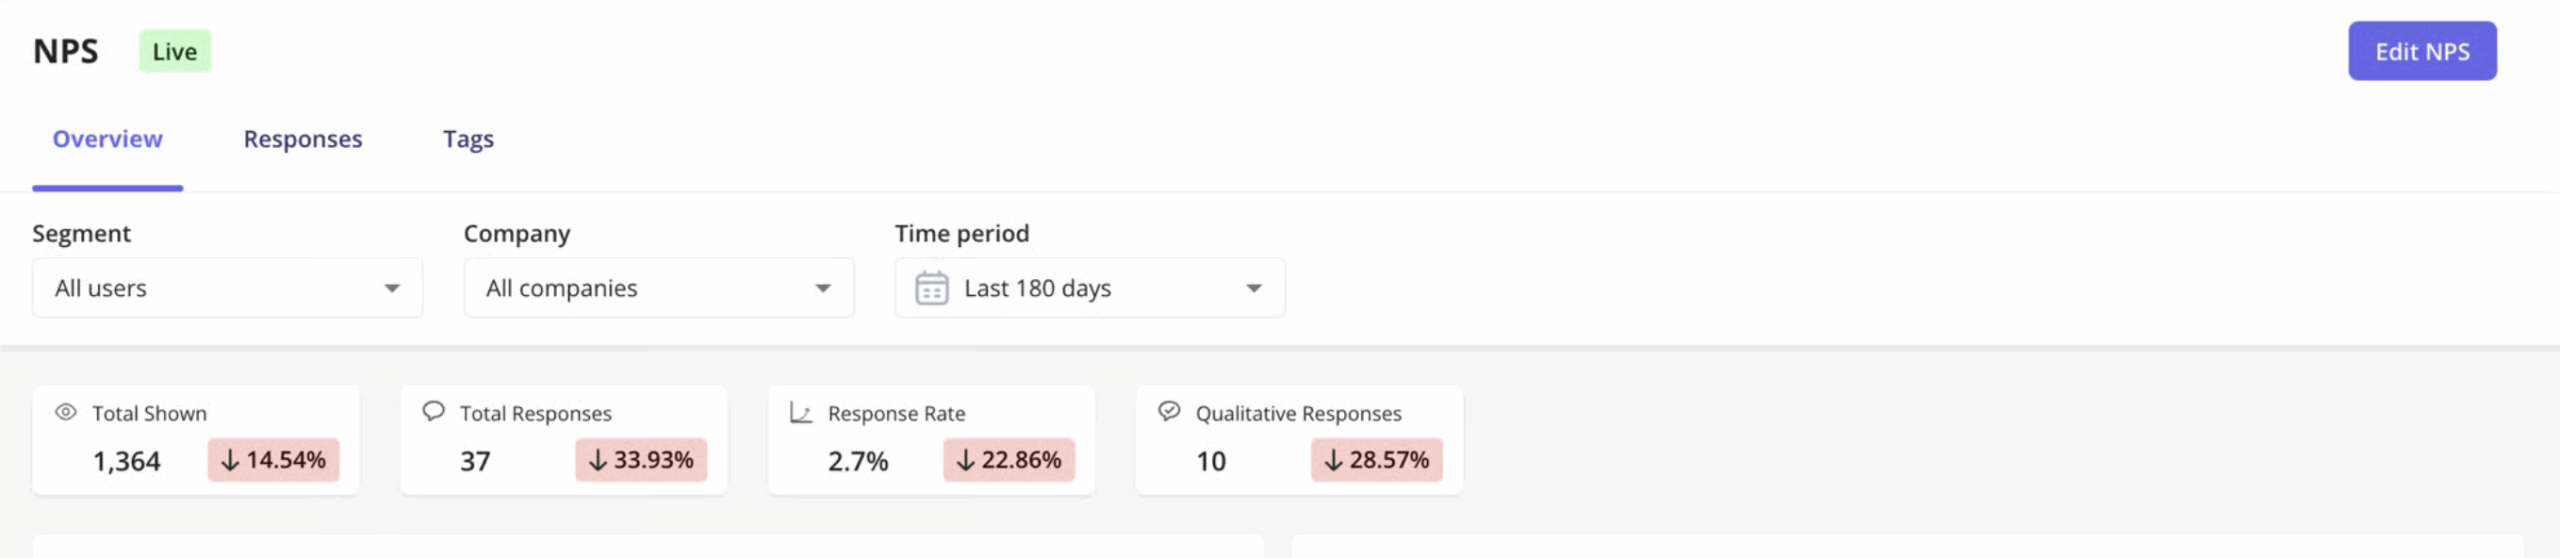
Responses land on the NPS page with the metrics that carry weight: Total Shown, Total Responses, Response Rate, and Qualitative Responses.
One metric worth paying attention to is the response rate. While it varies by product and audience, many customer feedback benchmarks consider 20% or higher a healthy response rate for NPS surveys. If your response rate is consistently lower, it’s often a sign to revisit your survey timing, targeting, or frequency before drawing conclusions from the score.
An NPS History Chart tracks the score over time, so you can hold the period before a product change against the period after it.
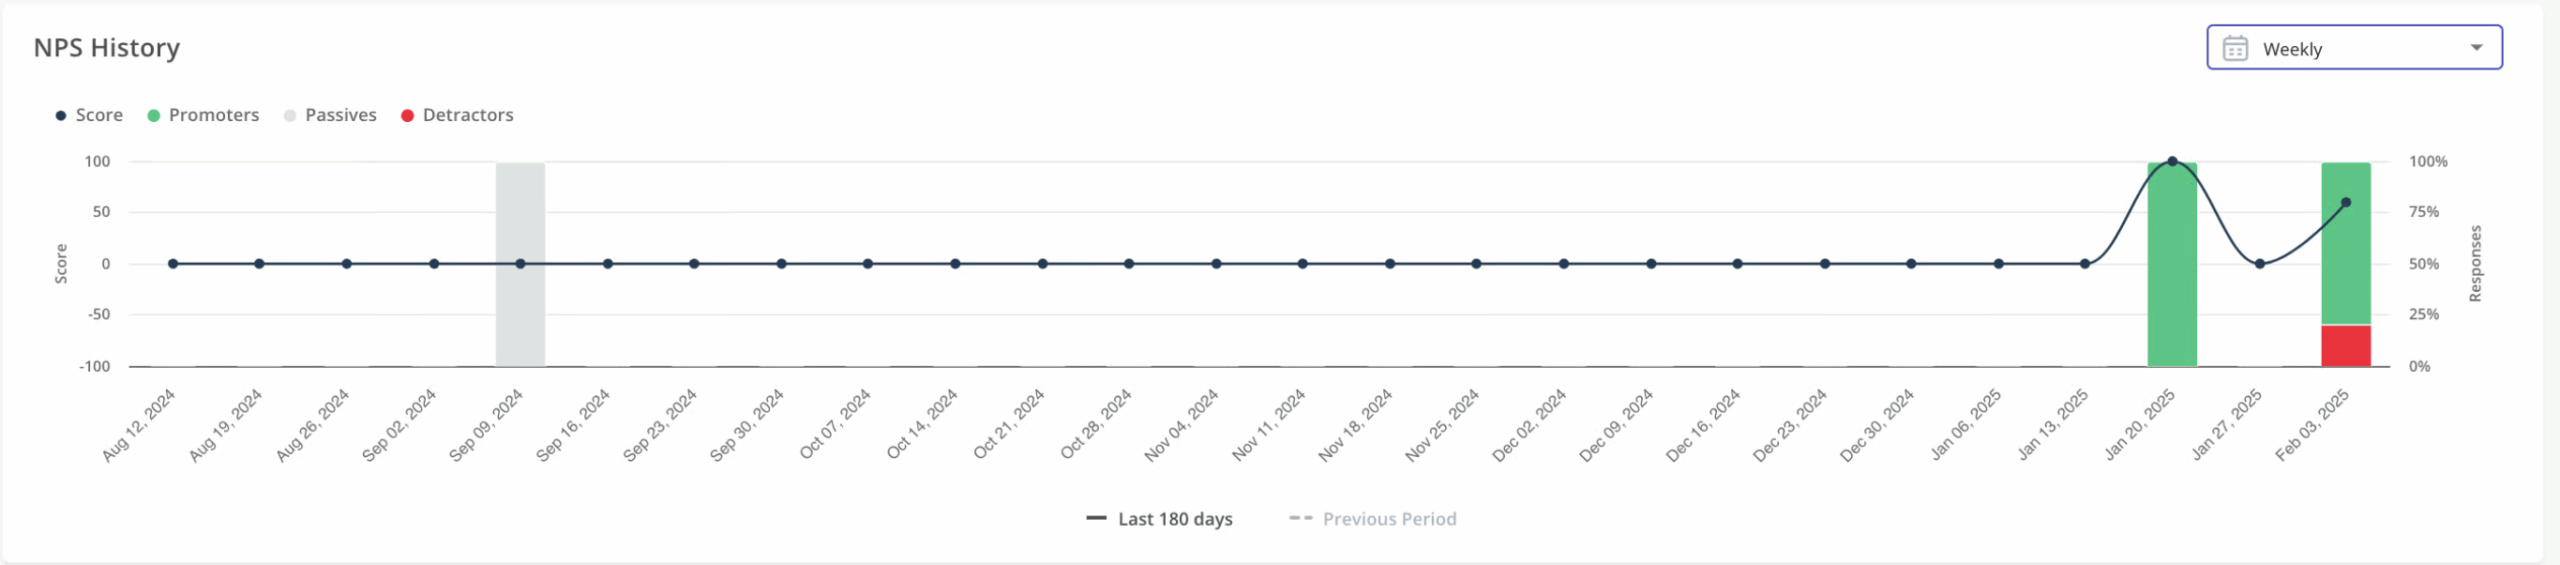
You can filter all of it by Segment, Company, Time Period, or Platform. That filtering is what turns one blended number into something you can reason about.
Tag responses into themes
Open the Responses tab and add tags to the qualitative answers, the start of real feedback analysis, which lets you cluster free text into buckets like pricing or bugs. You create a new tag right there with the + Add a tag option, then apply it as you read through responses.
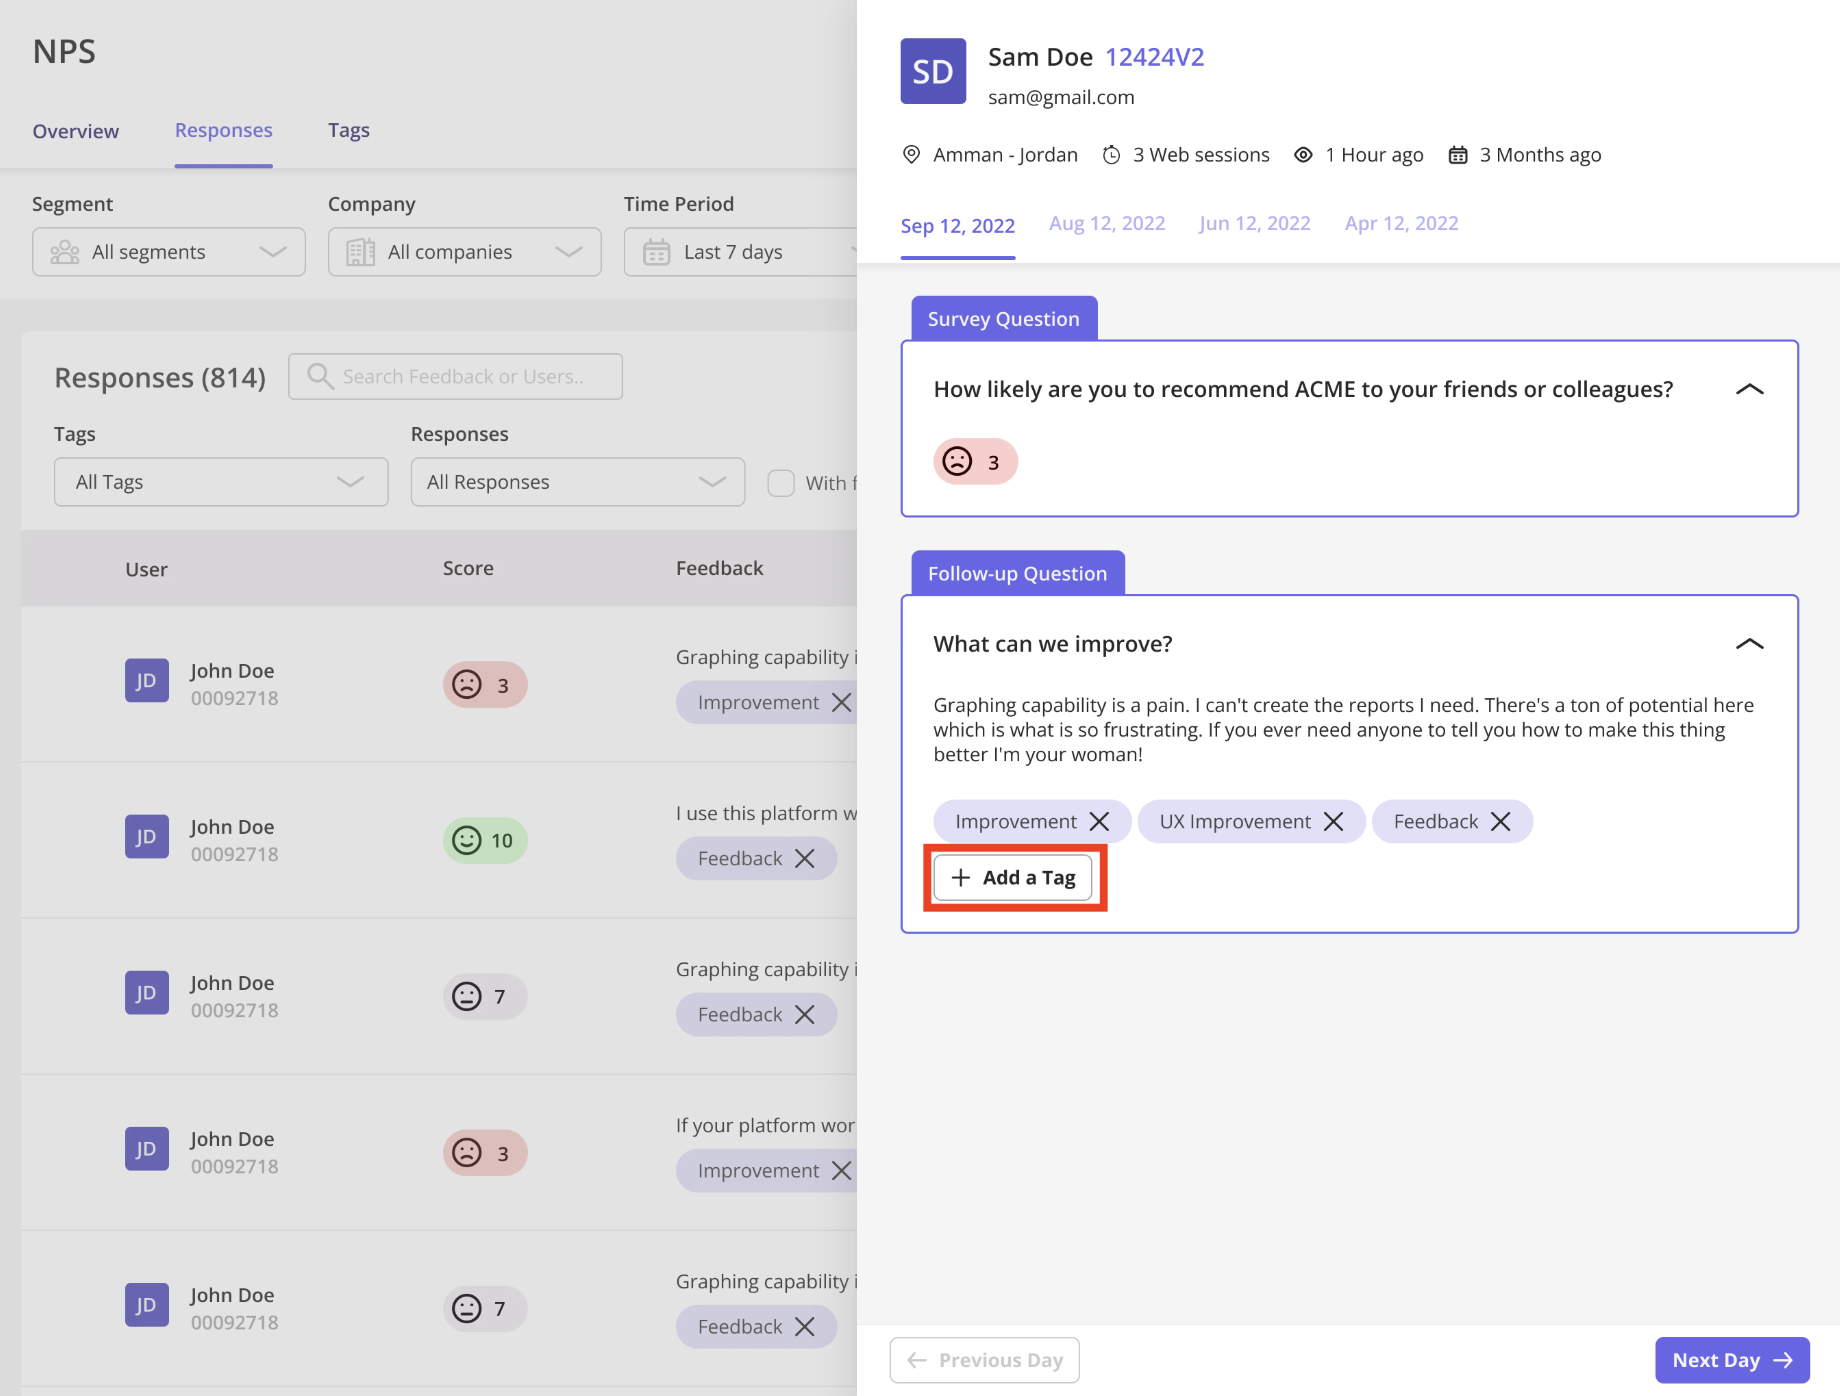
Each tag carries its own score breakdown, with promoters in green, passives in grey, and detractors in red. You can see at a glance which themes are dragging the score down and which ones your promoters keep bringing up.
Segment to find where detractors concentrate
Filter responses by persona, company, or platform to find the group your detractors cluster in. A theme that looks minor across everyone can be severe inside one segment, and that narrow segment is the one to act on.
You can also open individual account profiles, so a large account sitting on a low score gets routed to customer success before it quietly churns. That single move has protected more renewals than any blended score average ever will.
Root-cause with behavioral data
This is where Userpilot stops being a survey tool. You pair each NPS response with product analytics, so the score arrives with the behavior behind it rather than as a standalone rating.
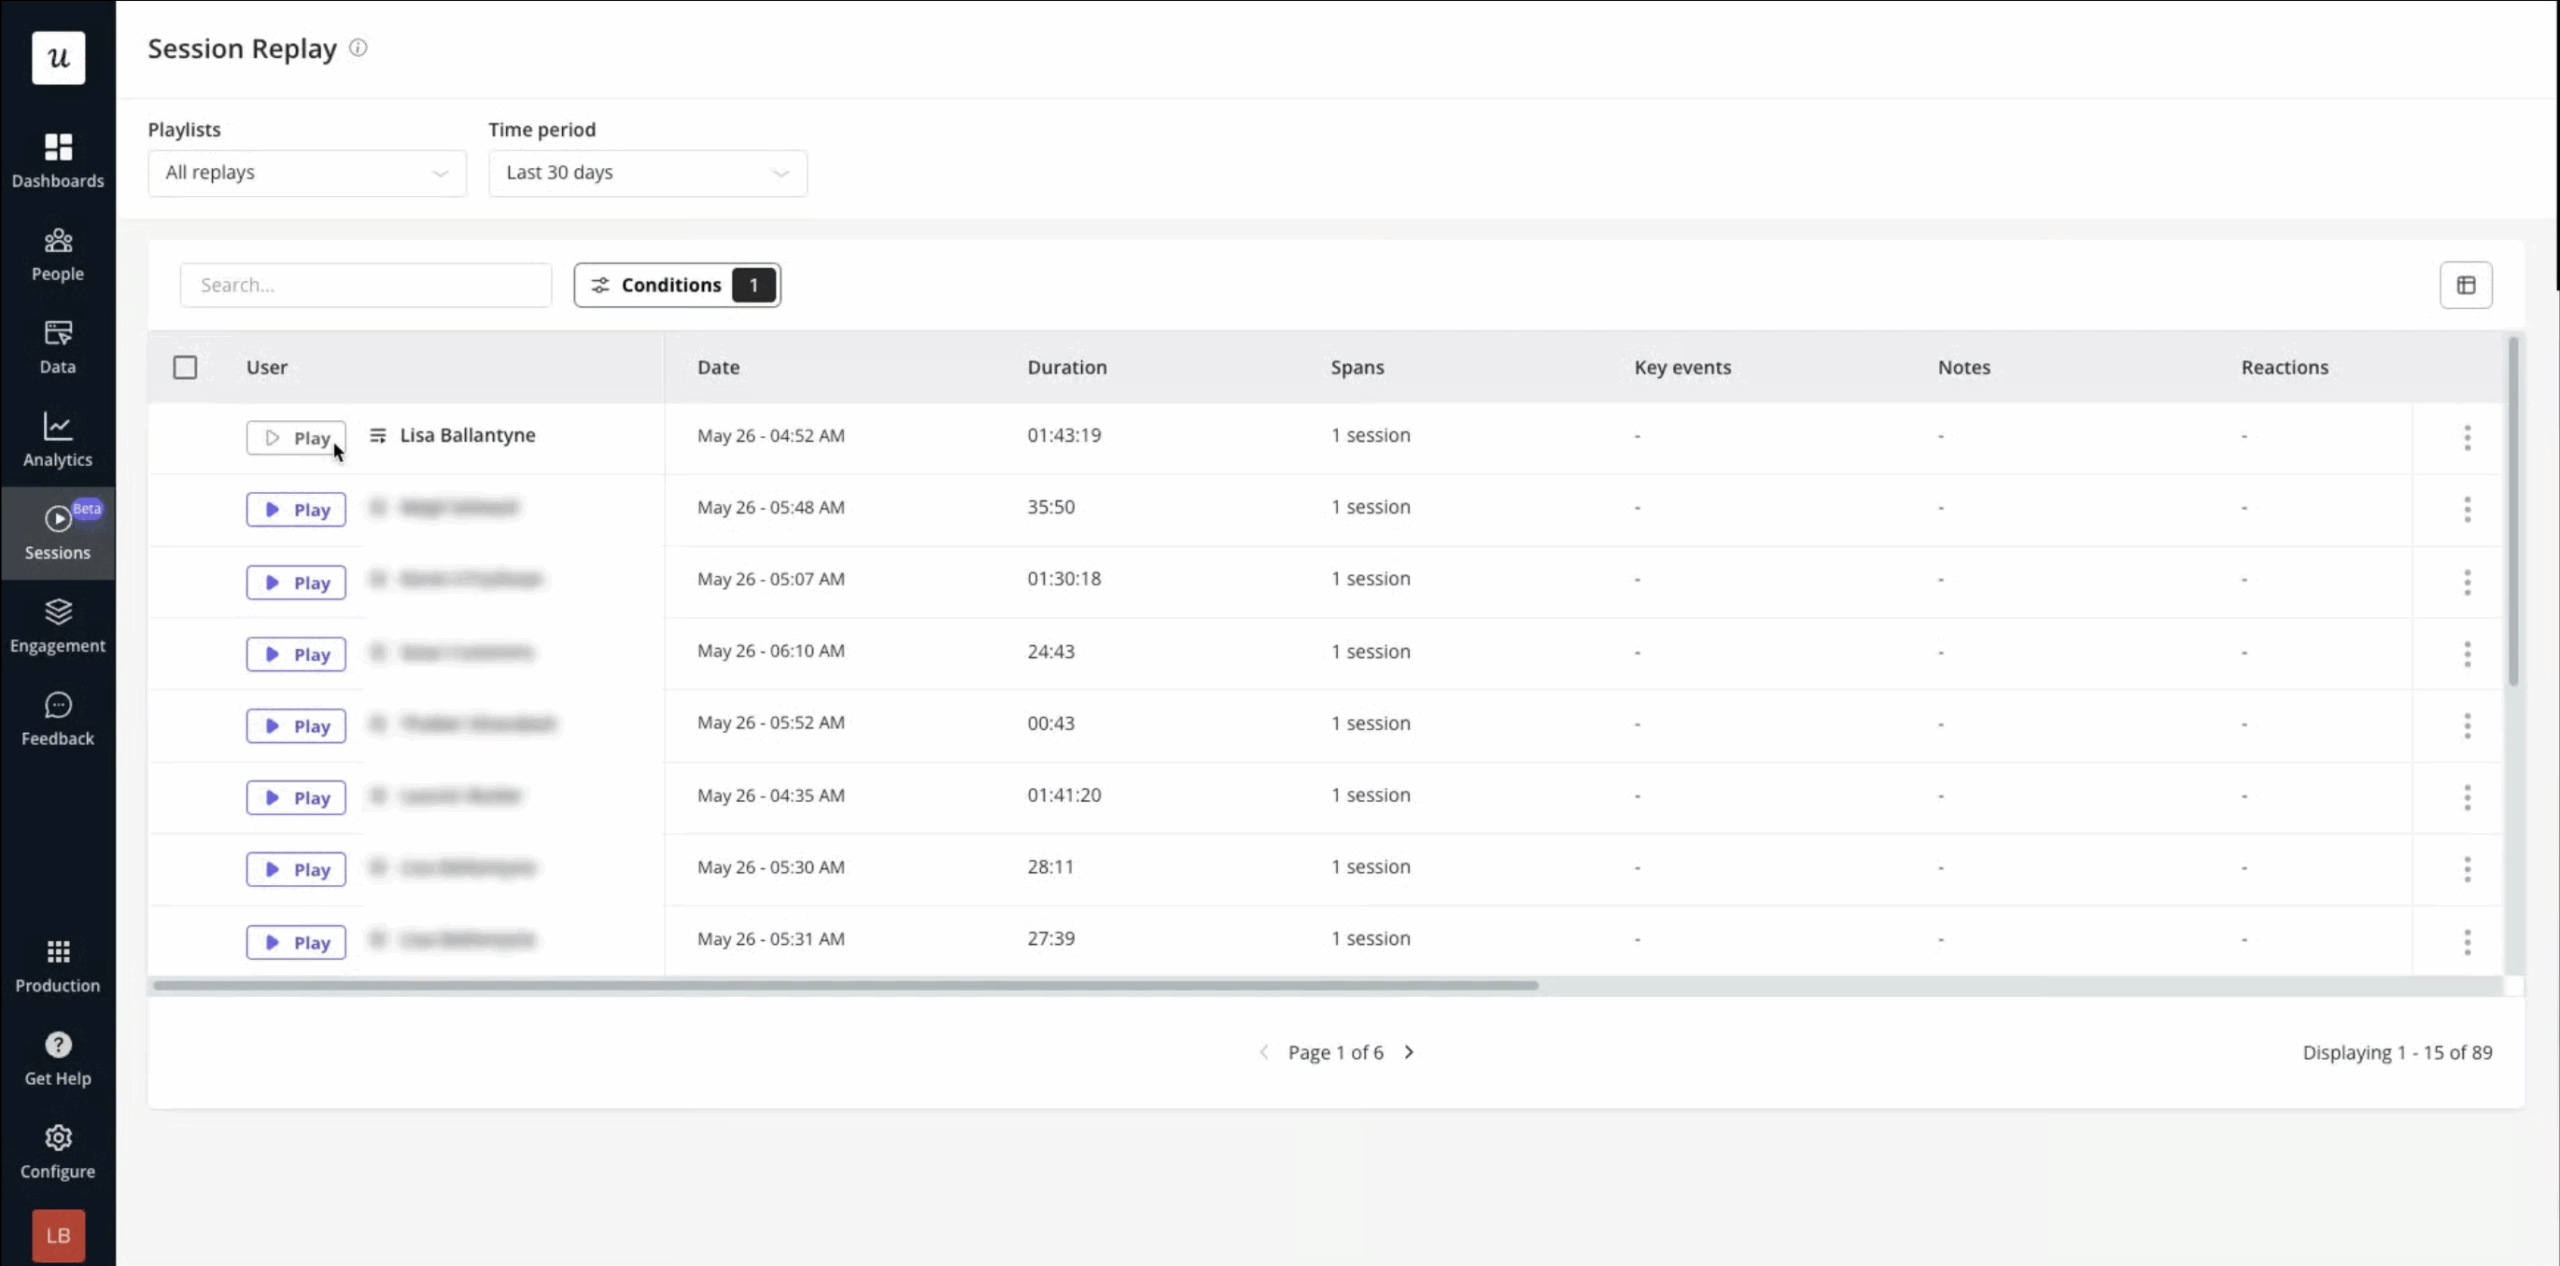
Userpilot Autocapture lets you analyze a respondent’s historical behavior without instrumenting events in advance. Session Replay lets you sit and watch how promoters and detractors actually move through the product, and Path Analysis shows the journeys people take right before they submit an NPS response.
James Mitchinson, Userpilot’s Head of Customer Success, put the value of this pairing in concrete terms. He described an account that logged in constantly while making no real progress, the kind of split a loyalty score alone would miss:
“It was clear progress wasn’t being made, but there were still a lot of logins. Being able to look at the difference between those two things, lots of activity but the outcomes aren’t really materializing, gave us the opportunity to have a more frank conversation with the executive stakeholder about the challenges they were experiencing. We got them back on track before they gave up.”
A loyalty signal plus behavioral data caught that risk early. Either one on its own would have missed it entirely.
Let AI do the synthesis
Lia, Userpilot’s AI agent, sits across NPS responses, surveys, session replays, product behavior, and content engagement, and pulls them into one connected view. You can ask it to summarize user sentiment or analyze a survey without exporting anything or stitching tools together by hand.
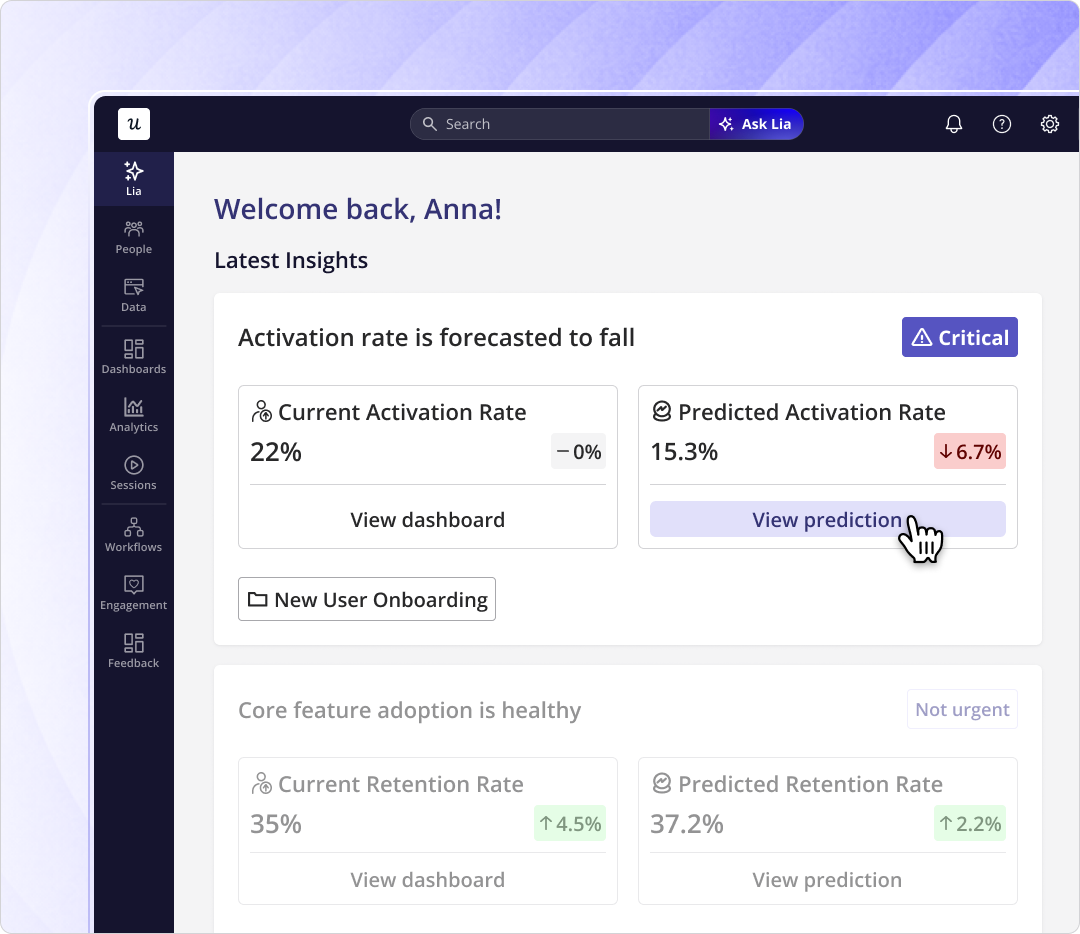
That churn work is the James scenario running on its own, combining NPS responses with behavioral signals into churn prediction that flags at-risk accounts. Automated tagging and sentiment analysis of open-text NPS answers is still rolling out, so today Lia is the layer that connects and summarizes, with the full automation arriving rather than already live.
Act: Close the loop
Collecting and analyzing NPS is effort. Acting on it is the only part that changes the score next quarter, and it is the step most teams quietly skip.
Route responses to where the work happens. NPS responses sync to HubSpot, Salesforce (via the Userpilot Salesforce integration), or Webhooks, so a detractor drops straight into your existing customer success or support workflow instead of waiting to be noticed in a dashboard.
Keep the data clean as you go. You can exclude test responses, which pulls them from analytics while keeping them in the response log, switch on Never Show Again for specific users, and export the full set as CSV for deeper survey analytics or sharing.
Two workflows show what closing the loop looks like in practice.
- When detractors keep mentioning onboarding, tag those responses, watch the session replays to find the exact friction, fix the onboarding step, then compare NPS trends before and after the change. The score movement tells you whether the fix worked.
- If enterprise accounts consistently report lower NPS than SMBs, segment those accounts, investigate their behavioral patterns, bring in customer success, and watch whether sentiment climbs over the next cycle. A gap between account tiers is usually a product story, not a survey quirk.
Put the loop on repeat
NPS is a trend, and not a snapshot. You set the re-trigger cadence so the survey re-shows on a steady rhythm, which by default is 90 days for users who completed it and 7 days for anyone who clicked ask me later, and the documented best practice tightens that to 60 to 90 days and 3 to 7 days.
Measuring the same population on the same rhythm is what lets you correlate score moves with releases, onboarding changes, or pricing using the history chart.
One documented constraint is worth reading as a feature rather than a limit. Each account runs a single active NPS survey at a time, which keeps you measuring one signal consistently instead of fragmenting it across competing surveys. If a user submits more than once in a day, only the most recent response counts toward the score.
Turn a score into an early-warning system
A score sitting in a dashboard tells you almost nothing. Run through this loop of targeted collection, an open-ended follow-up, thematic tagging, behavioral root-causing, and a real action, that same score becomes an early-warning system for churn and a map of what your users value. The value of NPS comes from collecting feedback you can investigate and act on.
Want to run the whole loop without code? Book a Userpilot demo and see how to make your NPS actionable end to end.
FAQ
How is the Userpilot NPS score calculated?
It subtracts the percentage of detractors from the percentage of promoters and multiplies by 100, giving a result between -100 and +100. Promoters answer 9 or 10, passives 7 or 8, and detractors 0 to 6.
How often should NPS surveys run?
The documented best practice is every 60 to 90 days for users who completed the survey and 3 to 7 days for anyone who clicked ask me later. Keeping a steady cadence lets you measure the same population over time.
Can I run more than one NPS survey at once?
No, each Userpilot account runs a single active NPS survey at a time, which keeps feedback consistent and prevents survey fatigue.
About the author