NPS Calculator: Benchmarks, Methods, and What to Do With It



Net Promoter Score (NPS) measures customer loyalty with one question: How likely are you to recommend us to a friend or colleague, on a scale of 0 to 10? NPS calculators tag respondents who answer 9 or 10 as promoters, those who answer 7 or 8 as passives, and anyone from 0 to 6 as a detractor. Then, they subtract the percentage of detractors from the percentage of promoters to get an NPS score, which ranges between -100 and 100.
However, a score on its own tells you almost nothing about what your customers feel or what to fix. So besides calculating your score, we’ll look at the 2026 benchmarks, explore other (better) NPS calculation methods, and walk through the tactics that turn NPS feedback into decisions.

Calculate your NPS in seconds
In the NPS calculator below, type your response counts to get your answer automatically. It works off the standard NPS formula: the percentage of promoters minus the percentage of detractors.
NPS CALCULATOR
Enter how many responses fell into each group. Your score updates as you type.
YOUR NPS
60.0% promoters − 15.0% detractors · 200 responses
60.0%
25.0%
15.0%
For example: with 60 promoters, 20 passives, and 20 detractors, you get 60% promoters minus 20% detractors, resulting in an NPS of 40.
NPS benchmarks: What a good score looks like right now
A good product NPS score depends on your industry, audience, survey timing, and the users included in the calculation. In Userpilot’s SaaS Product Metrics Benchmark Report, built from 229 SaaS companies, the average NPS was 35.7, and the median was 39.
I would use that as context rather than a target. Two companies can report the same score from very different samples, and even your own score becomes difficult to compare when one survey reaches new users while another reaches long-term customers.
The more useful question is whether your NPS is moving in the right direction among a comparable group of users. Track the score over time, keep the survey wording and audience reasonably consistent, and investigate what changed whenever the trend moves. The benchmark tells you roughly where you stand. Your own trend and response data tell you what to do next.
Choose the NPS calculation method that fits the job
Every NPS calculator applies the same formula: subtract the percentage of detractors from the percentage of promoters. Passives do not add to or subtract from the score, but they still count toward the total number of respondents used to calculate each percentage.
The method you choose matters less for the arithmetic than for everything around it. A standalone calculator works for a quick result. A spreadsheet gives you more control over a one-off dataset. Using an NPS dashboard like Userpilot’s is more useful when you need to calculate NPS repeatedly, compare segments, and connect the score with the people and product behavior behind it.
Use an online calculator for a one-off result
An online calculator is enough when you already know how many promoters, passives, and detractors you have and only need the final score. It is fast, but it does not preserve the respondent data, show how the score changed, or help you understand why people selected those ratings.
That makes it useful for checking your math, but not for running an ongoing NPS program.
Use a spreadsheet for occasional surveys
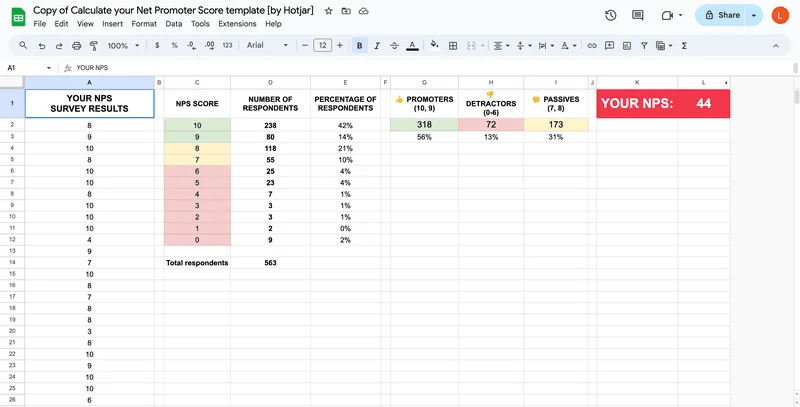
A spreadsheet works when you collect NPS once or twice a year and have a manageable number of responses. You can paste in the scores, classify each response, calculate the percentages, and create your own breakdowns.
The work increases quickly once you need to repeat the process by plan, role, company size, product area, or survey wave. You also need to manage test entries, duplicate responses, open-text comments, and historical comparisons yourself.
Use Userpilot for recurring and segmented NPS
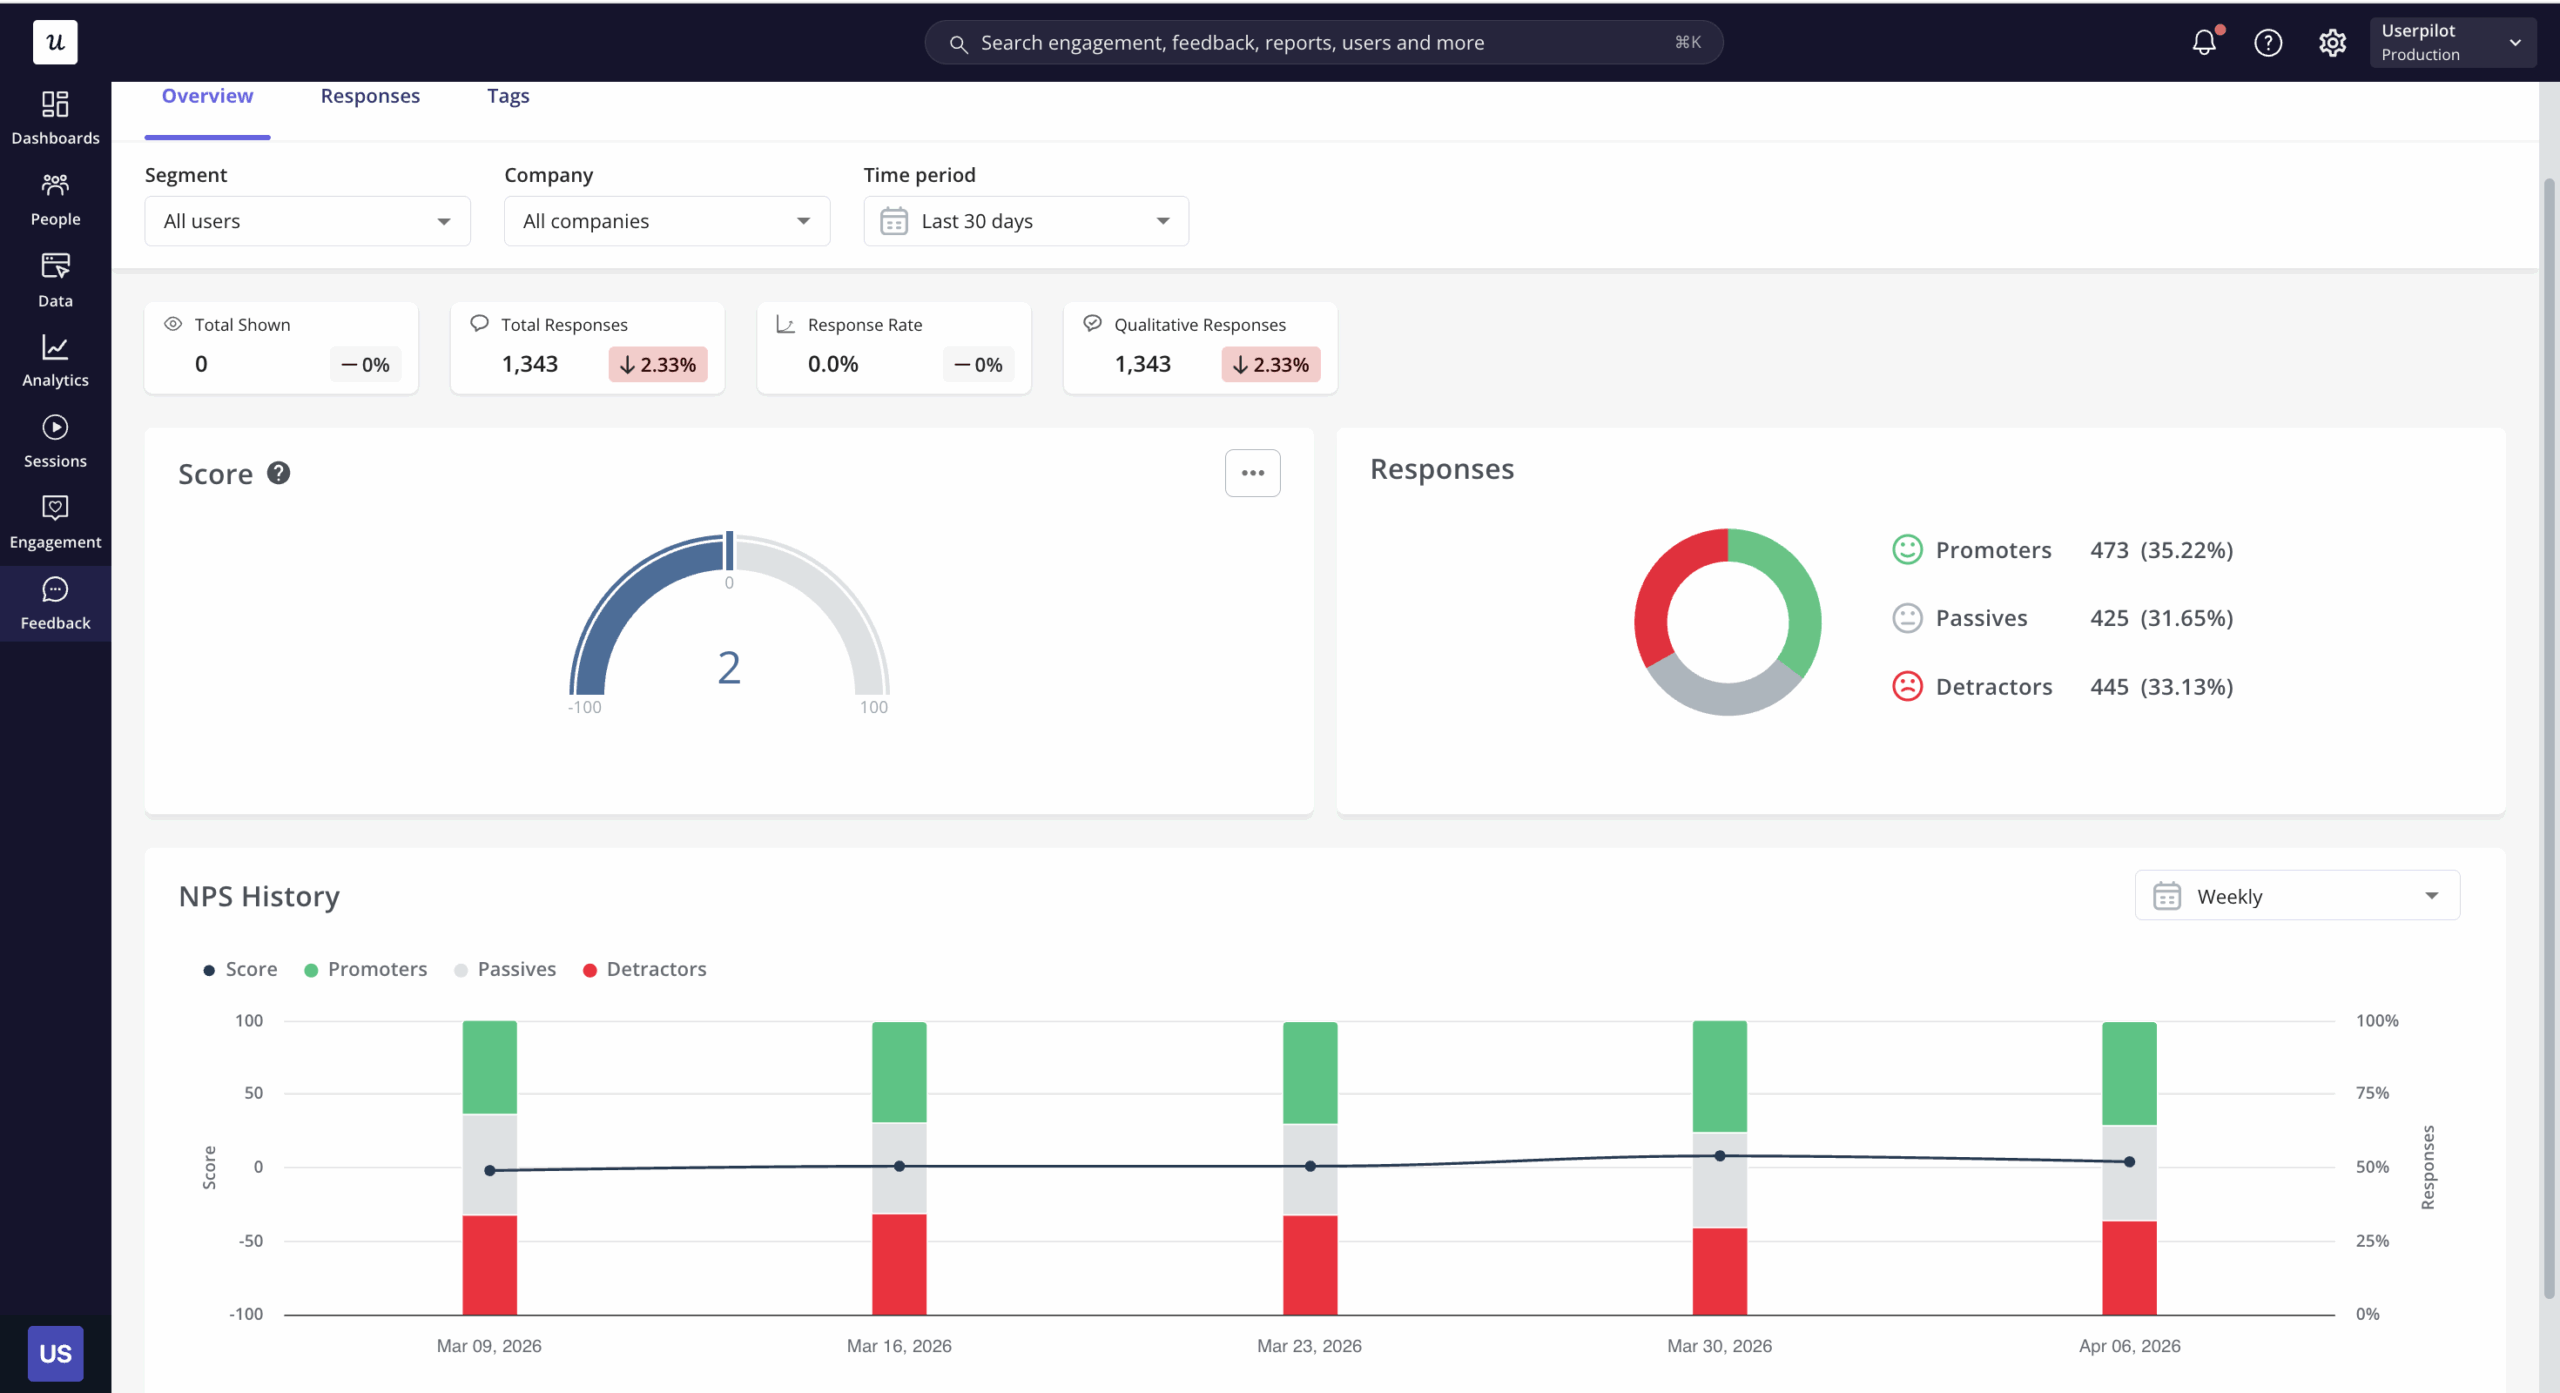
Userpilot removes the manual calculation step. Once users submit the in-app NPS survey, the platform classifies scores from 9 to 10 as promoters, 7 to 8 as passives, and 0 to 6 as detractors.
It then calculates the score and updates the NPS dashboard as new responses arrive.
This is more useful than copying totals into a calculator because the score stays connected to the survey response, user, company, segment, platform, and time period. You can calculate the overall NPS and then check whether the result changes among different customer groups without rebuilding the dataset each time.
How Userpilot keeps the NPS calculation accurate
Automatic calculation is only helpful when the underlying responses are handled consistently. Userpilot gives you several controls for keeping test data, repeat submissions, and unrelated audiences from distorting the score.
Target users who can answer the question meaningfully
You can show the NPS survey to all identified users or limit it to a saved segment or custom audience based on user data, company data, and product usage metrics. You can also choose the platform, domain, page, sampling rate, and recurrence.
For example, I would normally exclude brand-new signups that have not experienced the core product yet. Depending on the product, a more useful audience might be paid users who activated at least 30 days ago or account administrators who have seen enough of the customer experience to evaluate it.
Userpilot also lets you control when completed respondents see the survey again. The default recurrence is 90 days, while the documented best-practice range is 60 to 90 days. This helps you collect a new relationship signal without asking the same person so often that the survey becomes noise.
Keep test and duplicate responses out of the score
If you submit test responses before publishing the survey, you can exclude them from NPS analytics without deleting them from the response log. That gives you a cleaner production score while retaining a record of what was removed.
Userpilot also handles multiple responses from the same user on the same day by counting only the most recent submission in the NPS calculation. All submissions remain visible and can still be exported, but one user cannot inflate the daily score by responding repeatedly.
Filter the score before drawing conclusions
The NPS dashboard can be filtered by segment, company, time period, and platform. This is where an automatically calculated score becomes much more valuable than a standalone calculator.
Suppose your overall NPS falls from 40 to 31. The total does not tell you whether sentiment changed across the customer base. Filtering may show that the decline came almost entirely from new mobile users, one pricing plan, or companies that had not adopted a recently changed workflow.
You can also compare periods in the NPS history chart, review the promoter-passive-detractor split, and filter for responses that include written feedback. The calculation remains the same, but the context changes what the result means.
Use the Userpilot MCP server to investigate the score
A dashboard can show that NPS changed, but you may still need to move between response tables, user profiles, company data, and product analytics to understand why. The Userpilot MCP server makes that investigation faster by bringing Userpilot data into ChatGPT, Claude, Cursor, Copilot, and other MCP-compatible tools.
Instead of exporting NPS responses and uploading them somewhere else, you can ask questions in plain language using the survey, user, company, segment, event, feature-usage, and product-path data already available in Userpilot.
For example, I might ask:
- What was our NPS for Growth-plan companies during the last 90 days?
- Which customer segments account for most of the decline since the previous survey period?
- Summarize the recurring themes in detractor comments and show how often each theme appears.
- Which features do promoters use more often than detractors?
- Show detractors whose product activity declined during the 30 days before they responded.
- For user ID [ID], compare the NPS response with recent events, feature usage, and company activity.
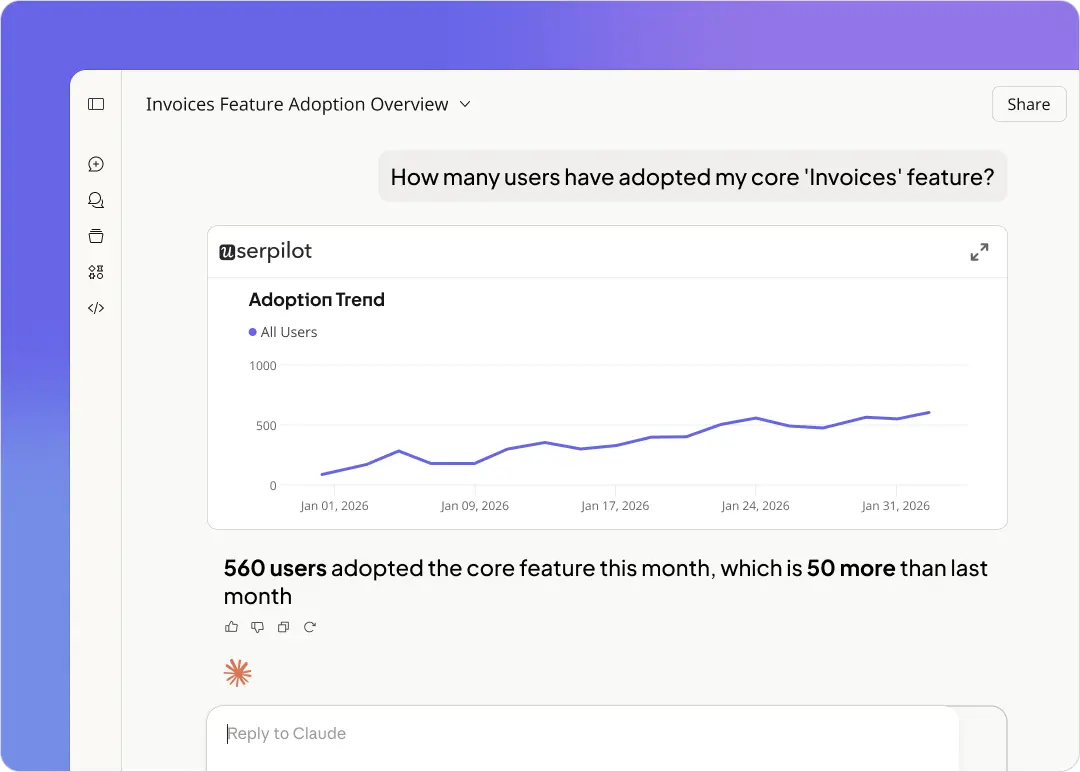
This does not change the NPS formula. It changes how quickly you can move from the calculated score to a useful explanation.
For instance, a drop in NPS among new accounts might initially look like dissatisfaction with a release. An MCP query could show that most detractors never completed the activation events and rarely used the affected feature. That points you toward product onboarding or poor value realization rather than the release itself.
Ask a follow-up question so the score has context
An NPS calculator can tell you how many more promoters you have than detractors. It cannot tell you what created either group.
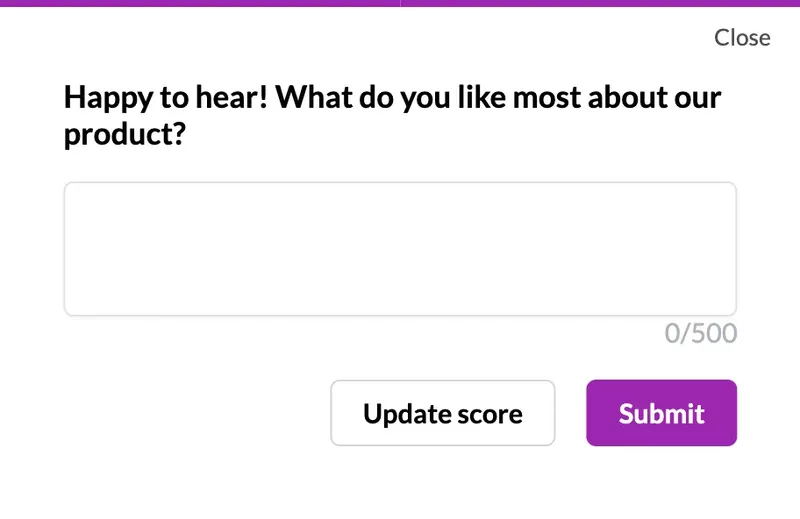
When creating an NPS survey in Userpilot, you can add one universal follow-up or show different questions based on the score. I prefer score-based follow-ups because promoters, passives, and detractors have different things to explain:
- Promoters: What do you value most about the product?
- Passives: What would make the product more useful to you?
- Detractors: What is the main reason for your score?
Keep the question optional. The score should still count when a user does not leave a comment, and forcing everyone to explain can reduce completion or produce rushed answers.
In the response view, you can filter promoters, passives, and detractors, search for responses with written user feedback, and tag comments by theme for easier feedback analysis. Tags such as pricing, missing capability, support, onboarding, or reliability make it easier to see which issues recur and how the score breaks down within each theme.
Compare what users say with what they do
NPS is a relationship metric, so I would not treat one low score as a diagnosis. A detractor may be frustrated by a recent support interaction, unable to find a feature, poorly onboarded, or simply not a good fit for the product.
Use product analytics to compare the groups behind the score. Look at activation, return frequency, feature adoption metrics, funnel completion, and account-level activity. If detractors repeatedly abandon the same workflow, you have a stronger lead than the rating alone provides.
When a written response is still unclear, use session replay to inspect what happened around the relevant task. A user may write that a feature is “too complicated,” while the replay shows that the real problem was a hidden control, an error, or a form they could not complete.
This is also where the MCP workflow is useful. You can start with the NPS group, narrow it to the users affected by a specific behavior, and then review the underlying reports or sessions for confirmation.
Use NPS trends to decide where to investigate
The calculator gives you a score between -100 and 100. Userpilot helps you decide whether the change is meaningful and where to look next.
I would review four things together:
- The score: Did NPS rise or fall compared with a similar previous period?
- The sample: Who was eligible, who responded, and did the respondent mix change?
- The distribution: Did the movement come from more detractors, fewer promoters, or both?
- The explanation: What themes and behaviors are common among the users driving the change?
Then act at the right level. Follow up personally with high-value detractors, fix recurring problems that affect a larger segment, help passives reach more value, and invite relevant promoters to participate in reviews, referrals, interviews, or case studies.
The goal is not to chase the highest possible NPS after every survey wave. It is to use a consistent calculation to notice changes in the customer relationship, then combine feedback and behavior to understand what deserves attention.
Calculate NPS where you can act on it
A standalone calculator is useful when you need to turn three response totals into one score. For an ongoing NPS program, the harder work begins after the calculation.
Userpilot collects the responses in-app, calculates NPS automatically, keeps the result tied to users and companies, and lets you compare the trend across segments and periods. The MCP server then gives you a quicker way to question that data alongside product usage instead of exporting and rebuilding the analysis elsewhere.
Book a Userpilot demo to see how you can calculate NPS, investigate the responses, and act on the findings from the same platform.
About the author