11 Best Event Tracking Tools Compared by Setup and Upkeep


Getting events into an analytics tool is no longer the hard part. Many platforms automatically capture clicks, and teams can tag events without writing code.
But event drift can accumulate until event names like “signup_click,” “SignUp_Clicked,” and “Clicksignups” start to sound interchangeable. A UI change renames a button after a release, and the event attached to it stops reporting. A backlog of engineering requests builds up in the meantime.
Until that work is done, you can’t fully trust what your data tells you about friction in the user journey, feature adoption, or whether a new release delivered the expected results.
In this guide, I compare 11 event tracking tools for product and growth teams. I look at how each one collects data, how much setup and maintenance it needs, and what it costs. By the end, you’ll know which tool best fits your team’s skills and resources.
Executive summary
- Capturing events is easy with most tools now: What sets them apart is who has to name, fix, and act on events once they’re collected.
- To tag, maintain, and act on events without engineering: Userpilot.
- For in-depth product analytics and historical patterns: Amplitude, Mixpanel, Heap, and Fullstory.
- For engineering-led tracking and data control: PostHog and Countly, plus Hightouch for teams with an existing data warehouse.
- For website and digital experience analytics: Google Analytics 4, Contentsquare, and Matomo.
| Tool | How events get in | Historical data for new events | Who maintains events | Best for | Starting price |
|---|---|---|---|---|---|
| Userpilot | Autocapture, visual labeling, code for backend events | Yes From install | PM; developers for backend events | Tracking, analyzing, and acting on events in one platform | $299/month |
| Amplitude | Web autocapture, visual labeling, SDK for server-side events | Yes From install (web interactions) | Analytics team; developers for server-side events | Deep product analytics and governed tracking | Free up to 2M events/month |
| Mixpanel | Autocapture, custom event definitions using properties | Yes From install (captured interactions) | Analyst; developers for code changes | Flexible analytics with analyst-owned event definitions | Free up to 1M events/month |
| Heap | Autocapture, visual event labeling, SDK for custom events | Yes From install | PM or analytics admin; developers for complex events | Investigating behavior you didn’t plan to track | Free up to 10K sessions/month |
| PostHog | Web autocapture, Toolbar Actions, code-based events | Yes From install (web interactions) | Developers and engineering teams | Code-first product analytics | Free up to 1M events/month |
| Countly | SDK or API implementation | No From when the event goes live | Developers and data teams | Self-hosting and control over data | $175/month |
| Hightouch | SDK or API events routed to a data warehouse | No From when the event goes live | Engineering and data teams | Warehouse-based event collection and activation | Paid plans on quote |
| Google Analytics 4 | Enhanced Measurement, Google Tag Manager, or code | No From when the event goes live | Marketing or analytics team; developers for custom events | Website traffic and marketing analytics | Free |
| Contentsquare | Autocapture, Tag Configurator, GTM, or JavaScript | PartialAutocapture from install, custom events from go-live | Digital analytics team; developers for complex tracking | Connecting behavioral events with heatmaps and replays | Free up to 200K sessions/month |
| Fullstory | Autocapture, visual event definitions, API for custom events | Partial Yes in reports and funnels, not in Journeys or Data Quality Monitoring | Product or UX team; developers for backend events and integrations | Behavioral analytics with session context | Free up to 30K sessions/month |
| Matomo | Matomo Tag Manager or JavaScript | No From when the tag goes live | Marketing or analytics team; developers for complex events | Privacy-focused website analytics and data ownership | Free on-premise (hosting extra) |
What are the best event tracking tools in 2026?
In my experience, the top event tracking tools in 2026 are the ones you can keep accurate without constant hands-on management. Capturing events is easy. What separates these tools is how well they hold up as your product grows and evolves.
When I evaluate tools, I look at how much of the upkeep is automated and whether I need to allocate dedicated resources to oversee the rest. Finally, I compare pricing plans to see how transparent and predictable costs remain as usage climbs.
Tools also differ in how they collect data:
- Autocapture and visual labeling: You define events from automatically recorded sessions.
- Code-based tracking: Developers implement and maintain the tracking code.
- Warehouse-based tracking: Routes user event data into your data infrastructure for analysis.
AI instrumentation also varies. Some tools, like PostHog and Amplitude, use AI to generate tracking code in your codebase, while others like Userpilot help you organize and manage data already captured.
1. Userpilot: For tagging, maintaining, and acting on events without engineering
Userpilot, the agentic product adoption platform, gets the top spot because it closes the loop the other tools often leave open: the PM who tags an event can analyze it and act on it in the same place, while Lia, our AI agent, keeps labels accurate as the UI changes.
Getting started is pretty straightforward. You simply add a single JavaScript snippet through your codebase, npm, Google Tag Manager, or Segment if it’s part of your existing tech stack, and Userpilot starts autocapturing interactions on its own without any additional configuration.
That’s also what makes it valuable from a product perspective: you get visibility into user behavior and can capture actionable insights without making tracking a separate development project.
Defining events is just as direct. Label any autocaptured click, text input, or form submission by selecting the element in Visual Labeler or opt for a CSS selector if you prefer a more technical approach. Userpilot’s analytics tracks in-product behavior, so backend events like payment completion, subscription tier changes, and account approvals still require developer support.
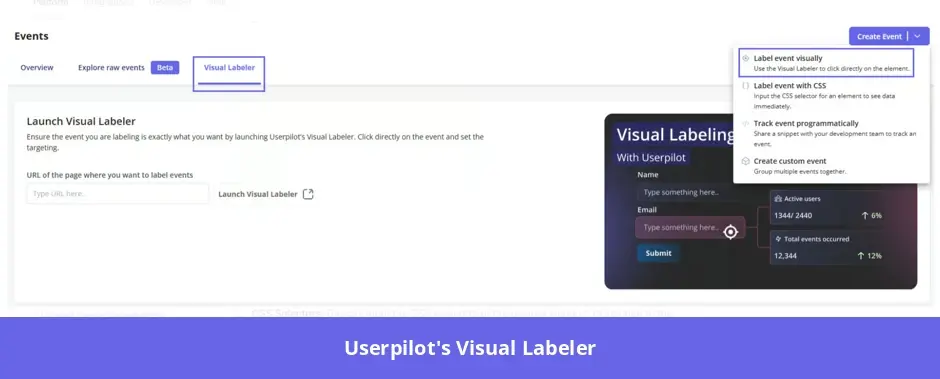
What sets Userpilot apart is what happens next. Labeled events inform reports, audience segments, and in-app experiences, and because they share one definition, analytics and engagement are always aligned.
That’s how one of our customers, The Room, fixed a stalled activation step: new members weren’t uploading their CVs, so employers had no one to review.
Their Senior Product Manager tagged the “upload CV” button with Userpilot’s no-code feature tagging, built an onboarding flow that kept prompting anyone who hadn’t clicked it, and tracked the results in the same dashboard without filing a single engineering request. Within 10 days, weekly CV uploads went from 200-210 to 300-350, a 75% lift.
Upkeep is where tracking usually falls back on developers and that’s where Userpilot’s AI agent Lia earns a place. Lia analyzes autocaptured raw event data to handle the maintenance that usually waits on a developer, so she can:
- Identify unlabeled interactions and suggest event names and tracking rules.
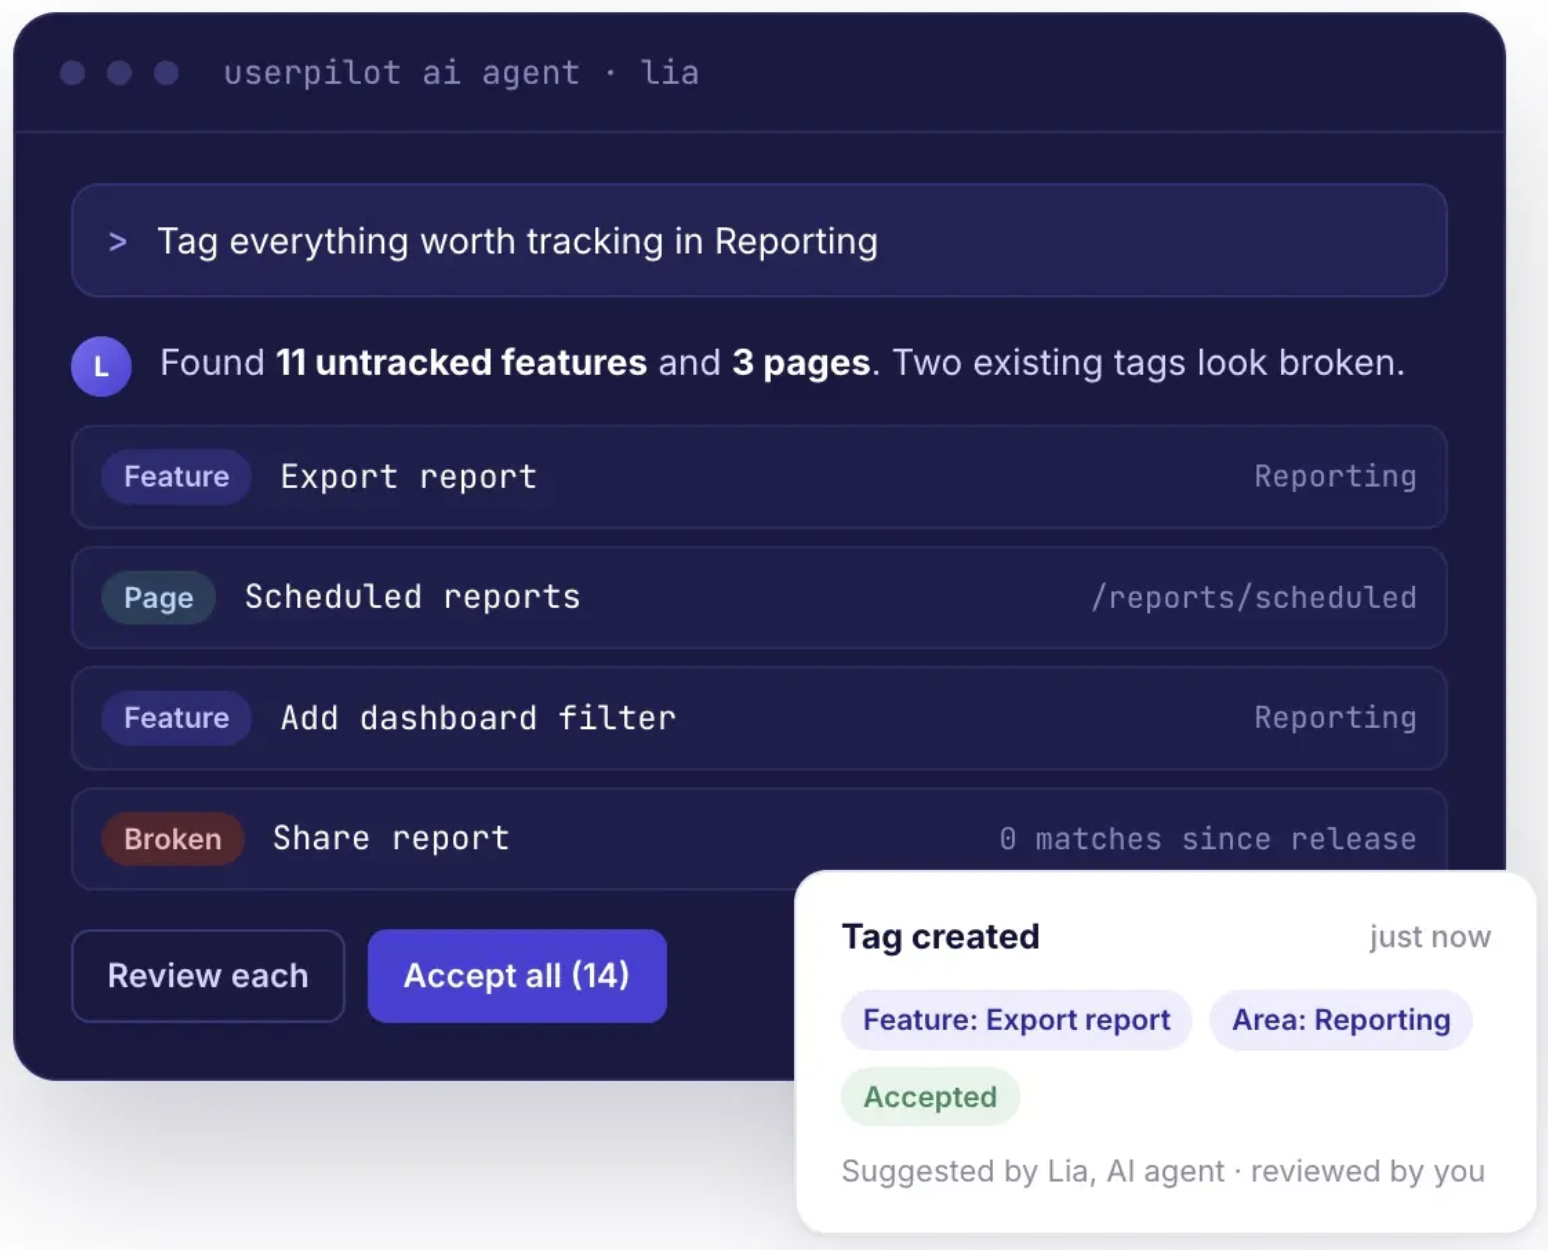
- Answer questions like “Where do users stall in onboarding?” without needing a ticket.
- Flag tags that broke after a UI change.
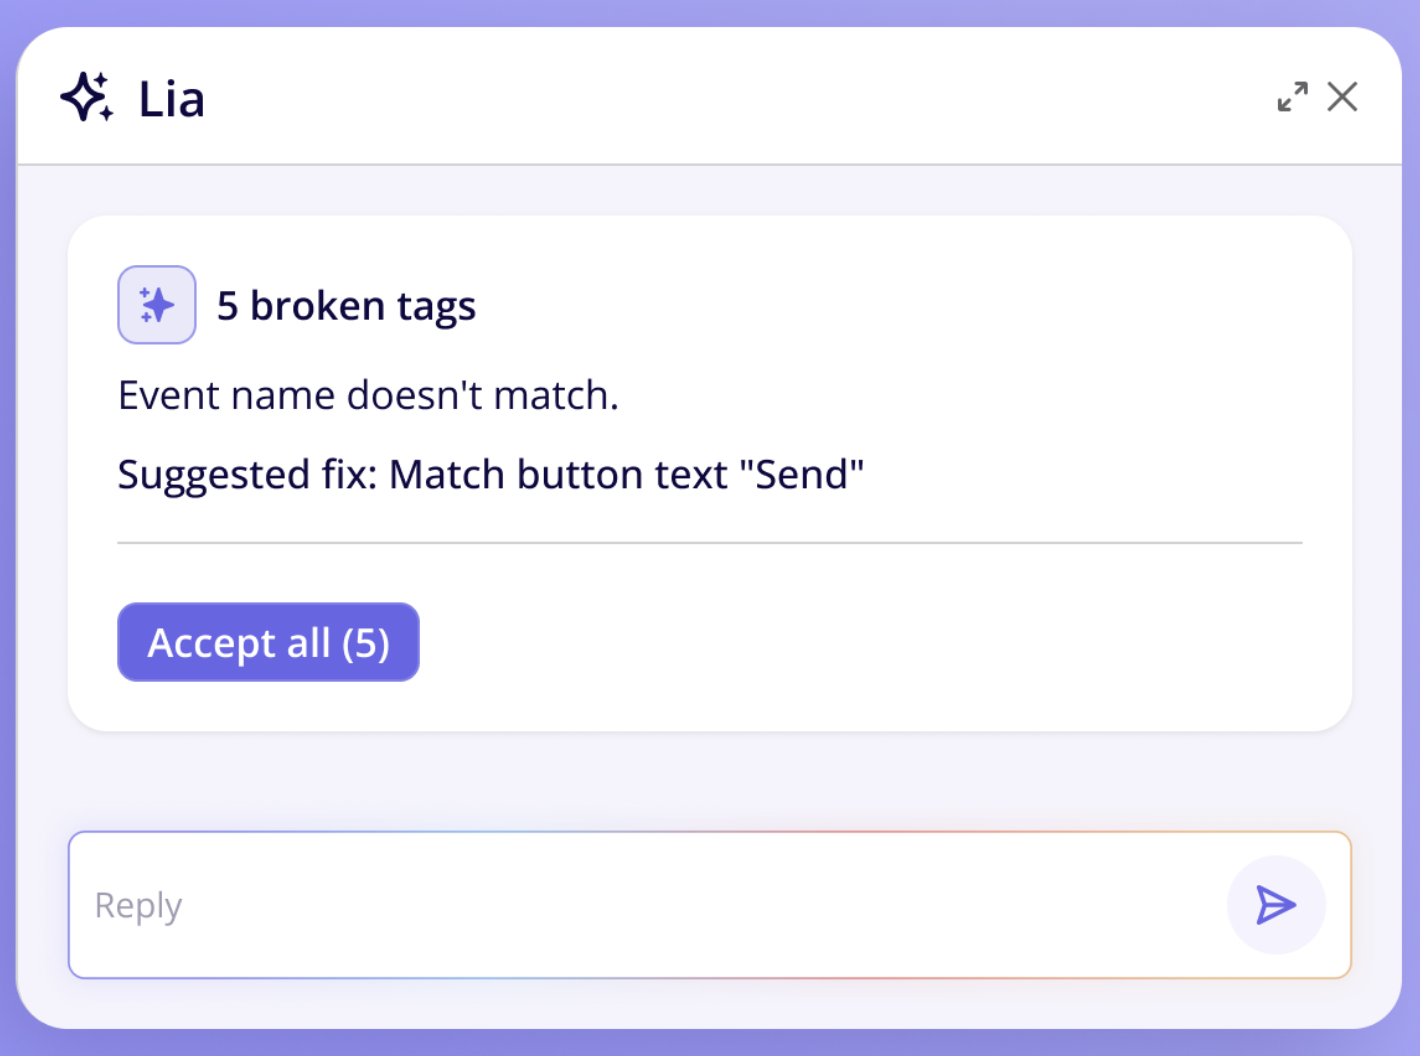
- Highlight pages that stopped getting traffic.
Lia will also be able to install the Userpilot SDK from a chat.
The AI approach is the clearest difference from the alternatives. Amplitude and PostHog use AI wizards that scan your codebase and generate tracking code, so they require more direct developer involvement. Lia works on already captured data, so non-technical teams can manage events themselves.
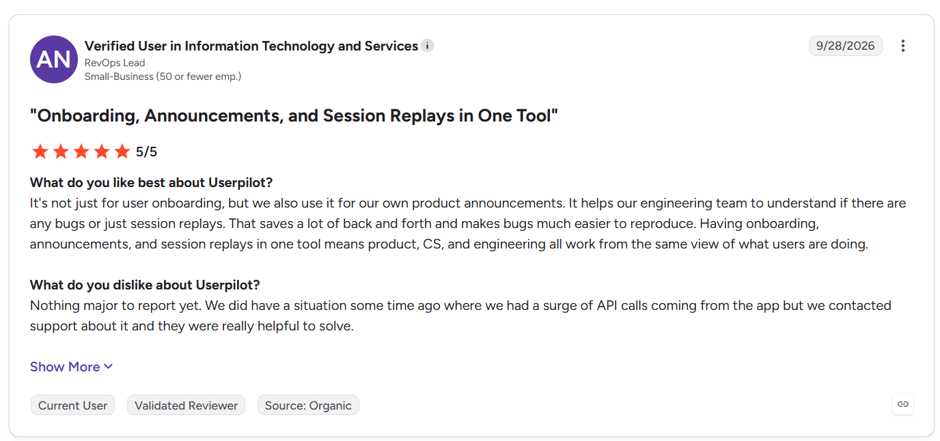
I’d recommend Userpilot for product teams that want to reduce developer dependence, and manage event tagging, analytics, and in-app engagement in one place as highlighted by user reviews like the following on G2. Backend events still require engineering support.
Pricing: Userpilot starts at $299/month for up to 2,000 monthly active users, while the Growth plan, which adds event autocapture, starts at $849/month. A custom Enterprise plan is also available, and Lia and the MCP server (Userpilot headless) are included in every plan.
2. Amplitude: For data teams that want depth and a governed tracking plan
Amplitude is a tool I’d consider when a team wants to go beyond basic behavioral tracking and get a deeper understanding of how people use the product, with advanced funnel, retention, and cohort analysis. It’s also easier to get started with than its reputation suggests.
Once the browser SDK is installed, Amplitude’s autocapture starts collecting sessions, page views, clicks, marketing attribution, form interactions, and file downloads. From there, visual labeling lets non-technical teammates name captured interactions and analyze them retroactively, including activity from before the event was defined.
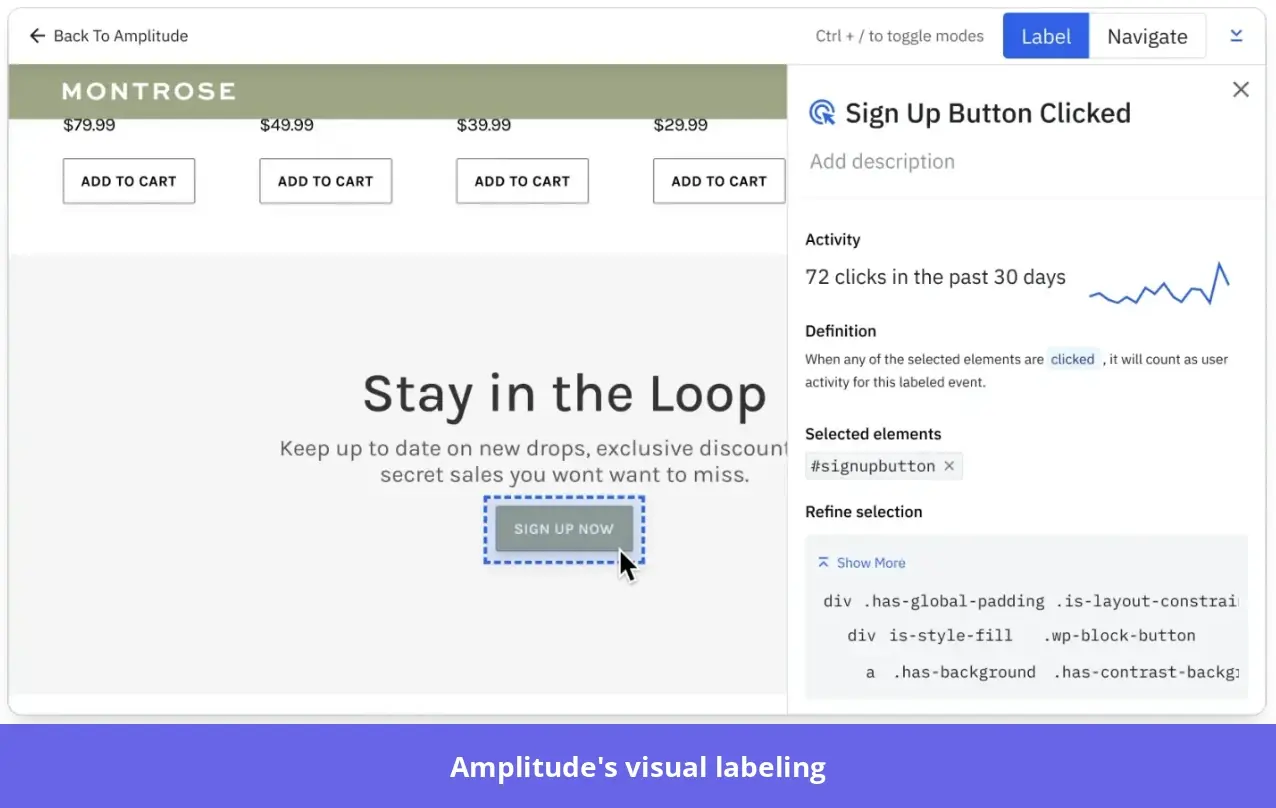
As the analysis gets deeper, engineering comes back in for:
- Milestone events like activation or purchases, which Amplitude recommends tracking with precisely instrumented events alongside autocapture.
- Server side tracking, which needs its own instrumentation because autocapture only sees what happens in the browser.
Amplitude’s AI Wizard can write that tracking code, but it works in the codebase, so it speeds up engineering rather than replacing it.
As the taxonomy grows, someone also has to own event names and definitions to keep them consistent. Amplitude is rated 4.4/5 on G2, and one of the reviewers describes exactly this tradeoff:
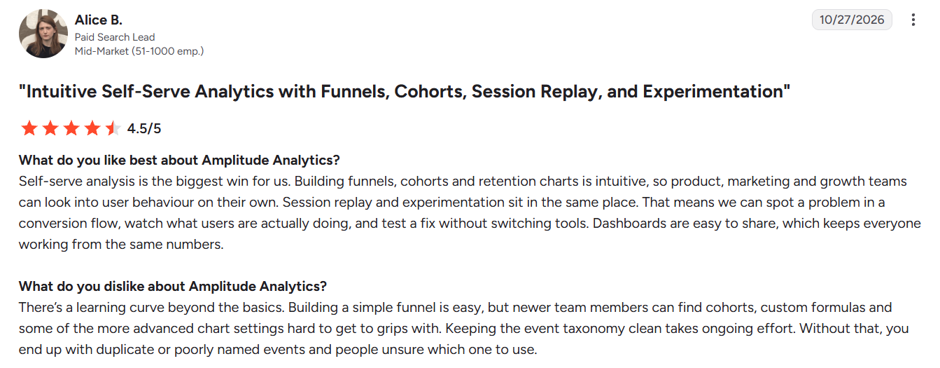
It’s also worth deciding early what gets captured, since autocapture adds to your event volume and Amplitude bills on event volume.
Pricing: Vendr places the median contract at $64,000, based on 422 Amplitude purchases. The observed range runs from $24,750 to $379,933. Smaller teams can opt for the free plan, which includes unlimited seats, AI agents, MCP, with limits of 2M events and 10K session replays, and up to one live guide or survey at a time.
3. Mixpanel: For teams with an analyst who owns event definitions
Mixpanel is for teams that have an analyst to define and structure the data. It gives product and growth teams real-time analytics through autocapture, but it has no visual labeler, so defining events takes more manual work.
Getting started needs a developer to add Mixpanel’s SDK to your product and switch autocapture on in the configuration. After that the work switches to an analyst.
Because non-technical teams can’t label interactions visually, the analyst builds custom events from the properties of captured events, such as an event that identifies clicks on a button with the text “Start free trial.” This manual layer of intervention is why an analyst who owns event definitions becomes critical.
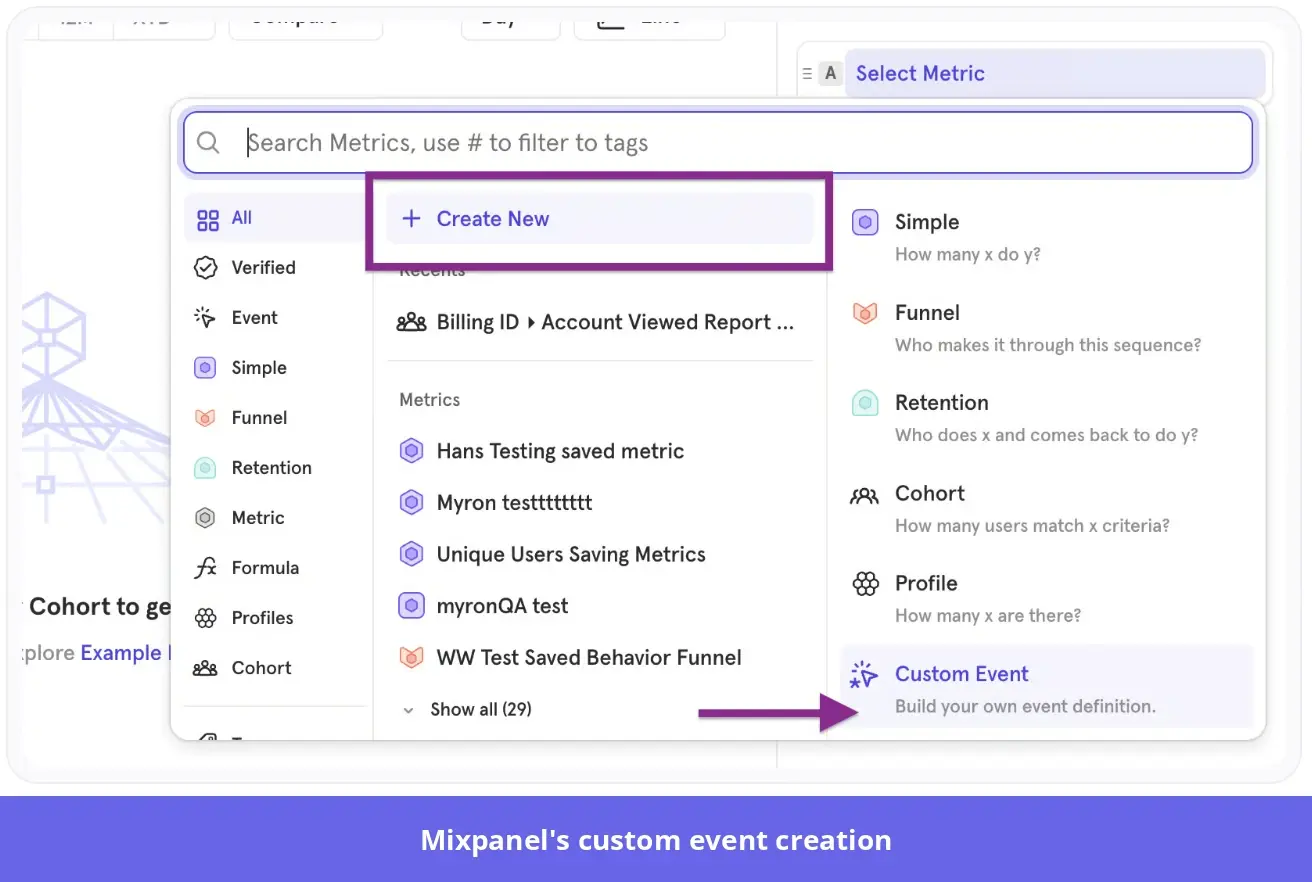
Governance lives in Lexicon, Mixpanel’s data dictionary, which is available on all pricing tiers. You can use it to organize and manage tracking definitions with event names, descriptions, and ownership information. The stricter controls (event owners, naming standards, and event approvals for newly tracked events) are available only on the Enterprise plan.
AI-assisted features flag duplicated data and properties, and suggest metadata improvements, reducing some of the manual intervention required.
There are limits to what Lexicon can do:
- Lexicon changes how events appear, not how they’re sent: It can merge differently named events for analysis, but it doesn’t rewrite the underlying raw event data.
- Renaming an event at the source requires a developer to change the instrumentation: I’d keep that in mind when naming events from the start, because changing names later can cost you engineering time.
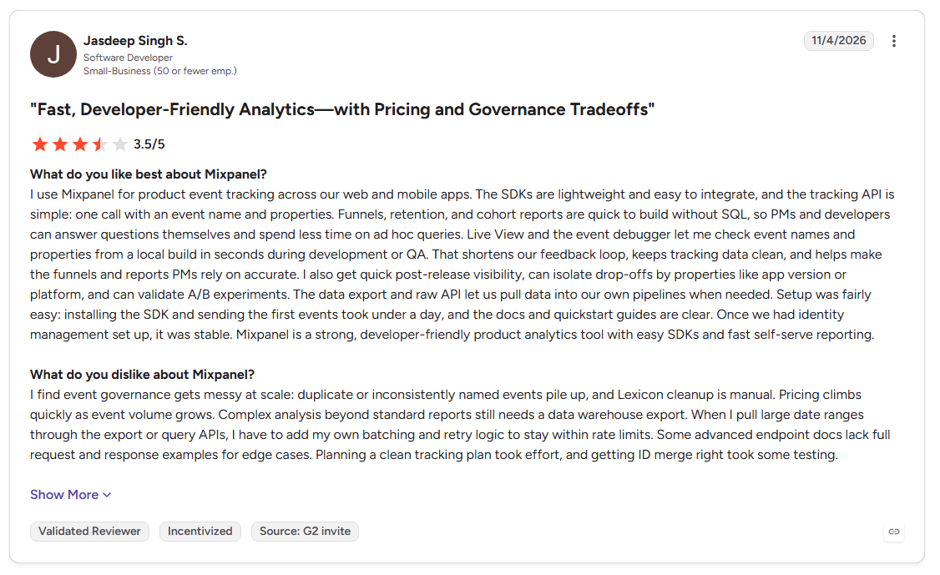
The complexities of data governance can be seen in the following review from G2, where Mixpanel is rated 4.5/5 overall.
Pricing: Vendr puts the median Mixpanel contract at $40,307, based on 226 purchases. The observed range is $13,250 to $120,102. Depending on what you require, you may find the Free Plan more than adequate for your needs.
The free plan includes unlimited seats, 1M events, 10K monthly session replays, and up to 1K MEU per month. It also includes up to 10 active feature flags and funnels & retention analysis.
4. Heap: For analyzing behavior you didn’t plan to track
Heap by Contentsquare is my pick for product teams that want to analyze user behavior retrospectively, without planning every event in advance. Once the SDK is installed, Heap collects the data, and you can define the interactions after they occur.
That defining takes place in the point-and-click Event Visualizer. Say you want to measure the adoption of a feature you’ve never tracked. Use the visualizer tool to define it retroactively and examine the key user actions around it.
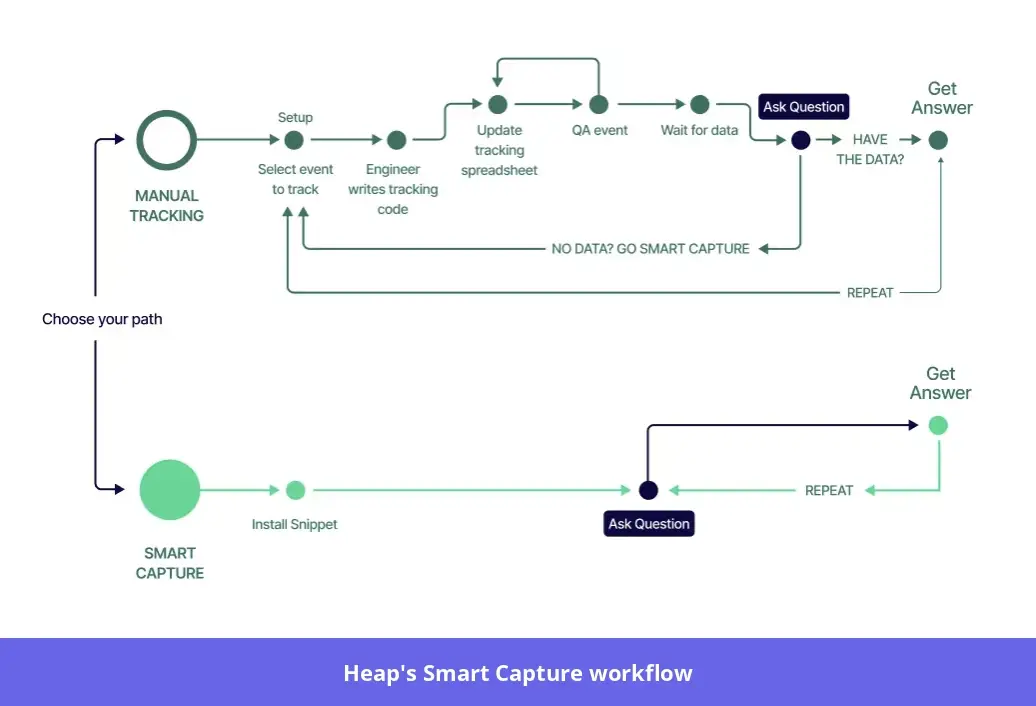
There’s a catch: retroactive definitions need upkeep. Event definitions rely on properties such as CSS selectors, which become less reliable when an element’s structure, class, or attributes change during a release or redesign.
You can adjust the suggested CSS selector to make an event definition broader or more specific. My advice: recheck your key event definitions after every UI change, because a definition can stop matching the right interaction over time.
Autocapture extends to mobile apps covering iOS and Android, using mobile-specific properties such as screen names, resource IDs, and target text. But some limitations exist:
- Visual labeling on mobile works only with select SDK versions: Check yours before planning around it.
- Distinguishing between similar interface elements or tracking complex backend actions may require work: Developers need to add descriptive properties or implement custom events through the SDK.
That’s the tradeoff I’d consider before choosing Heap. It takes away the burden of planning upfront, but event definitions still need an owner as the product evolves, and more complex or backend tracking may need developer support; a limitation seen in a recent review of the product on G2 (where the average user rating is 4.4/5):
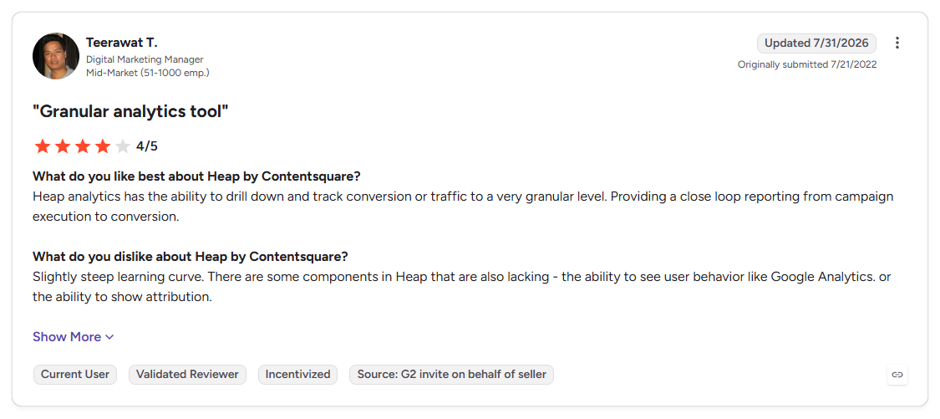
Pricing: The median contract value on Vendr is $41,220 with the observed range running from $13,000 to $154,798. The free plan includes core analytics charts, unlimited enrichment sources, guides integrations, six months of data history, SSO, and up to 10k monthly sessions. Three paid plans are available, all priced on request.
5. PostHog: For engineering-led teams that want analytics in the codebase
PostHog is the right tool for teams where engineers own instrumentation and prefer a code-first approach.
The setup is straightforward. Once the JavaScript SDK is installed, its autocapture kicks in to start recording common web interactions, such as clicks and page views.
Product teams still get a way in without writing code. The PostHog Toolbar allows you to select specific interface elements and create “Actions,” which group interactions under meaningful names for analysis. Actions apply retroactively, so you don’t need to define every event in advance.
Going deeper brings the work back to the codebase. PostHog’s AI wizard is code-focused as well: it identifies product flows and helps write tracking code within the codebase. Instrumentation gets faster, but developers still need to oversee the implementation. Custom tracking and ongoing instrumentation require engineering support.
Mobile is where I’d slow down. The Toolbar’s visual event creation workflow applies to the JavaScript SDK. It may not work identically on other platforms, such as native iOS or Android apps. Keep that in mind before you plan a mobile rollout around it.
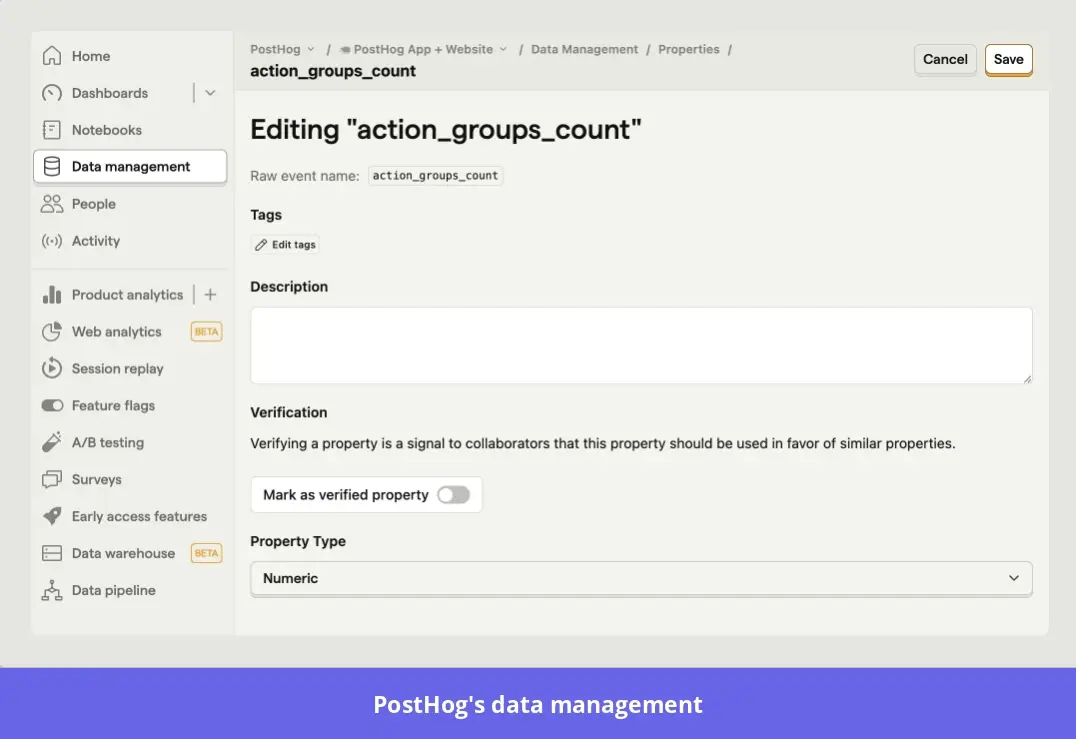
I’d recommend PostHog for engineering teams that want a flexible, low-cost way to get started with event-based analytics. Product teams can explore and understand user behavior with very little manual intervention. However, the responsibility for code-based tracking rests with whoever owns the code, and this user review from G2 highlights why that’s critical.
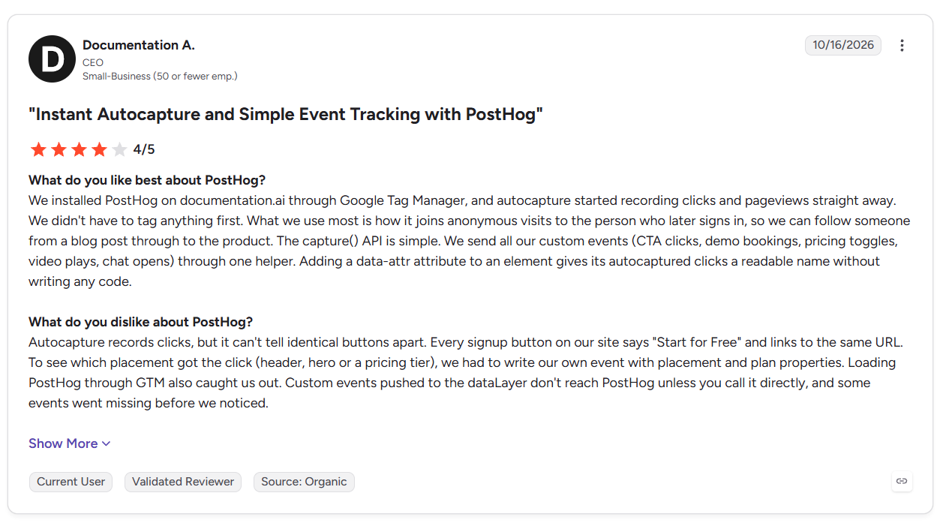
Pricing: Vendr’s median contract value is $58,173. The observed range is $20,125 to $70,000.
The free plan includes 1M events, 5K session replays, and 1M feature flag requests. There’s a pay-as-you-go plan for unlimited usage, where you pay only for what you use.
6. Countly: For self-hosting and full control over data
Countly is one of the first tools I’d look at when data ownership is a nonnegotiable. It’s built for businesses that prioritize data sovereignty, privacy, and control over data storage, making it a natural fit for regulated industries such as healthcare and financial services.
That control starts with deployment. Countly supports on-premise and private cloud deployment, so you can govern both your data and infrastructure. Hosted options exist, but self-hosting gives you the most control over your data at the expense of additional technical upkeep, and I’d budget for that from day one.
Defining events is where Countly differs from most visual tools. Unlike tracking software where you define most front-end events visually, Countly sends custom events through its SDK or API.
Developers implement the relevant tracking calls in the application, so engineering involvement starts as early as event planning and setup. The Data Manager handles event definitions, schemas, and data quality issues.
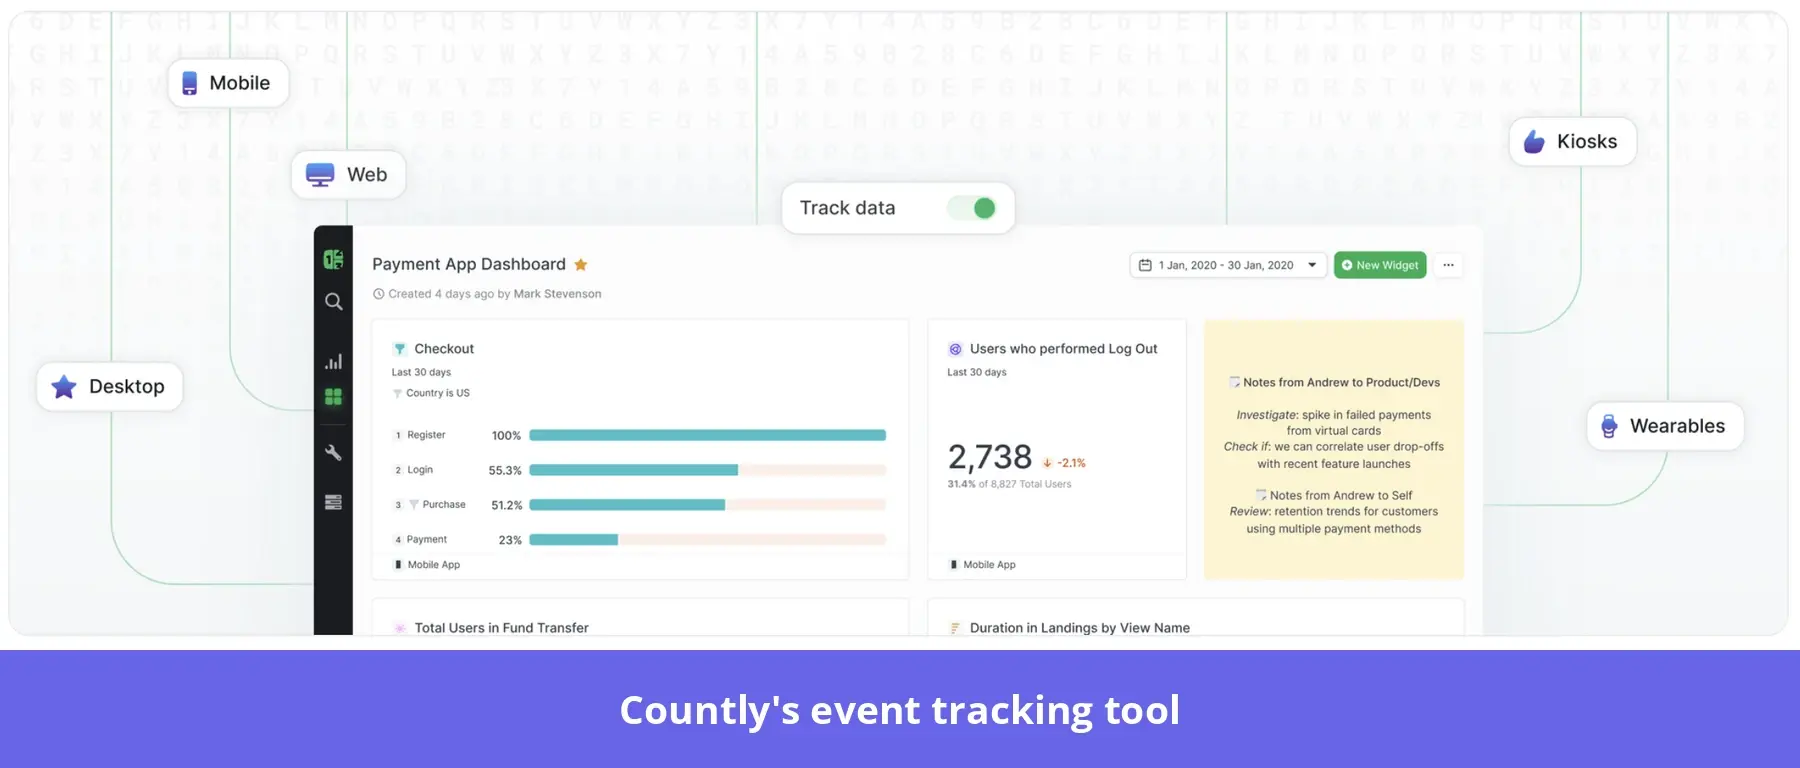
Here’s the detail I’d flag for any product team evaluating this tool: creating an event definition in the dashboard doesn’t automatically start the data collection process. The event still needs to be implemented through the SDK or API.
Pricing: There’s no up-to-date median contract value available online. But you can request a private quote analysis directly through Vendr’s Pricing Benchmarks platform if needed.
Countly’s pricing is on the transparent side, with two tiers: the base Flex plan and an Enterprise plan. The Flex plan starts at $175 per month and includes advanced analytics (real-time, events, sessions, profiles, views, alerts, and dashboards) with your choice of Google Cloud region. The plan is SOC 2 Type II examined and ISO 27001 certified.
The Adaptivity and Intelligence suites are optional add-ons.
7. Hightouch: For collecting events straight into your warehouse
Hightouch is the most technically demanding setup on this list, and I’d recommend it only to businesses that already have an established data management team and data warehouse.
Setup starts with an event specification. You define it and then implement tracking through SDKs or APIs that send behavioral data to your data warehouse. The SDKs are backward-compatible with Segment and RudderStack, so migration can be a small code change.
Setup is only half the picture. The bigger question is what you get once it’s up and running.
Unlike platforms with built-in product analytics tools, Hightouch isn’t a tool that product managers can open to explore dashboards and get answers directly. What it does is collect and route event data for analysis and activation through your existing data infrastructure. That makes it less of a self-serve application.
I’d treat it as infrastructure rather than an analytics tool.
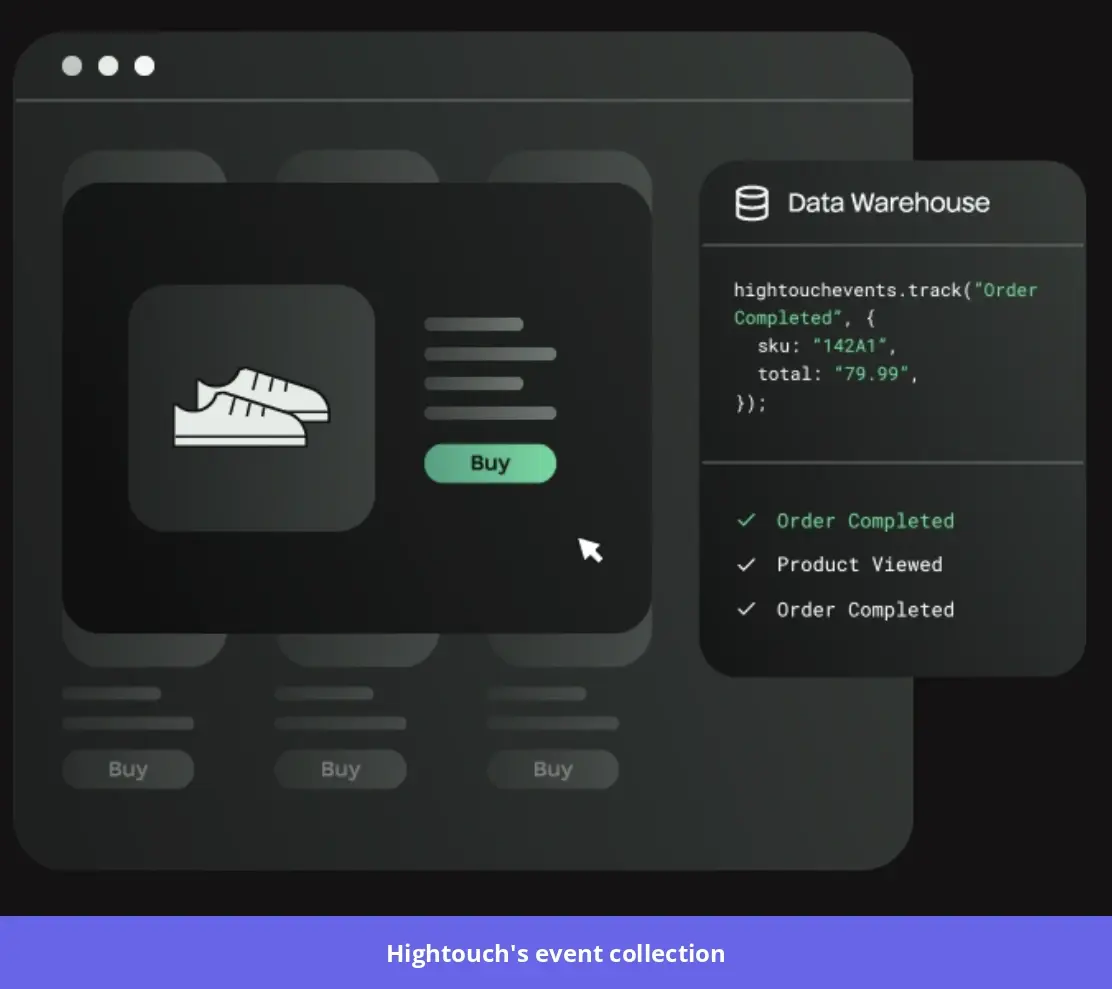
That framing determines who owns the work. Engineering and data teams are responsible for instrumentation, event definitions, and maintaining data quality. Data contracts and monitoring tools help validate event structures and diagnose tracking issues, but they don’t remove the need for technical oversight.
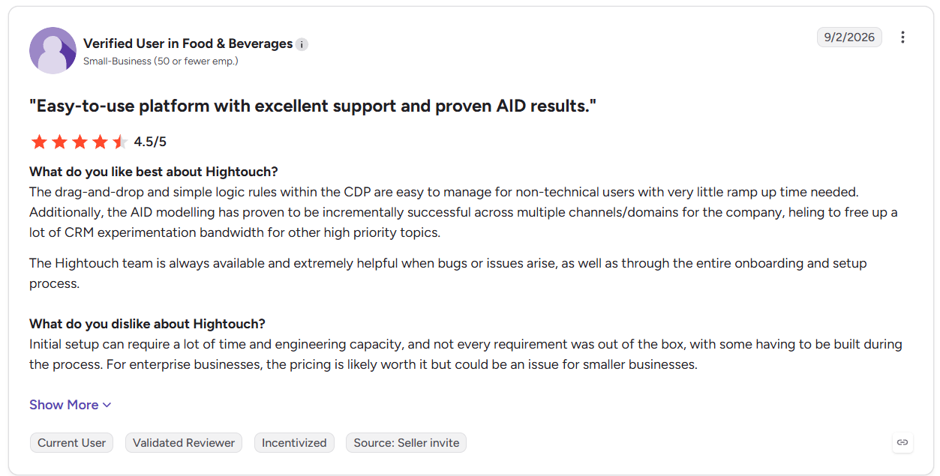
The bottom line: Hightouch gives organizations with a data warehouse and dedicated engineering resources some real flexibility and control over data. But it isn’t a traditional analytics tool, so setup and ongoing maintenance require technical ownership. This user review from G2 demonstrates how that plays out in a real-world scenario:
Pricing: Vendr puts the median contract value at $16,000, with the observed range at $9,600 to $75,000. Hightouch offers a pay-per-use model. Its events module, called Hightouch Events, is part of its Composable CDP platform. You can obtain pricing directly from the sales team.
8. Google Analytics: For website and marketing events
Google Analytics is a familiar choice as a web analytics platform, and I’d keep it for what it does well. For SaaS teams, though, its capabilities for product event analytics are limited.
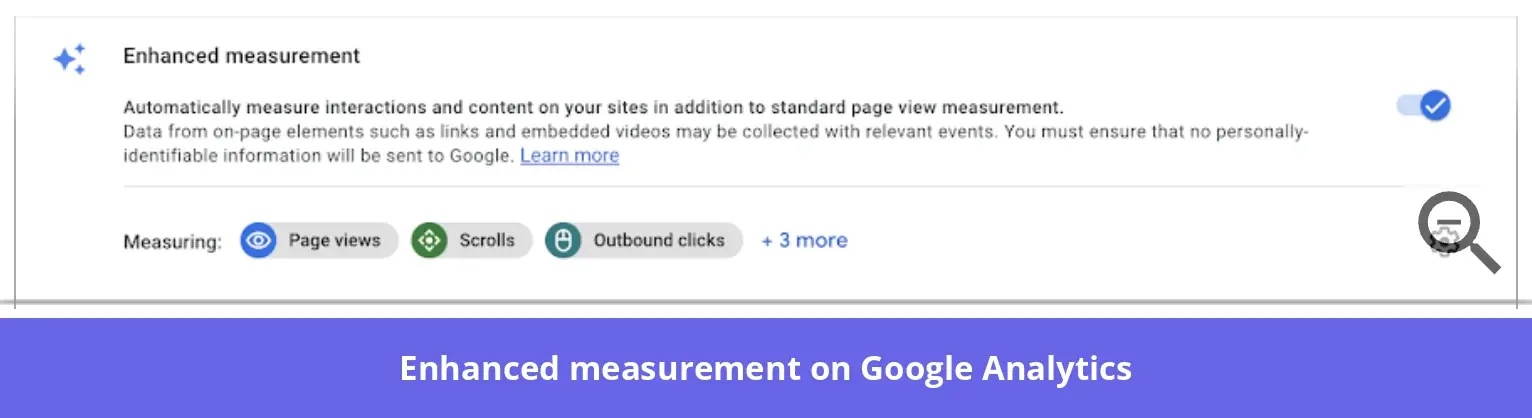
Let’s start with what it does well: Enhanced Measurement. It automatically tracks common event-based analytics for website interactions, including page views, scrolls, outbound clicks, site searches, and form interactions, without requiring additional code. Scroll tracking fires only when a user reaches 90% of a web page, which limits its usefulness for design questions.
Product-specific events are where the work starts. Actions like feature adoption or subscription upgrades need Google Tag Manager or code. Custom definitions don’t cover historical data, so the relevant event parameters must be collected first.
Custom dimensions generally become available for reporting only after registration, so I’d plan those registrations before launch, not after. Standard GA4 properties are limited to 50 event-scoped, 25 user-scoped, and 10 item-scoped custom dimensions.
Google Analytics is great for understanding website traffic, acquisition, and visitor behavior. It’s less suited to deeper understanding of product analytics, such as tracking feature adoption, user journeys, and in-app events across complex product workflows.
Custom tracking capabilities can cover these, but unlike product analytics platforms, this feature requires more planning and technical implementation.
Pricing: Standard GA4 is free. Google offers a custom-priced enterprise version for organizations with higher data volumes and more demanding reporting requirements.
9. Contentsquare: For tying events to heatmaps and session replays
Hotjar is now part of Contentsquare, and its heatmaps, session recordings, and surveys have been integrated into Contentsquare’s broader digital experience analytics platform. I reach for this category when I need to see where users struggle, not just count what they did.
The starting point is easy. Beyond the basic tag, it needs no setup to automatically capture common website interactions, such as clicks, taps, hovers, and form activity. This helps product teams with understanding how users navigate and interact with the product, and identifying friction points.
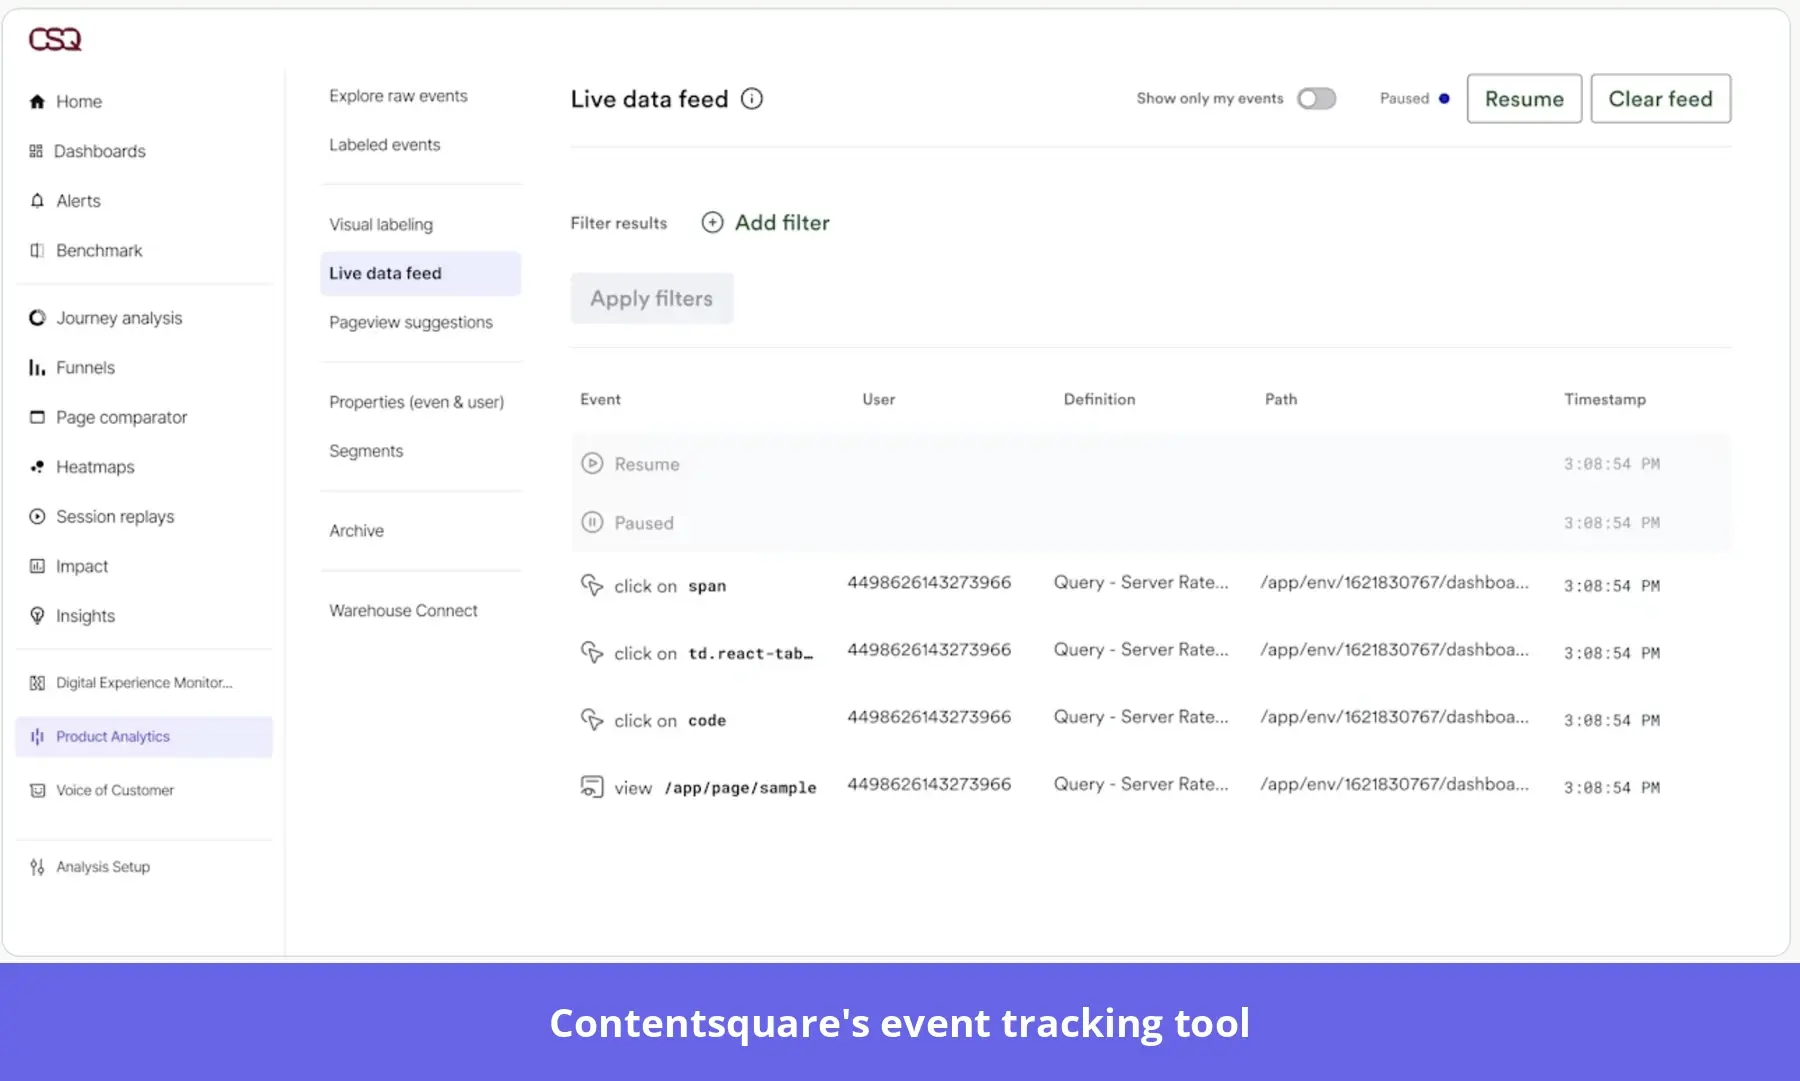
Custom user actions, page events, and variables are set up through tag snippets using Contentsquare’s Tag Configurator, Google Tag Manager templates, or JavaScript, often with help from an implementation manager.
Tag-based setup reduces manual instrumentation in some cases, but you still need to configure tracking rules to ensure the right data gets collected at the right times. Complex tracking requirements may need developer support, as illustrated by this user review from G2:
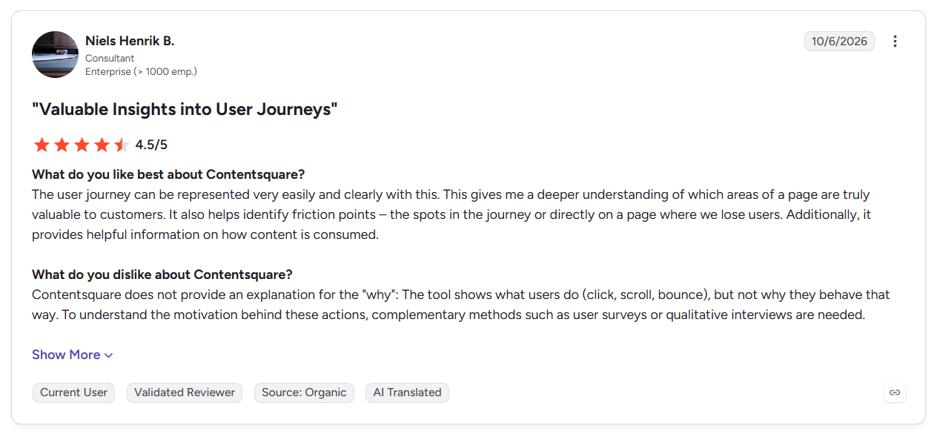
My verdict: Contentsquare is a good choice for understanding digital experiences and diagnosing user friction. Custom tracking needs planning and technical coordination, so it’s a less plug-and-play solution for teams that require an extensive, feature-rich, product-specific event tracking system.
Pricing: Vendr sets the median contract value at $20,000, with the observed range from $14,711 to $91,369. Contentsquare’s plans are usage-based. The free plan covers up to 200K monthly sessions, with heatmaps, funnels, session replays, and basic surveys of up to 100 responses a month.
10. Fullstory: For tagless capture with session context
Fullstory follows an approach similar to Heap’s, and in my experience, that’s a real advantage for design and product teams that can’t wait on instrumentation.
Setup starts with installing Fullstory’s tracking snippet, after which it automatically starts to collect event data in terms of clicks, taps, and page activity. You can then define meaningful events using its visual tools with no developer involvement.
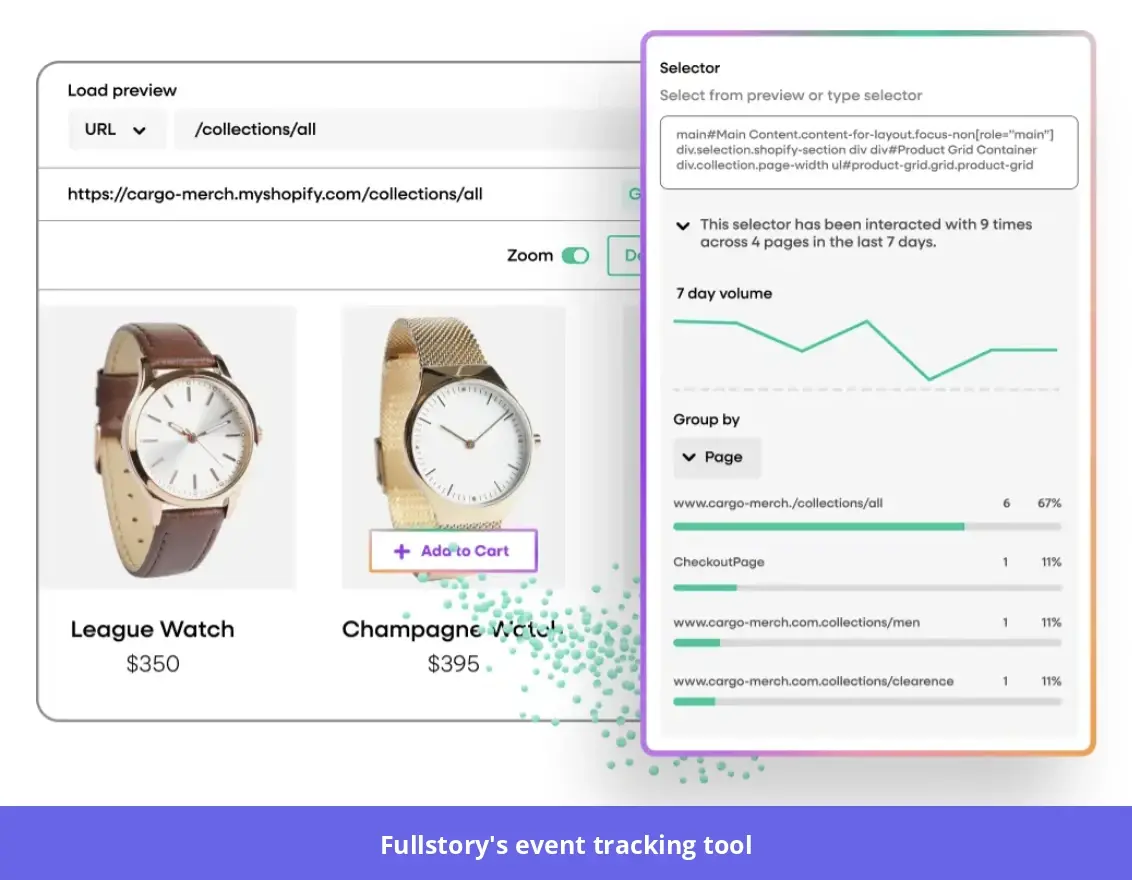
Defined events allow you to analyze feature adoption, build funnels, and investigate past behavior, even when events are defined after the interactions took place. But retroactivity has limits: defined events work in past-data reports and in funnels, but not in Journeys or Data Quality Monitoring. I’d identify where the event needs to appear before basing your analysis on retroactivity.
Developers come back in for the business context that autocapture doesn’t see:
- Autocapture doesn’t capture every business action or provide backend context: Payment completion, subscription plan changes, and account approvals require developer involvement through Fullstory’s JavaScript API or server API.
- Integrations are the other gap: Interface-defined events do not work with older webhook-based integrations, such as Zapier. API-defined custom events can support these workflows, and Fullstory’s newer Activation Streams can send data from user-defined events to webhook endpoints but only on the Advanced and Enterprise plans.
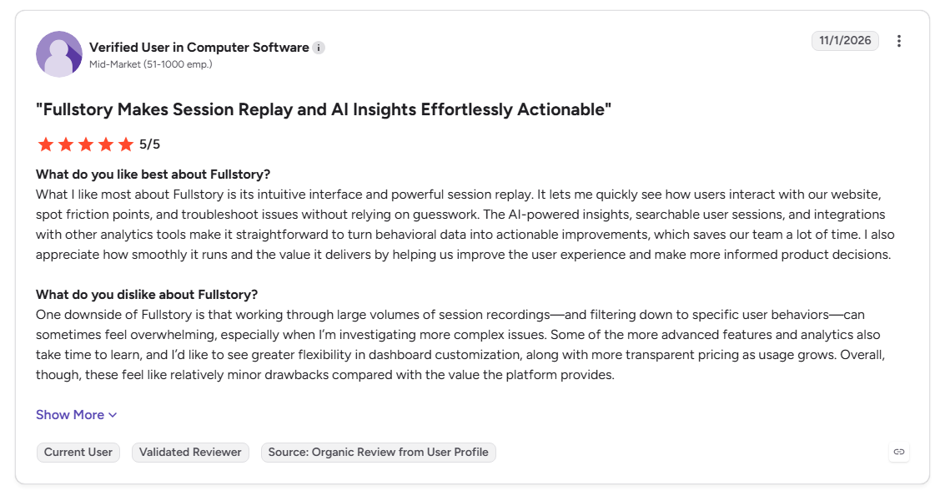
Fullstory is suited for teams that want to explore various user interactions and behaviors and session-level insights without extensive developer support. I’d still plan for technical input on backend tracking, richer business context, and certain integrations. The following user review from G2 highlights the benefits and practical tradeoffs:
Pricing: Per Vendr, Fullstory’s median contract value is $28,240, with the observed range running from $10,000 to $115,936. The free plan includes 30K sessions per month, 12 months of session replay retention, and basic analytics and insights, subject to monthly session capture and retention limits.
11. Matomo: For privacy-first website analytics
I’d point teams to Matomo when the first question is who owns the data. It suits teams that want GA-style website analytics with full data ownership.
That ownership starts with deployment. The On-Premise version lets you host analytics on your own servers while Matomo Cloud offers the hosted alternative.
Event tracking is where the cost of that ownership shows up. Unlike Heap or Fullstory, Matomo doesn’t have a broad autocapture feature. You configure individual events through Matomo Tag Manager or JavaScript code, and tracking only starts once the relevant tags are live.
Tag Manager makes routine tracking more accessible, with visual triggers for interactions like clicks and page views, though complex actions or events that require additional data may need developer intervention.
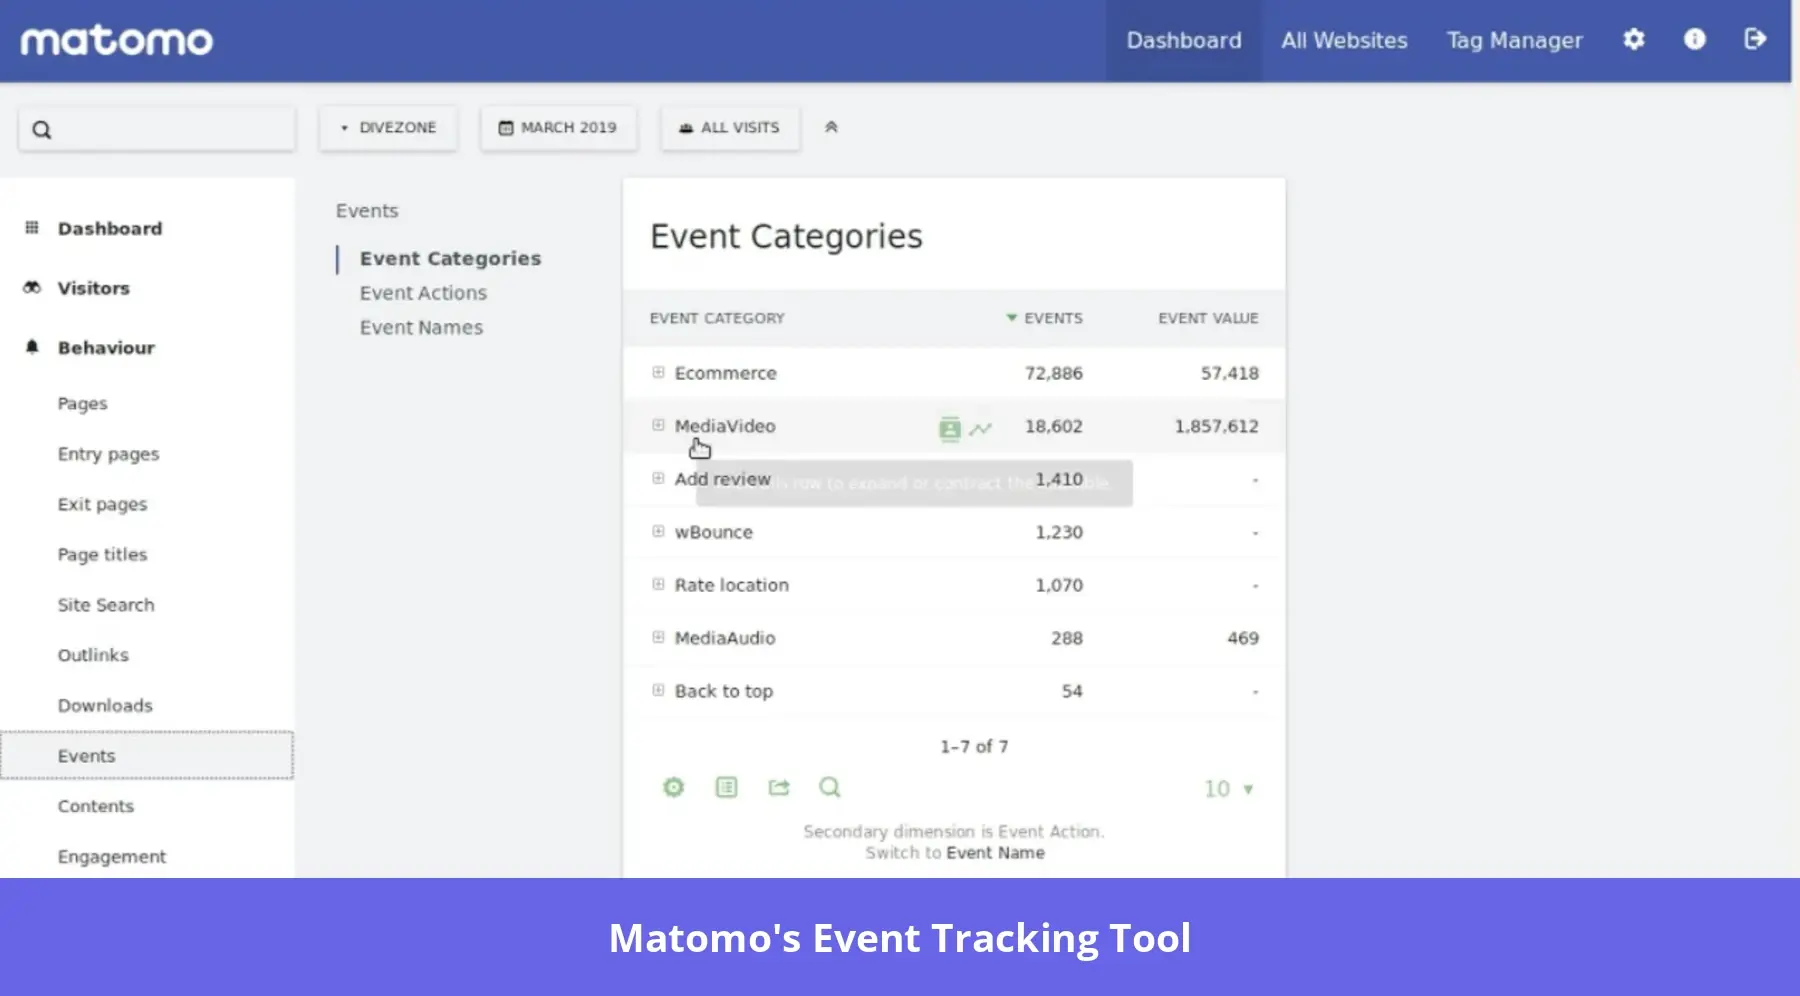
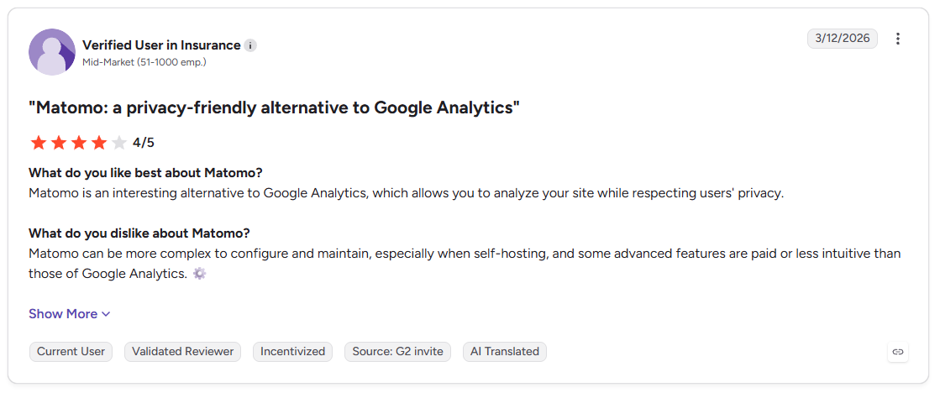
The aspect I’d stress is timing. Matomo doesn’t recover interactions that were never captured, so I’d map out your key events before launch. A G2 user review talks about complexities of configuration and maintenance while highlighting the privacy feature:
Pricing: The On-Premise version has a free Community Plan, with unlimited users and hits. It includes tracking and data collection, reporting, dashboards and visualization, community plugins, and forum support.
Paid plans are available for both On-Premise and Cloud.
Close the loop between event tracking and data-driven decisions with Userpilot
Every tool on this list can get events in. What sets them apart is who names the events, who fixes them when the UI changes, and how long it takes to act on what they show.
With Userpilot, that loop stays with the product team. Autocapture collects interactions from day one, so when you tag a new feature, you can see its adoption from the moment it shipped. Lia suggests names for untagged interactions and flags tags that break after a release, so your event tracking stays accurate without a ticket. And because analytics and in-app engagement share the same events, you can segment users who haven’t used the feature since you tagged it, reach them with a tooltip or checklist, and watch adoption change in the same report.
Book a free demo to see how it works on your own product.
Disclaimer: Userpilot strives to provide accurate information to help businesses determine the best solution for their particular needs. Due to the dynamic nature of the industry, the features offered by Userpilot and others often change over time. The statements made in this article are accurate to the best of Userpilot’s knowledge as of its publication/most recent update on November 19, 2026.
FAQ
What is an event tracking tool?
An event tracking tool records what users do on a website or in an app, such as clicks, form submissions, and feature usage, so teams can measure adoption and find friction.
What is the difference between autocapture and manual event tracking?
Autocapture records common interactions automatically once the tool is installed. Manual tracking means developers add a tracking call for each event, which takes more work but gives more control over what’s captured and the context attached to it.
Can you track events without a developer?
Mostly. Tools with autocapture and visual labeling let you track front-end interactions without code, but a developer still installs the SDK and handles backend events like payments.
What is retroactive event tracking?
Retroactive tracking lets you define an event after the data was collected and still see its past activity, without adding new code.
What is AI data instrumentation?
AI data instrumentation uses AI to set up tracking. Some tools suggest event names from data they’ve already captured, while others scan your codebase and write the tracking code.
Is Google Analytics enough for tracking events in a SaaS product?
For website traffic and marketing, yes. For in-product behavior like feature adoption, a product analytics tool is usually the better fit.
What is the best free event tracking tool?
It depends on what you need to track. GA4 is the standard free option for website analytics. For product analytics, Amplitude, Mixpanel, and PostHog all have free plans with usage limits.
About the author