How to Conduct Qualitative Data Analysis for UX Research


Some of the most valuable UX insights come not from numbers, but from real user stories and experiences. But let’s be real: qualitative data can often feel messy and overwhelming. Unlike product analytics, which offers clear metrics, qualitative research is unstructured and harder to boil down into actionable takeaways.
As a UX researcher, I’ve been there. But over the years, I’ve also found that with the right tools and a solid process, qualitative insights can be just as powerful (if not more) than quantitative research.
In this guide, I’ll cover some key qualitative research methods and walk you through the five-step process I use to analyze qualitative data effectively and make smarter UX decisions.
What is qualitative data analysis?
Qualitative data analysis (QDA) is the process of organizing, interpreting, and making sense of non-numerical data, like survey responses, interview transcripts, and session recordings. The goal is to uncover patterns, themes, and insights that numbers alone can’t explain.
It’s how we understand why users behave a certain way, what frustrates them, and what they actually need from a product.
Qualitative data analysis vs. quantitative data analysis
Qualitative and quantitative analysis differ in their approach, data type, and purpose:
- Purpose: Quantitative research gives you objective measurements of user behavior, while qualitative research explores the thought process and emotions behind that behavior.
- Data type: Quantitative analysis uses numerical data (e.g., the number of users who drop off at a touchpoint). Meanwhile, qualitative analysis focuses on non-numerical, descriptive data (e.g., why users struggle with a feature).
- Data collection: Quantitative data comes from analytics tools, closed-ended surveys, and event tracking, while qualitative data is gathered through open-ended surveys, interviews, focus groups, chats, and session recordings.
- Analysis process: Quantitative insights are visualized with graphs, charts, and statistical measures, while qualitative research involves finding patterns, themes, and user sentiments in the data.
Both methods go hand in hand in UX research. Quantitative data gives you measurable trends, while qualitative insights offer context and depth. But in this article, we’ll focus on qualitative data analysis and how to use it effectively.
What are the 5 qualitative research methods?
When it comes to analyzing qualitative data, I get why some product teams hesitate. Some qualitative research methods can seem overly academic, even a bit intimidating.
But here’s the thing: we often end up borrowing from these methods, even if we don’t realize it. If you’ve ever done a user interview or usability test, you’ve already dipped your toes into qualitative data analysis. So knowing the options available helps you choose the right method for your specific research goals.
Let’s quickly go through five key qualitative research methods and see how each can fit into your UX research toolkit.
1. Content analysis
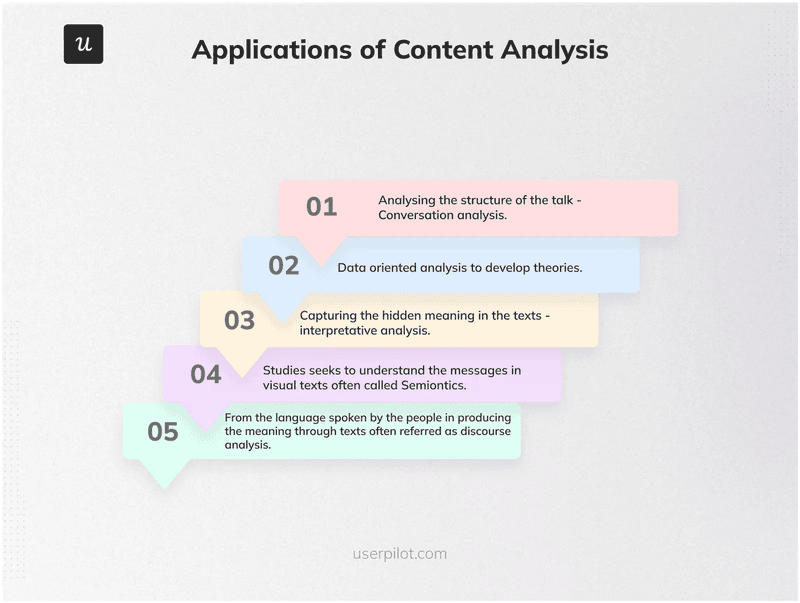
Content analysis means sorting qualitative data (like user feedback or interview notes) into clear categories or labels so that it’s easier to spot patterns.
I find it most useful when dealing with a large batch of open-ended survey responses or customer feedback. It helps me quickly make sense of large amounts of textual data without getting lost in the details.
Here’s how I approach it:
- I skim through all the collected data and highlight frequently mentioned words or phrases (like “hard to navigate” or “slow loading”).
- Next, I group these into meaningful categories (like feature requests or frustrations).
- Finally, I track how often each category appears to see what’s most important to users and prioritize improvements accordingly.
The advantages of the content analysis process
- Helps quickly spot trends in customer feedback and understand user needs.
- Makes qualitative data analysis more efficient and structured once a coding process is in place.
- Doesn’t require expensive qualitative data analysis software, just a clear method for organizing data.
- Works well alongside other qualitative research methods for deeper insights.
The disadvantages of the content analysis process
- Coding qualitative data can be time-consuming, especially with large datasets.
- Might strip away context and lead to misinterpretation.
- Because it reduces data into categories, content analysis could end up oversimplifying UX research findings.
2. Narrative analysis
Narrative analysis focuses on how users tell or narrate their stories, their experiences, emotions, and thought processes. While content analysis breaks down data into categories, narrative analysis looks at the bigger picture.
I find this approach works best when reviewing user interviews, focus groups, or detailed qualitative feedback, where users share personal experiences in their own words. It’s a great way to identify underlying motivations, pain points, and shifts in perception that aren’t always obvious in survey data.
How I do it: I start by looking for patterns in user narratives, especially before-and-after transformations, where users describe how their experience changed (“I struggled with X, but after using this feature, Y happened”). I then analyze tone, emotions, and recurring themes, understand user expectations, and identify gaps in the experience that need improvement.
The advantages of narrative analysis
- Helps identify deep user motivations and emotions by analyzing how users describe their pain points and successes.
- Captures rich, qualitative research data that goes beyond surface-level user feedback.
The disadvantages of narrative analysis
- Is time-consuming, as it requires transcribing, interpreting, and analyzing long-form qualitative data.
- Is difficult to scale; analyzing individual user stories is good for depth but doesn’t always translate well to large datasets.
- Unlike quantitative data analysis, narrative insights can’t be easily measured or replicated, making validation harder.
3. Discourse analysis
Discourse analysis looks at how users communicate, not just what they say. It helps find hidden meanings, biases, and patterns in user conversations, be it in written content (reviews, support tickets) or spoken interactions (interviews, usability tests). This method is super useful when trying to understand how users talk about your product.
I personally focus on word choice, tone, and repetition to gauge frustration levels. For example, “This is a bit confusing” vs. “I have no idea what to do” can show different levels of struggle. I also observe user interactions: are they hesitating, asking for help, or making assumptions? These insights can really help refine product messaging, UI clarity, and the overall user experience.
The advantages of discourse analysis
- Uncovers hidden emotions and attitudes by looking at tone, phrasing, and context, not just words.
- Gives deeper insights into customer feedback, making it easier to spot user frustrations or confusion.
- Reveals patterns in how users communicate, offering a fuller picture of customer feedback.
The disadvantages of disclosure analysis
- Takes time and effort since you have to carefully go through conversations and interpret meaning.
- Focuses only on language, so it might miss broader usability issues.
- Unlike quantitative data analysis, it’s harder to measure or validate with statistical data.
4. Thematic analysis
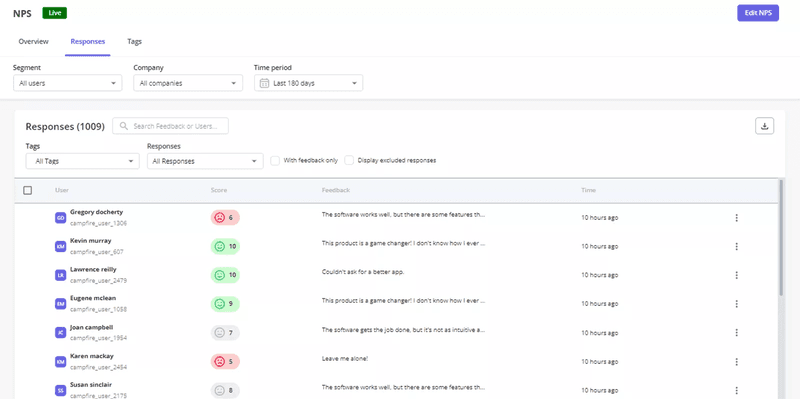
Thematic analysis helps identify themes and patterns in qualitative data by focusing on the meaning behind user feedback. This is common and especially useful for SaaS companies when analyzing NPS survey responses to detect recurring concerns.
As for qualitative researchers, it’s my go-to method for analyzing interview responses and customer feedback surveys to find trends in user behavior and pain points. I start by collecting qualitative research data, then using affinity diagramming to group similar feedback and spot common themes.
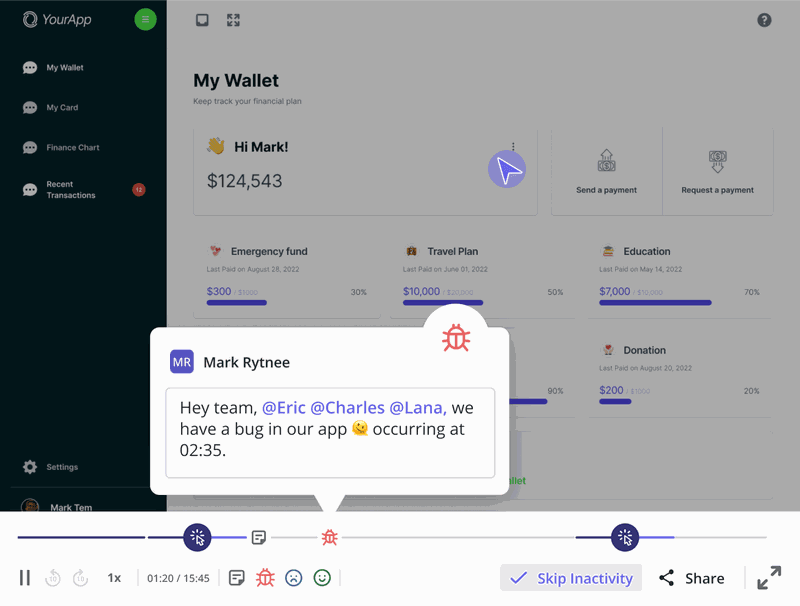
To make this easier, Userpilot lets product teams tag key moments in session replays, leave notes, and discuss insights, all within the platform.
The advantages of thematic analysis
- Anyone can label and organize qualitative research data into themes without formal training.
- Helps turn messy data, like raw survey responses or customer interviews, into structured insights.
- Scales well; can be done manually for small datasets or with AI tools for large volumes of data.
The disadvantages of thematic analysis
- Takes time if done manually since sorting through large data sets can be slow and tedious.
- Themes need to be well-defined: broad or vague categories can make it harder to spot patterns.
- As researchers decide which themes matter, it can be subjective and lead to potential bias.
5. Grounded theory analysis
Grounded theory analysis is a bottom-up approach where insights emerge directly from the data instead of testing preset hypotheses. It’s ideal when there’s little existing research and you need to develop new ideas from scratch.
I find it helpful when trying to understand customer behavior without assumptions. For example, if a product team wants to know why users churn, they can analyze survey responses, interviews, or support tickets and let themes come up naturally.
These patterns can then shape hypotheses that guide product decisions, which is why they’re especially valuable in early-stage research.
The advantages of grounded theory analysis
- Reduces bias by letting insights emerge naturally rather than starting with assumptions.
- Is flexible and adaptable since you can refine findings as you collect more qualitative data.
- Is great for unexplored topics and helps find unexpected insights when prior research is limited.
The disadvantages of grounded theory analysis
- Can feel vague or abstract, as it lacks a structured research framework.
- Requires a lot of critical thinking to analyze non-numerical data without jumping to conclusions.
- Is time-consuming, as it involves continuous data collection and refinement, which might be challenging for fast-moving teams.
Which qualitative data analysis method should you choose?
The right qualitative data analysis method depends on several factors, including:
- Research question: Choose a method that aligns with what you’re trying to learn. If you need to categorize and quantify customer feedback, content analysis works best. If you want to understand how users talk about your product, discourse analysis is more useful.
- Nature of the data: Some methods work better for certain types of qualitative research data. For example, narrative analysis is great for story-driven feedback, while thematic analysis helps find broader patterns across multiple data sources.
- Research expertise: Some methods require more experience or specialized tools. If you’re comfortable with affinity mapping and coding, thematic analysis is a strong choice. If you’re new to qualitative research, content analysis is a simpler starting point.
- Time and resources: Some qualitative methods take longer than others. Narrative analysis is time-intensive because it requires breaking down individual user stories, while thematic analysis is more scalable and works well for large datasets.
For the UX research process, the go-to method is thematic analysis; it’s flexible, scalable, and highly effective for analyzing survey responses, usability test feedback, and interview transcripts.
How to perform qualitative data analysis in 5 steps?
Keep in mind that qualitative data analysis can be as simple or as structured as you need it to be.
If you’re just looking for quick insights to improve a product, you can start by gathering all available qualitative data, filtering out the noise, and analyzing it for trends.
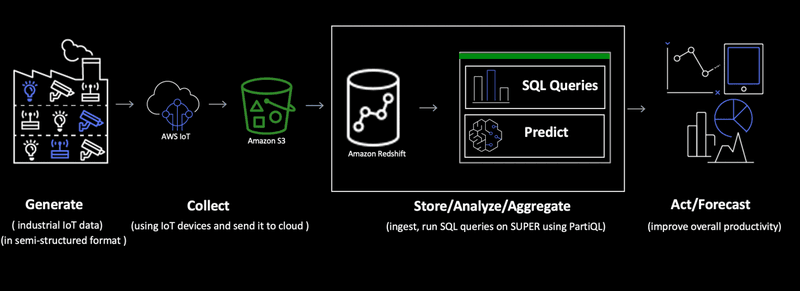
For example, a data-driven approach might involve:
- Pulling qualitative feedback from a Snowflake database or customer support logs.
- Filtering and structuring the data in Excel or Redshift to clean up inconsistencies.
- Labeling data for themes, either manually or with AI-powered tools.
- Analyzing common themes to find recurring user pain points or feature requests.
- Visualizing insights in dashboards or reports to help teams make decisions.
But when you’re conducting qualitative data analysis in UX research, the process is more intentional. Here’s the five-step framework I follow:
- Define research questions for your qualitative analysis.
- Gather your qualitative data.
- Organize and categorize collected qualitative research data.
- Analyze qualitative data for common themes and patterns.
- Leverage insights for making impactful changes.
Let’s break down each step in detail.
Step 1: Define research questions for your qualitative analysis
Before getting into qualitative data collection, it’s important to get clear on what you’re actually trying to learn. A well-defined research question keeps your analysis focused and helps you pull out useful, relevant insights instead of just going through scattered feedback.
I always start by asking: “What exactly do we need to understand?” The way you frame this question shapes what data you collect, how you analyze it, and the decisions that follow.
Here are some examples of strong research questions:
- What are the biggest reasons behind customer dissatisfaction?
- How do specific user groups feel about our new feature?
- What are our customers’ needs, and how do they differ by segment?
- How do our products fit into our customers’ daily lives?
- Why is Feature X seeing low adoption?
To make this step collaborative, I like using Miro or FigJam to brainstorm and structure research questions. Creating virtual post-it notes lets the product research team contribute ideas, refine questions, and align priorities before getting into data collection.
Step 2: Gather your qualitative data
Once I’ve defined my research question, the next step is to collect qualitative data from different sources.
I start by checking existing data first. This could be customer feedback, support tickets, or data stored in a company’s data warehouse. Reviewing what’s already available helps me avoid redundant research and spot recurring issues faster.
But often, I need to dig deeper, so I collect new data through:
- In-app surveys: Triggered at the right moment (like after a key action), these capture real-time feedback from active users, not just account managers.
- Email surveys: While response rates can be lower, they’re great for reaching inactive users who aren’t engaging with the product.
- Review sites: Platforms like G2, Capterra, or Clutch are goldmines for honest, unfiltered customer opinions that highlight pain points and feature requests.
- User interviews: One-on-one conversations allow for deeper insights. I can also ask follow-up questions and help users articulate challenges they might struggle to explain in a survey.
- Focus groups: Moderated group discussions can offer rich customer insights, but they aren’t always scalable for fast-moving teams.
For qualitative research, I rely on Userpilot to run surveys and recruit participants for user interviews and usability tests. One of the best things about Userpilot’s targeting feature is its ability to reach the right users for a specific research goal.

For example, when we wanted to improve our CRM integrations, we used Userpilot’s in-app surveys to target users with a Salesforce or HubSpot integration. We focused on those in Sales or Marketing roles to ensure we gathered only relevant qualitative data. This helped us avoid feedback from users who weren’t part of our target segment.
Step 3: Organize and categorize collected qualitative research data
Before jumping into feedback analysis, I always start by organizing unstructured feedback in one place. One simple way to do this is by creating a spreadsheet where all qualitative research data is grouped by research questions. Within each question, I then sort responses into themes or categories based on common topics.
To streamline this process, I use Userpilot’s NPS response tagging to group similar feedback automatically. For example, if multiple users report technical issues, I tag their responses as “bug”.
Step 4: Analyze qualitative data for common themes and patterns
When I’ve gathered all my qualitative research data, the real work begins: making sense of it all.
If I’m working with large qualitative data amounts without a specific research question, I use a method called coding to structure information. Coding means assigning labels or tags to different parts of the data based on common topics.
For example:
- Multiple users reporting technical glitches? I tag those as “bugs.”
- Someone says the navigation is confusing? That’s “UX friction.”
- Users asking for a missing feature? I file that under “feature request.”
Identifying themes is just the first step. I also track patterns: how often these issues occur, when they happen, and which user segments are affected. For example, if enterprise users frequently mention a missing integration, that’s a bigger priority than a request from just one or two users.
When analyzing surveys, usability tests, or interview responses, I take a different approach:
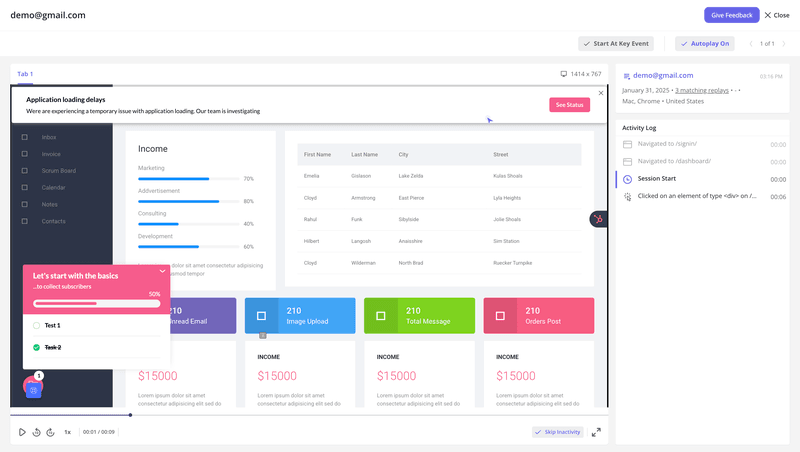
- Watching back session recordings: During interviews or tests, I’m focused on asking the right questions, not scribbling down every detail. So, I always go back and watch the recordings to catch anything I missed.
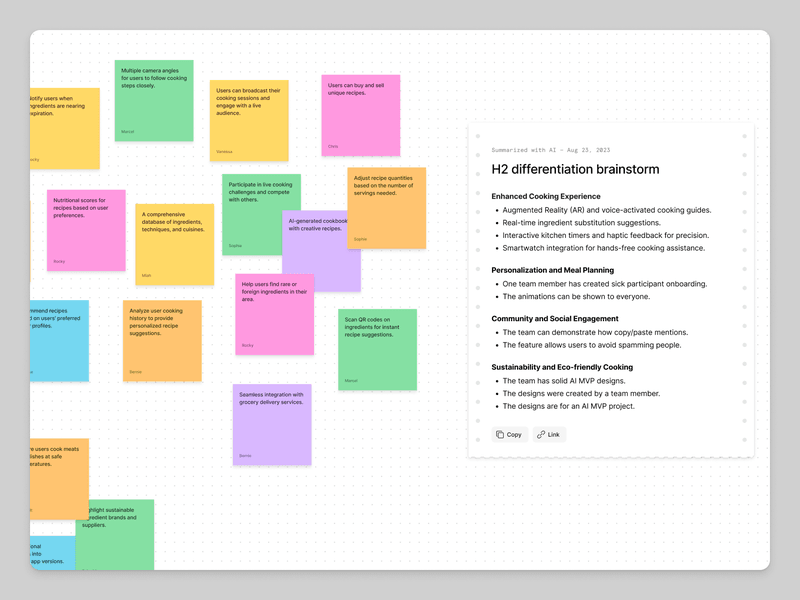
- Use FigJam to organize my notes: I jot down the big takeaways and make virtual post-it notes for each insight. Then, I group them under the related research question.
- Capturing unexpected insights: Sometimes users mention things outside the original research scope. Instead of ignoring them, I log these separately so they don’t get lost.
- Using affinity mapping: Once I’ve gathered insights from multiple participants (usually 5), I group common sentiments and behaviors to identify broader themes.
By taking this systematic approach, I make sure my qualitative research isn’t just a collection of random observations, but a comprehensive analysis that leads directly to steps I can take.
Step 5: Leverage insights for making impactful changes
Once I’ve analyzed the data and found key patterns, the next step is turning those insights into action.
Now, how we act on feedback depends on what the data is telling us. Sometimes, the solution is as simple as improving feature discovery. Other times, it requires more complex product changes.
Let’s say users keep requesting a feature that already exists, they’re just not finding it.
Instead of building something new, the real solution is to improve onboarding, in-app guidance, or UI clarity so users can discover what’s already available. On the other hand, if feedback shows a clear gap in functionality, it’s important to dig deeper before rushing to build something new.
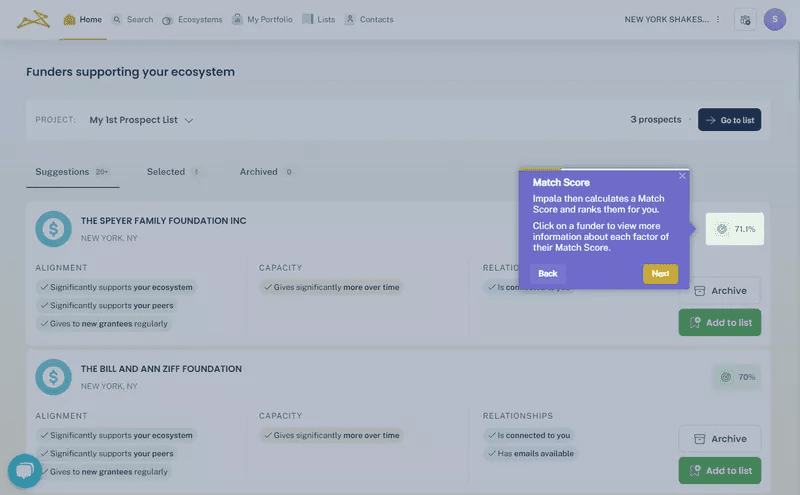
One great example of this approach is Impala, a SaaS company that was struggling with low adoption of key features because users simply weren’t aware of them. Instead of assuming the product needed more features, Impala used Userpilot’s in-app guidance tools to surface the right features at the right time. By placing contextual tooltips and onboarding flows, they improved feature adoption without making big development changes.
This is why I always prioritize qualitative research data in product decisions. It helps us focus on what really user problems in UX actually need fixing instead of just guessing what users want.
What are the benefits of qualitative data analysis?
Now that we’ve gone through the step-by-step process, let’s talk about why qualitative data analysis is so valuable in UX research.
Here’s how qualitative data analysis helps:
- Uncovers deeper insights: Instead of just tracking user behavior, qualitative analysis helps you understand the deeper reasons and thought processes behind their actions. This makes it easier to identify issues and solve complex UX challenges.
- Gives flexibility in research: Unlike hard data, qualitative analysis lets you adjust your approach as you go. When users bring up unexpected pain points during research, you can explore them further instead of just sticking to a fixed framework.
- Provides context to numbers: Quantitative data can show a drop in feature usage, but qualitative analysis explains why users are struggling. Are they confused? Do they not see the value? This contextual understanding is key to making informed product decisions.
- Gives users a voice: Instead of guessing what users want, you hear their experiences firsthand. This ensures that your UX decisions are based on actual needs, not just assumptions.
What are the challenges when conducting qualitative data analysis?
While qualitative data analysis is incredibly valuable, I admit it’s not always easy. Unlike easy-to-measure numbers, qualitative research data can take up a lot of time and energy and is much harder to validate.
Here are some of the biggest challenges of working with qualitative research in UX:
- Data overload and organization: Between survey responses, interview transcripts, and session recordings, qualitative research data can quickly pile up. Keeping it structured and manageable takes effort, especially when you’re dealing with multiple data sources.
- Reliability and bias: Because qualitative analysis is up to interpretation, results can sometimes be influenced by personal biases or inconsistencies in how data is categorized. Unlike quantitative data analysis, there’s no one “right” way to analyze the findings.
- Time-consuming process: Coding, categorizing, and synthesizing data takes time. Unlike numerical analysis, you can’t just plug qualitative data into a formula and get instant answers. The process is iterative, meaning you’ll go back and refine your insights multiple times.
One way I streamline qualitative research, especially in usability testing, is by focusing on a small but diverse sample size.
A well-accepted best practice in UX research is to test with 5 users. Studies show that after 5 participants, you’ll uncover around 80% of usability issues, including all the major pain points.
That said, I always make sure to diversify those 5 users as much as possible. I look at things like:
- Their level of familiarity with the platform.
- Whether they’ve used similar functionality before.
- Their role or use case.
This helps me ensure that insights aren’t just focused on one user type but reflect a broader range of perspectives.
Overcome qualitative data analysis challenges with Userpilot!
Qualitative data can be packed with valuable UX insights. But honestly, without the tools to help you put it all in context, it can be a huge mess to wade through.
That’s where Userpilot helps. With session replays, in-app surveys, and event tracking, you get a clear picture of both user behavior and mindset in one place. Instead of sifting through qualitative data, it lets you spot patterns faster and understand user pain points better, so you can focus on improving user experience, not just analyzing it. To see it in action, book a Userpilot demo today!
FAQ
What are the 4 components of qualitative data analysis?
The four key components of qualitative data analysis are case identification, document analysis, surveys, and semi-structured interviews. These methods help researchers collect, organize, and interpret non-numerical data to uncover patterns, themes, and insights that inform product and UX decisions.
What is purposeful sampling in qualitative data analysis for UX research?
Purposeful sampling is a method used in qualitative research to select participants based on specific criteria relevant to the study. In UX research, this means choosing users based on their experience level, roles, or behaviors to gain insights from the most relevant user groups rather than a random selection.
What are common mistakes in qualitative data analysis?
Common mistakes in qualitative data analysis include poor data organization, failing to define clear research questions, confirmation bias, and overgeneralizing findings from a small sample. To avoid these, researchers should use structured analysis methods, diverse participant samples, and systematic coding to ensure reliable, actionable insights.
About the author