Mixpanel Analytics In-Depth Review [+ Better Alternative]

![Mixpanel Analytics In-Depth Review [+ Better Alternative] cover](https://blog-static.userpilot.com/blog/wp-content/uploads/2023/11/mixpanel-analytics-in-depth-review-better-alternative_e82a9acd5f1883b860975a3f945a9ef1_2000-1024x670.png)

Mixpanel is a powerful real-time analytics platform that helps companies measure and optimize user engagement.
Mixpanel is an app used for tracking customer behavior. It provides insights into your product usage and user behavior to help you make data-driven decisions and improve your products.
Mixpanel Analytics vs Google Analytics
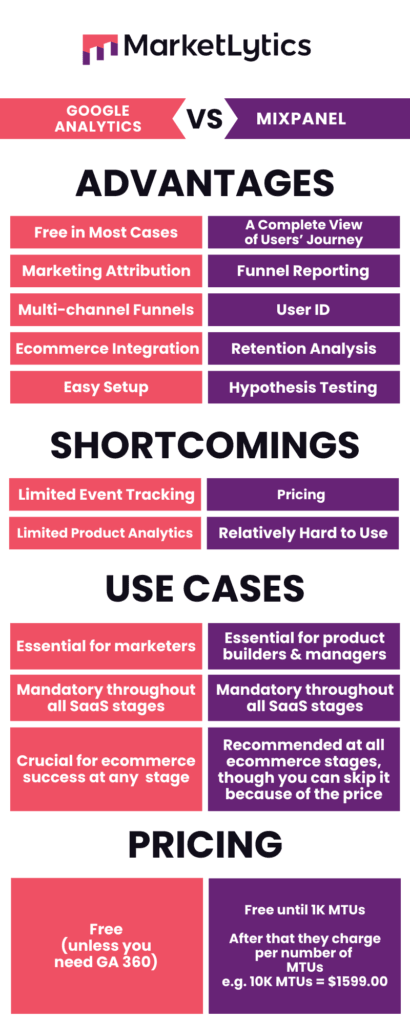
Both Mixpanel Analytics and Google Analytics are popular analytics tools available for SaaS companies. While Mixpanel is a product analytics tool, Google Analytics is more of a traffic attribution tool.
Mixpanel makes you understand user behavior and interactions with your product. It helps you keep track of button clicks, scrolling, and navigation within your product. You get better insights into the health of each account, product usage, and churn possibility.
Google Analytics is an excellent tool for tracking website traffic and conversions. With it, you can better track your website visitors’ arrival, navigation, and page duration. Its easy integrations with other marketing tools allow you to track marketing data more efficiently. You can also learn about relevant keywords and strategies for better SEO results using it.
This comparison chart between Google Analytics and Mixpanel can give you more details about the differences.
Why do product managers need Mixpanel Analytics?
Every product manager needs to track user behavior and product usage data to build a better product.
Mixpanel Analytics can help you do that in just a few clicks. Here’s what it can do:
- Track user behavior to identify the most popular features that improve customer satisfaction, address points where customers are facing obstacles, and streamline the processes in your product.
- Collect product usage data across different cohorts (e.g. trial users and paying customers) and identify patterns in your product engagement. Allowing you to test new features and product experiences and make data-driven improvements.
- Insights Report
- Funnels Report
- Flows Report
- Retention Report
- Which user segment has the highest retention?
- What actions are most common among active users?
- What marketing campaigns get more sales?
- How often are users finding value?
- Tracking what percentage of users completed signup within 7 days.
- Spot the primary drop-off point in the signup process.
- Learn if your A/B test impacted signup conversions.
- Watch how conversion rates change for the US payment funnel over time.
- Calculate the average time users take to complete the payment process.
- Which paths do power users follow most frequently?
- Where do users abandon key flows like checkouts?
- What are the most common actions users perform after opening the app?
- What actions lead to more engagement?
- Watch how many users return after their first week.
- Find out which cohort of users has the highest retention rate
- Learn what features retain more users.
- See how many users are still using a core feature after a week.
- User segmentation: Mixpanel’s segmentation tools allow you to group users based on attributes like demographics, behaviors, or interactions within your product. For example, you can segment users by the frequency of product usage or their last interaction with a specific feature.
- User cohorts: It groups users based on who signed up in the same week or interacted with a feature during a specific time period. It’s particularly useful for, for example, assessing how new users interact with your product compared to long-time users.
- Behavioral analytics: Mixpanel provides detailed reports that show how users behave throughout their journey.
- Custom dashboards: With Mixpanel, you can create custom dashboards to monitor key metrics and track user behavior across various user segments. You can easily share dashboards across development, marketing, and customer success teams for seamless collaboration.
- Event tracking: Mixpanel allows you to track any event a user performs within your product—whether it’s clicking a button, making a purchase, or completing a sign-up form.
- Custom events properties: You can also track not just when a user clicks a button, but also on which page, under what conditions, and with what accompanying actions. This helps you identify patterns that lead to conversions and optimize features based on real usage.
- Real-time analysis: This is particularly valuable during product launches, A/B tests, or marketing campaigns, where real-time feedback can guide quick adjustments to increase success.
- Cross-event comparisons: Mixpanel allows you to compare how different events relate to each other over time, such as how a user’s first purchase influences their likelihood to interact with other features later on.
- Signal: Mixpanel’s Signal app helps identify user events and actions that correlate most strongly with key business metrics, such as retention or conversion rates. This allows you to optimize the product experience to incentivize engagement, upgrades, etc.
- Impact: Impact is designed to track the effect of new features or updates on engagement, retention, and other key metrics over time. This way, you can prioritize the development of features and updates that have the highest impact.
- Experiments (A/B testing): It enables you to compare different product variants to determine which version best achieves your goals. This helps you iterate quickly and base decisions on evidence.
- JQL (JavaScript Query Language): For advanced users, Mixpanel offers JQL, a custom query language that allows teams to pull highly specific data sets and perform complex analyses.
- Revenue: Mixpanel’s Revenue app helps track and analyze user purchase behavior over time. It’s great for optimizing pricing strategies, identifying upsell opportunities, and improving customer lifetime value (LTV).
- Has a lot of features and can analyze data in great detail by breaking it down into smaller parts.
- Lets you quickly make informed decisions thanks to its powerful and clear visuals.
- Highly customizable, allowing you to build exactly what you need.
- The free plan works well for small SaaS businesses, but enterprise-grade features can be expensive depending on your needs.
- Your engineering team will need to set up and configure the tool.
- It can take some time to decide which user actions are the most important.
- Databox
- Google Cloud
- Figma
- Productboard
- ABTasty
- Chameleon
- Help Scout
- Segment
- Starter: Free
- Growth: Starting at $24/month
- Enterprise: Starting at $833/month
- Auto-capture events: Unlike Mixpanel, Userpilot includes auto-capture functionality, which tracks user interactions with your app automatically. This eliminates the need for manual event tracking setup, so you can begin analyzing user behavior and gathering insights from day one.
- No-code event labeling: Userpilot allows you to easily label auto-captured events without needing to code. Once an event is labeled, you’ll instantly have access to insights from retroactive analytics.
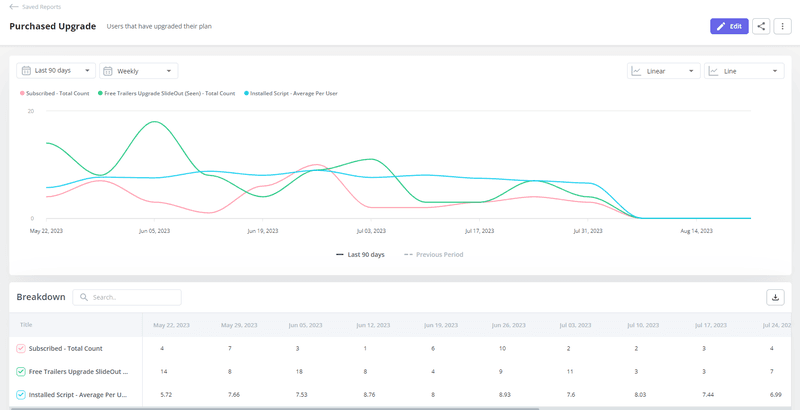
- No-code reports (funnel, path, trend, retention): Userpilot lets you build key reports—like funnel, path, trend, and retention—quickly and without technical expertise.
- No-code dashboards: You can build custom dashboards or choose from pre-built templates to track your product’s performance. Dashboards can be tailored to monitor the key metrics most relevant to your business, helping you keep a pulse on user engagement, feature usage, and conversion rates.
- Starter: The entry-level Starter plan is priced at $299/month, billed annually. It includes up to 2,000 Monthly Active Users (MAUs) and features like segmentation, product analytics, reporting, in-app user engagement, NPS surveys, and UI customization.
- Growth: The Growth plan uses custom pricing and includes features like resource centers, advanced event-based triggers, unlimited feature tagging, AI-powered content localization, EU hosting options, and a dedicated customer success manager.
- Enterprise: The Enterprise plan uses custom pricing and includes all the features from Starter + Growth plus custom roles/permissions, access to premium integrations, priority support, custom contract, SLA, SAML SSO, activity logs, security audit, and compliance (SOC 2/GDPR).
Main use cases of Mixpanel analytics
Let’s explore what are the main use cases of Mixpanel analytics features:
Mixpanel marketing analytics
Mixpanel helps you track multiple acquisition channels while tying marketing data to product performance and user engagement.
It can measure the return on ad spend of every campaign and includes features like multi-touch attribution and identity resolution. With this, marketing teams can work closely with product teams to understand what are the most effective touchpoints in the journey.
Mixpanel website analytics
Mixpanel’s website analytics are an upgrade from GA4. It offers detailed insights into how users interact with your website by tracking user flows, conversions, and drop-offs.
It also enables granular analysis of key metrics like bounce rates, page views, and session durations, which helps refine website content and UX design.
Breakdown of Mixpanel analytics reports
Beyond marketing and website, Mixpanel Analytics also provides various reports to help businesses gain insights into user behavior and product performance.
Here’s a breakdown of the main report types:
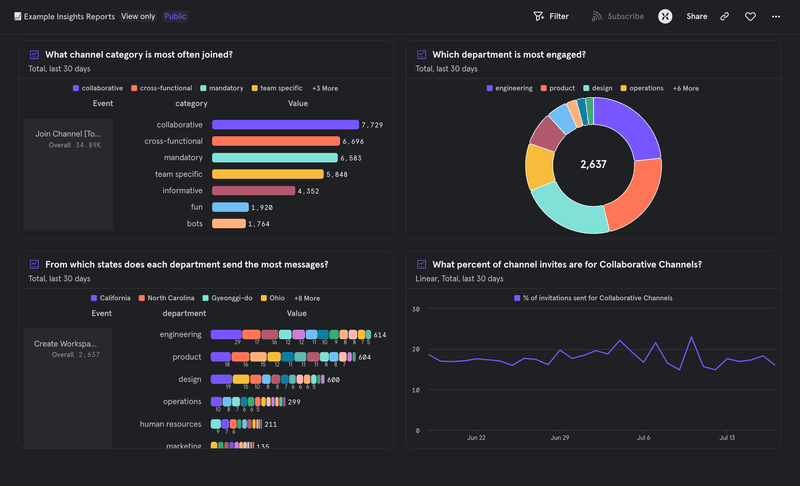
Insights report for segmenting and filtering event and user counts
The insights report is designed to analyze user properties and actions to get a granular view of how different user segments interact with your product.
It helps you answer questions like:
Note: It might not be the most friendly tool for non-technical users. For instance, the Y axis of charts can’t be labeled (you need to already know what it’s showing), can’t add colors to metrics, there are no filters that apply for specific reports (making it hard to compare reports with different filters), and it can’t yet create charts without having time in the X axis.
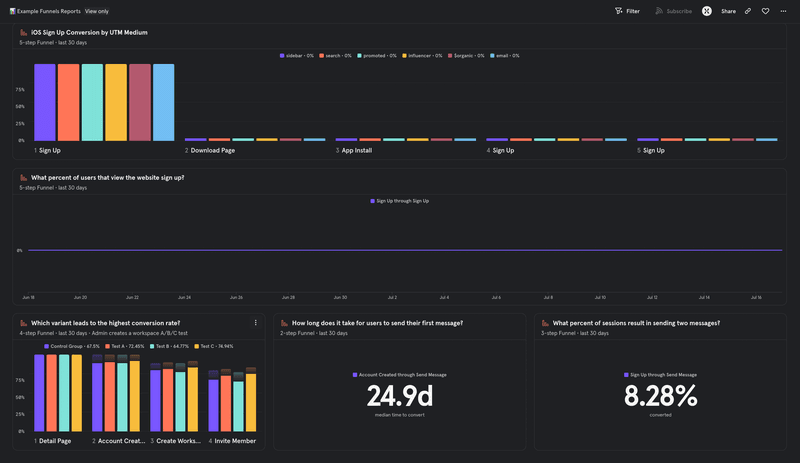
Funnels report for understanding conversions and drop-offs
The funnels report lets you analyze how users move through specific sequences of actions, making it ideal for tracking conversions and identifying drop-off points.
It’s perfect for:
But beware, creating overly complex funnels can sometimes make insights harder to find. For instance, Mixpanel doesn’t register unique users who completed a funnel if they didn’t complete it in the past, and you can’t use the “hold property constant” option with custom properties in the funnel report.
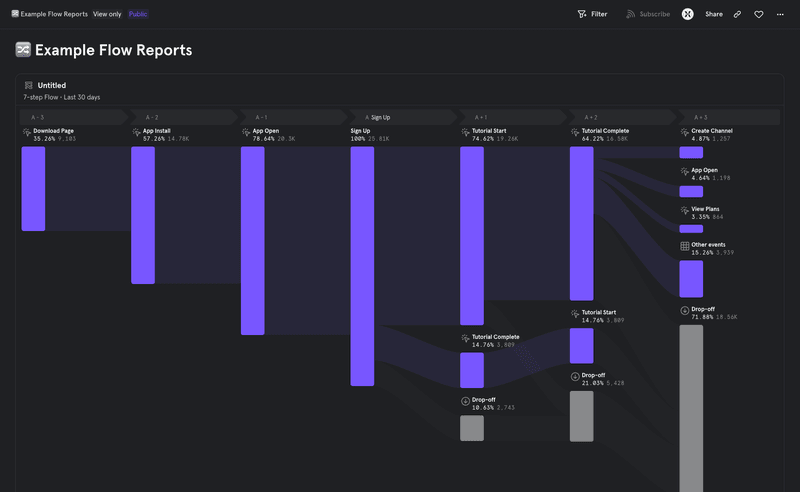
Flows report for exploring paths between user actions
The flows report helps you visualize the various paths users take within your product, whether it’s navigating between different pages or completing specific actions.
It’s great for identifying where people get stuck and fixing problems that might be stopping users from performing your desired actions.
It can answer questions like:
This report is excellent for understanding overall user behavior. But, the report’s screen can be too confusing and unorganized, making it hard to export data and analyze a specific flow smoothly.
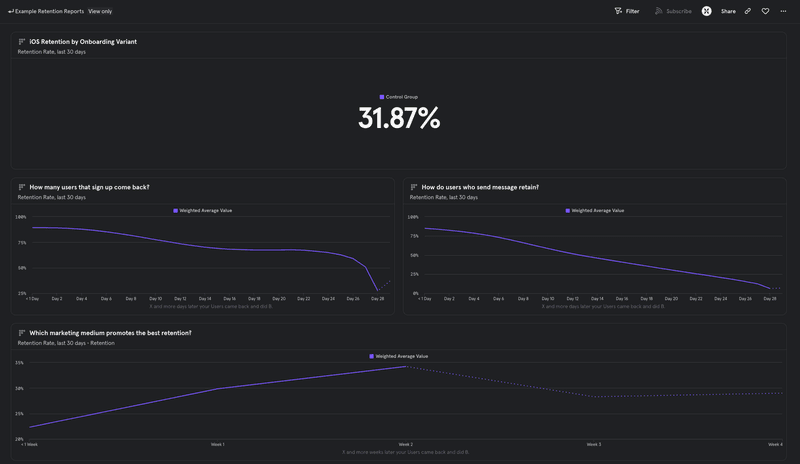
Retentions report (also known as cohorts) for assessing stickiness
The retention report, also called the Cohorts Report, is a chart that segments users in different cohorts and tracks their retention over time.
It helps measure how well you retain users over time, as well as spotting sticky features that correlate with more engagement.
It’s especially useful to:
This cohort analysis report is powerful for understanding long-term engagement. Just note that it can get messy after multiple projects, making some bugs happen such as filters not saving correctly (having to readjust later).
Breakdown of Mixpanel’s user analysis
Mixpanel’s user analysis features allow businesses to gain a deeper understanding of their users’ behaviors, preferences, and engagement patterns.
Here are some Mixpanel features that can help you with this:
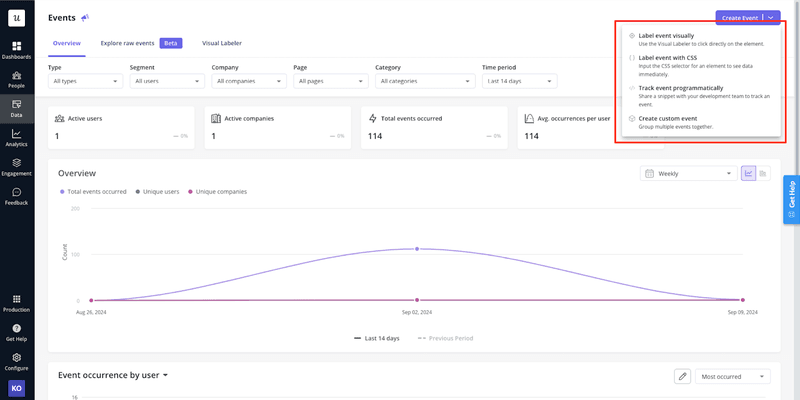
Breakdown of Mixpanel’s event analytics
Event analysis is at the core of Mixpanel’s powerful analytics platform. It helps you understand what key events lead to engagement, conversions, or drop-offs.
Let’s break down Mixpanel’s key event analytics functionalities:
Other Mixpanel apps for product analytics
Beyond user and event tracking, Mixpanel offers additional applications to enhance your product analytics.
These apps are designed for identifying impactful events, measuring the impact of changes, and running experiments. They include:
Pros and cons of Mixpanel
Like any other tool, using Mixpanel also comes with both advantages and drawbacks. Let’s have a look at them.
Mixpanel pros
Mixpanel cons
Mixpanel integrations
One of the key features of Mixpanel is its ability to integrate with other software platforms and data sources. Its integrations with leading software make connecting your existing tools to the platform easy.
Mixpanel can also read directly from your data warehouses and data lakes. It means, for example, that you can stream events directly from your apps and servers using a customer data platform (CDP) or Mixpanel SDKs.
Here are some of the apps with native integration with Mixpanel:
Mixpanel pricing
Mixpanel offers transparent pricing with the flexibility to build your plan according to your needs. They provide three pricing tiers:
Userpilot: A better alternative to Mixpanel analytics
We have gone through Mixpanel Analytics and what you can achieve with it. But if you are looking for something better, Userpilot can offer you better value for money than Mixpanel.
Userpilot is a versatile, code-free marketing, product analytics, and customer feedback tool for SaaS businesses. It helps you analyze product usage and collect user sentiment to create personalized in-app experiences that enhance user interaction.
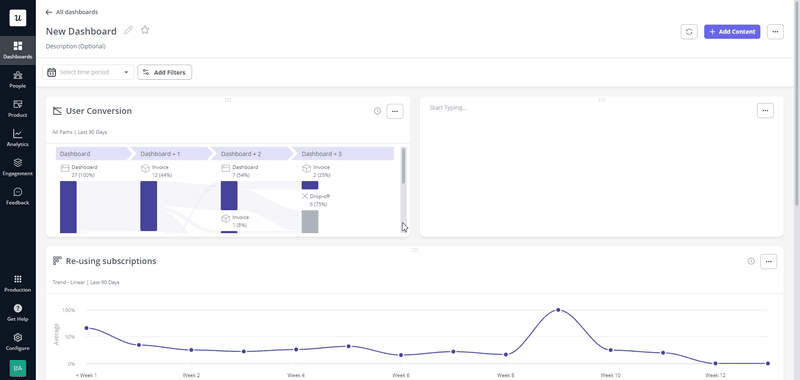
Userpilot analytics functionality
One of the best parts about Userpilot is that it offers comprehensive analytics functionality with a wide range of features. Let’s go through its key features to understand what value it can add to your product’s improvement.
Userpilot pricing
Userpilot’s transparent pricing ranges from $299/month on the entry-level end to an Enterprise tier for larger companies.
Furthermore, Userpilot’s entry-level plan includes access to all UI patterns and should include everything that most mid-market SaaS businesses need to get started. Userpilot has three paid plans to choose from:
Conclusion
Choosing the right tool for your business is critical to driving growth. Mixpanel Analytics can be one of the best tools for your business to track and drive product growth, but it has some drawbacks.
Want to build product experiences code-free? Book a demo call with our team and get started!
FAQ
What is the use of Mixpanel analytics?
Mixpanel analytics is used to analyze user behavior within digital products, such as websites or mobile apps. It allows you to understand how users engage with their product, track key metrics like conversion rates, retention, and engagement, and optimize the overall user experience.
Is Mixpanel better than Google Analytics?
Mixpanel is better suited for in-depth product and user behavior analytics, while Google Analytics excels at tracking website traffic and overall marketing performance.
Mixpanel allows more granular event tracking, detailed user segmentation, and real-time data analysis, making it a strong choice for product teams. On the other hand, Google Analytics is a powerful tool for monitoring web traffic, SEO performance, and campaign tracking.
Can Mixpanel integrate with Google Analytics?
Yes, Mixpanel can integrate with Google Analytics using third-party tools or custom integrations.
You might have to reset browser storage cookies if it doesn’t work at first. But, this allows you to combine the strengths of both platforms—using Mixpanel for detailed product and behavioral data, while leveraging Google Analytics for traffic and marketing data.
What is the difference between Google Analytics for Firebase and Mixpanel?
Google Analytics for Firebase is a platform focused on mobile app analytics, providing basic user behavior tracking, crash reporting, and performance metrics for app developers. Mixpanel, in contrast, offers more advanced analytics capabilities, such as user segmentation, cohort analysis, funnel tracking, and real-time event data.
In short, while Firebase is ideal for basic app performance tracking, Mixpanel is preferred for more detailed insights into user behavior and product optimization.
About the author