
It’s always a struggle to find one good article on user analytics that doesn’t only discuss the superficial. Most of them cover the benefits of tracking user behaviors or mapping user journeys but they miss the bottom line – how do you actually develop and implement a user analysis strategy?
This guide skips straight to answering that crucial question, covering topics such as:
- What is user analytics?
- Steps for conducting user analytics.
- Common user analytics challenges to look out for.
- Analytics tools to consider and other FAQs.
Try Userpilot Now
See Why 1,000+ Teams Choose Userpilot

What is user analytics?
User analytics involves tracking data to understand how users interact and engage with your product or other digital experiences. This helps uncover user behavior trends and pain points that can be used to inform improvements to enhance the user experience.
What’s more, user analytics enables product teams to segment users more effectively. This makes it easier to engage the right groups of users with highly relevant and personalized experiences.
How should you conduct user analysis?
User analytics may look complicated, but it can be broken down into 5 simple steps. These involve defining specific questions, gathering relevant data, selecting appropriate analysis methods, testing hypotheses, and then continuously iterating. Let’s explore each step in greater detail below!
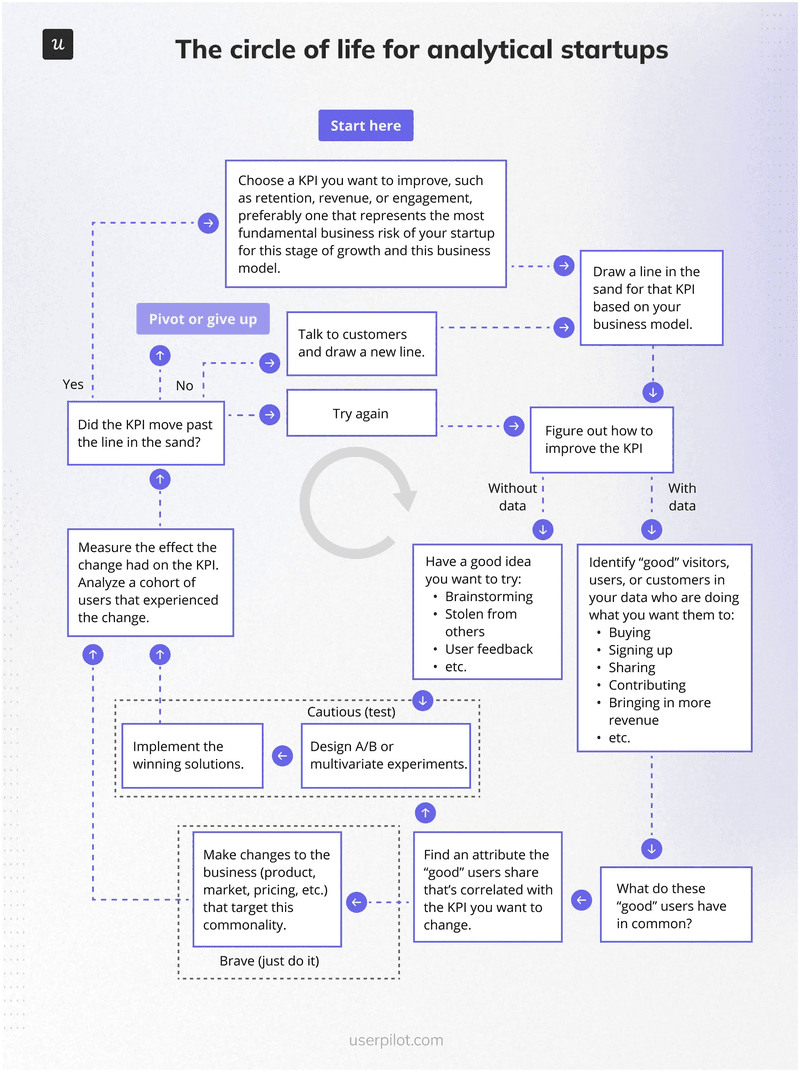
In case you’re pressed for time, here’s an infographic from the book Lean Analytics to help you decide where to start with user analytics (or any analytics process really).
Start with a question
Start by figuring out why you’re diving into user analytics in the first place. Are you doing it just because everyone else is, or is there a focused question you’re trying to answer?
If it’s the latter, then take the time to define your question properly. Be as specific as you can. This will help narrow down your analysis later on.
Here are some examples of well-defined questions you could target in your user analytics:
- User onboarding: Which steps in our onboarding process have the highest drop-off rates?
- Feature adoption: Which features are most popular among users in our premium plan versus the free plan?
- User retention: What are the common usage patterns of users who churn within the first month?
Is your User Analytics strategy truly actionable?
Tracking data is one thing. Understanding user intent is another. Take this 4-step assessment to see if you’re getting the most out of your user analytics.
Decide how you collect and store data
Once you know what your goal is, the next step is figuring out the finer data collection details. This requires answering two key questions:
- How are you going to get the data?
- Where are you going to get it?
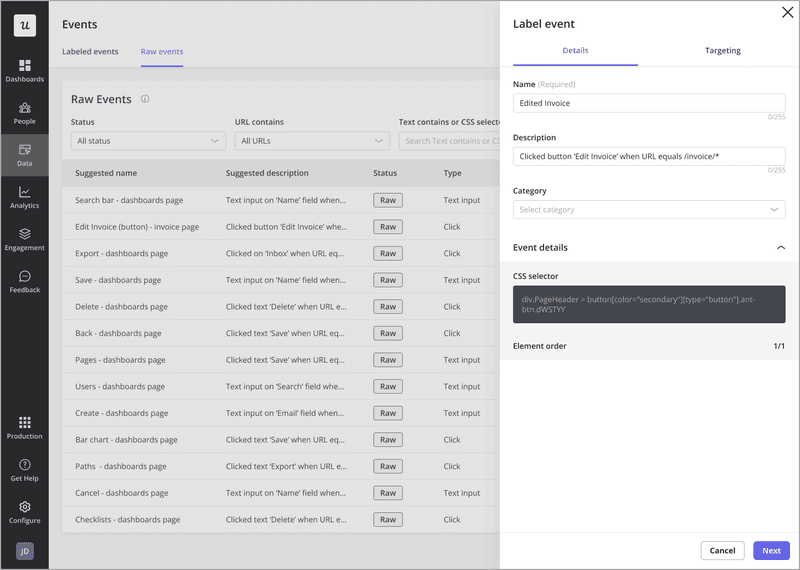
The answers to both these questions will differ based not only on your goal but also on your company size and stage. For instance, since startups don’t focus on solving existing well-researched issues, they’re more likely to need to start with deciding what events to track.
In contrast, existing SaaS companies typically already have data, especially if they deploy any user analytics tool that offers auto-capture features for automatically recording all events. So all that’s left is identifying and labeling the relevant data sources for further analysis.
Determine your user analysis methods
Once you’re done collecting user analytics data it’s time to pick an analysis method.
There are various methods to choose from, and you can even use a combination of two or more depending on the original question you’re trying to answer.
Here are some of the most commonly used user behavior analysis techniques to know of:
- Funnel analysis: Tracks the steps users take toward a defined goal to identify drop-off points and optimize conversion rates.
- Path analysis: Maps user journeys to visualize how users navigate across your products, useful for uncovering patterns or bottlenecks.
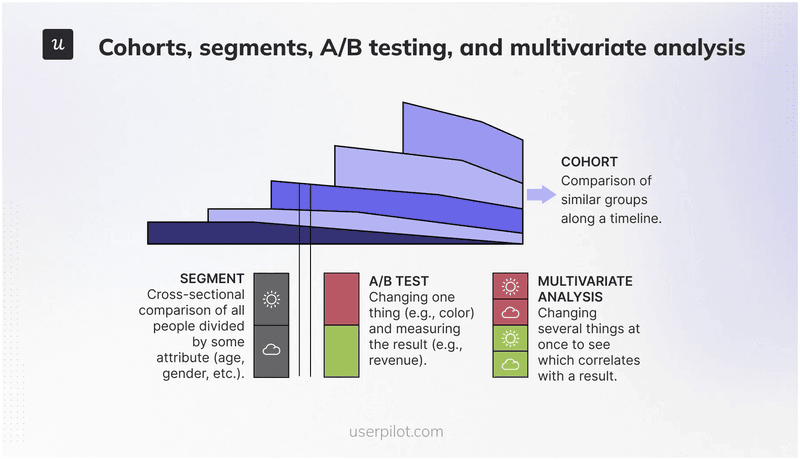
- Cohort analysis: Groups users based on shared characteristics or user behaviors over time to assess retention or performance trends.
- Segmentation analysis: Categorizes users into distinct groups based on demographics, behavior, or preferences to better tailor their experiences.
- Survey analysis: Evaluates user feedback to uncover customer motivations, pain points, and satisfaction levels for qualitative insights.
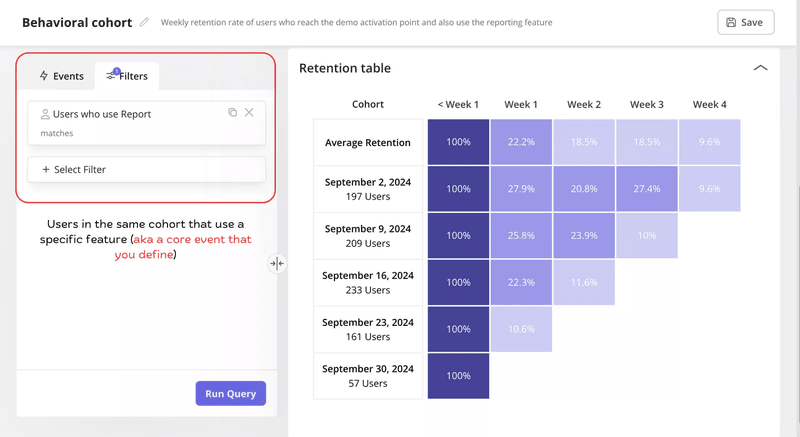
For instance, if your goal is to improve retention, you might choose cohort analysis. It enables you to see user retention rates across cohorts, easily highlighting the group with the highest rate. Next, within that cohort, you could compare usage trends of different features to discover the most sticky features.
Draw and test your hypothesis
By this point, you’ll have some initial insights from your user behavior analytics. Use these to come up with possible hypotheses about how specific changes could improve user engagement or outcomes. The next part is testing your hypothesis, which you can do through A/B testing, multivariate testing, surveys, etc.
Continuing the above example, once you find the sticky features, you might be interested in seeing whether they help boost retention in other cohorts too.
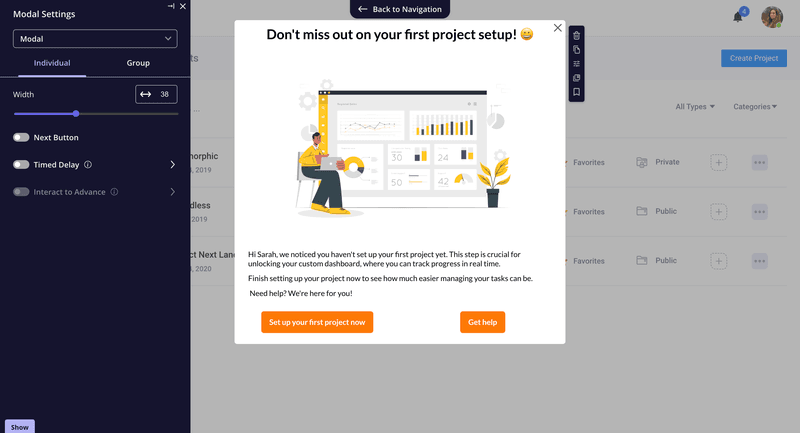
To test this hypothesis, show the other cohorts in-app messages to drive feature usage. And continuously track retention over time to study any changes that may prove or disprove your hypothesis.
Iterate and repeat the user analysis process
If your test proves successful, then apply the findings while starting the user analytics process again from scratch, this time with some other questions.
However, if your test fails, redo your hypothesis and test again. Continue the process until your test is successful, and then follow the above steps all over again.
Such an iterative approach helps continuously refine your product based on data-driven insights.
What challenges affect the user analysis process?
Let’s explore the most common challenges you’re likely to run into during the user analysis process – and how to avoid them!
User analytics data limitation
There are two main issues when it comes to collecting user analytics data.
Firstly, what if you can’t collect data or don’t have enough data to draw conclusions?
Limited data isn’t necessarily a bad thing. In some cases, you might not need user data at all, such as UX analytics and design. For such instances, there are several workarounds you could try depending on the context. Let’s go over some examples to help you understand:
- Competitive analysis to examine UX familiarity, studying what design changes other companies are making that deviate from the norm and how they’re working for them.
- Heuristics for updating or evaluating designs, listing down recommendations and principles to keep in mind. E.g. display the current system status so users are kept informed and can plan their next steps accordingly.
- Accessibility standards for inclusive designs are readily available to base UX designs on. Examples include contrast ratios, resizable text, and form labels – elements that ultimately benefit all users.
- Academic research and industry reports are useful for startups that don’t have enough historical data for comparison. So they can resort to publically available research for a baseline.
These qualitative methods provide universal design frameworks for a more user-centered design and help explore new ideas in data-limited situations.
Secondly, is the collected data enough to address the root cause?
Even with metric tracking, you can still fail to understand the real reason behind user behaviors.
For example, suppose you’re monitoring conversions across your sign-up flow. Conversion rates are dropping across a critical acquisition metric. You notice that the decrease started after the recent changes in the flow.
But you can’t say for certain if that’s the exact issue. Quantitative metrics won’t help at this point. That’s why you need to talk to your users through surveys or interviews. However, both of those may be difficult to conduct and take more time.
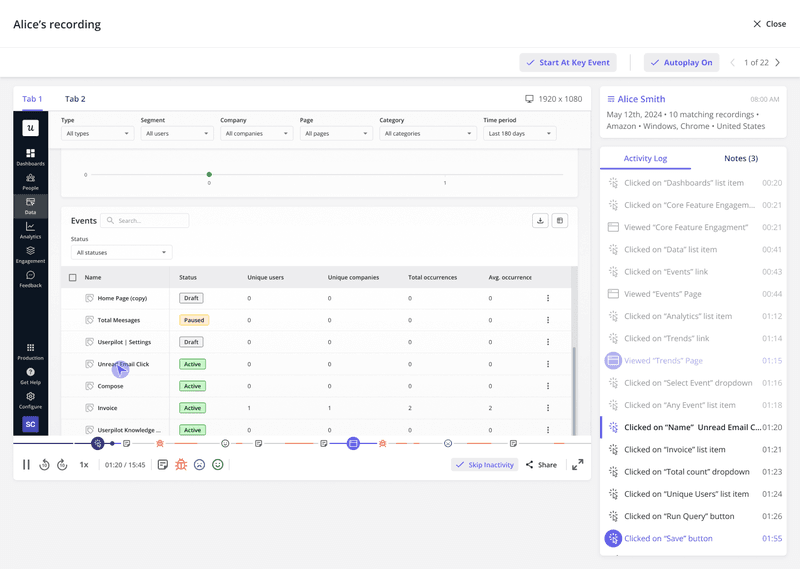
So before going for interviews or surveys, you can try pinpointing issues with session recording first (coming to Userpilot in Q1 2025).
User behavior metrics
You can easily find various metric frameworks or “must-track” metric lists across the internet. But you don’t really need to monitor all those metrics. So the question then is, how do you choose a good metric worth tracking?
A good metric should be:
- Comparative: Compare changes over time, across user segments, or against competitors, to see if things are improving or not.
- Understandable: For people to rely on data, they need to understand it. So a good metric needs to be easy to remember, discuss, and act upon within a team.
Plus, a good metric should ideally be a ratio or rate. This warrants a separate section of its own because ratios offer several benefits, such as:
- They simplify complex data into a single, digestible number, making it easier to make decisions quickly.
- Ratios are inherently comparative since they express the relationship between two or more quantities, highlighting how one value measures up to another.
- They’re also useful for comparing opposing factors, where increasing one variable may negatively impact another, helping you to evaluate the balance between them.
This video on “Acting on Product Analytics” will help further explain how to conduct actionable analysis.
User analytics tools
The tool you choose will determine the quality of your analysis and outcomes. This is why picking the right user behavior analytics tools isn’t a decision to be taken lightly.
There’s Google Analytics, perhaps one of the most widely used analytics tools. However, it tends to focus on broader metrics, lacking deeper insights into user paths and specific drop-off points.
In terms of functionality, credibility, and privacy, Amplitude is famous for product analytics. However, customer reviews suggest, “Their feature flagging is a total mess and impossible to figure out.”
So if you want to go for Amplitude, you need event instrumentation and data knowledge to ensure you don’t mess up with tracking.

Or if you need an analytics tool that helps with both qualitative and quantitative insights, consider Userpilot. It’s a no-code solution, meaning it’s made for product teams with limited technical resources.

What is one good example of user analytics?
Let’s consider a music-streaming platform like Spotify for our example. When a user lands on an artist’s page on the platform, Spotify tracks an event called “User views artist.”
That analytics event will have metadata associated with it, also called event attribute. For the “User views artist” event, the attributes could be artist ID, artist’s genre, etc. After this action, the user could go to play a song. That event will have attributes like song ID, album ID, and song length.
If the user pauses the song, Spotify tracks the event “User pauses song.” The user may then go back to the artist’s page, so the event “User views artist” will be tracked once again. All these actions put together create a stream of events for the specific user.
Next, the product manager could create a funnel for the specific artist ID, like the one below, starting with “User views artist” and moving to “User plays song.” They could further specify the criteria by only looking at conversions within a 10-minute time frame.
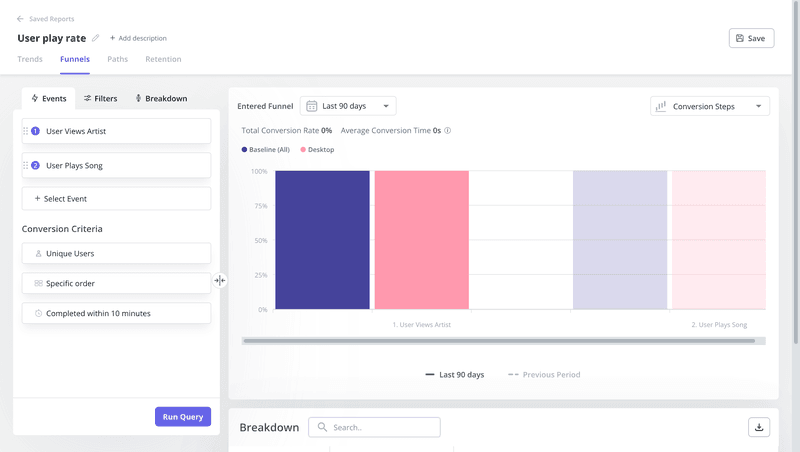
Suppose the funnel shows 3 million users view the artist, but only 800 thousand play a song within 10 minutes. That’s a 27% play rate. The PM can investigate further, like whether the play rate differs between genres or device types. These investigations will help identify opportunities for product improvements.
Since the conversion rate is pretty low, or alternatively the drop rate is high, you might want to combine this analysis with other methods to identify the root cause. Consider user surveys or screen replays for this purpose.
Conclusion
Now that we’re at the finish line, one last thing warrants a reminder—user analytics isn’t just about tracking numbers. It’s about understanding the story behind the data.
So don’t discount the qualitative side of things in your pursuit of metrics and graphs. Rather, combine insights from both to better bridge the gap between user behavior and product innovation.
Looking to improve your user analytics with customizable in-app surveys and multiple analysis tools at your disposal? Get a Userpilot demo and see how you can unlock greater insights into user behaviors.
User analytics FAQs
Let’s go over some additional insights to help you understand user analytics better.
What is user data analytics?
User data analytics involves collecting, analyzing, and interpreting data on how users interact with your product, service, or platform. This process helps identify user behaviors, patterns, and preferences. These insights help improve product design, enhance user engagement, attract more customers, and drive overall success.
What is a user in analytics?
In Google Analytics, a user is an individual who interacts with your website or app, identified by a unique ID associated with each interaction. This identification allows such a user analytics platform to associate traffic with specific users, making it a key metric for measuring growth, user behavior, and overall popularity over time.
What do you mean by user analysis?
User analysis refers to studying how users interact with a product or service to understand their needs, preferences, and challenges. This helps product developers, designers, and engineers improve product performance, ultimately leading to higher user satisfaction.
Why do we need user analytics?
User analytics is crucial for several reasons, such as:
- Understand engagement: Track user behavior to identify popular features and motivations.
- Develop personas: Create user profiles for tailored experiences.
- Improve retention: Optimize features to enhance positive user experiences.
- Refine design: Make data-driven decisions for better product design.
- Increase lifetime value: Anticipate needs, encouraging repeat business and customer loyalty.


