8 Best AI Observability Tools to Evaluate and Monitor AI Agents


Your AI agent answers questions and completes tasks, so it looks like it’s working. But users may still abandon conversations or struggle to complete what they came to do. When that happens, checking error logs won’t always tell you why.
And that gap gets expensive. Gartner predicts over 40% of agentic AI projects will be canceled by the end of 2027, with unclear business value among the main reasons.
So, if you’re a PM or CS lead responsible for an AI agent, you need to see both sides: whether the agent works technically, and whether it works for your users. In this article, I compare the best AI observability tools across both.
Executive summary
- AI observability covers six stages: Building and debugging, testing before release, monitoring answer quality in production, blocking wrong or unsafe answers, operational health, and user interactions and outcomes.
- The best AI observability tool depends on what you need to monitor: You can always combine tools because no single platform covers every stage of AI observability.
| Tool | Stage it covers | Primary users | Pricing model |
|---|---|---|---|
| Userpilot | User interactions and outcomes | PMs, CS | MAU-based |
| Raindrop | Monitoring answer quality in production | AI product teams | Event-based |
| LangSmith | Building and debugging | AI product teams, engineers | Per-seat + usage-based |
| Braintrust | Monitoring answer quality and testing before release | AI product and engineering teams | Usage-based |
| PostHog | Operational health of model calls | Product teams, developers | Usage-based |
| Maxim AI | Testing before release | Product and AI teams | Per-seat + usage-based |
| Galileo | Blocking wrong or unsafe answers | AI teams in high-stakes or regulated industries | Span-based |
| Datadog | Operational health of infrastructure | Engineering and platform teams | Usage/span-based |
What are the best AI observability tools?
I evaluated these tools around three questions:
- Are users getting value from the agent? Are they completing tasks with it and getting better outcomes?
- Why are users having bad experiences? Where do agents give poor answers, and why do users abandon conversations?
- Is the agent reliable enough to ship? Does it give accurate answers without producing unsafe responses?
Together, these questions cover six stages of AI observability, which I expanded below.
| Observability stage | Who usually owns it | Metrics that matter |
|---|---|---|
| Building and debugging | AI engineers and developers | Trace errors, tool-call success rate, debugging time |
| Testing before release | AI engineers, with input from PMs and subject-matter experts | Evaluation pass rate, task success rate, regression rate |
| Monitoring answer quality in production | AI/product teams | Answer accuracy, resolution rate, fallback or escalation rate |
| Blocking wrong or unsafe answers | AI engineering, trust and safety teams | Unsafe response rate, policy violation rate, false positive rate |
| Operational health | Platform, infrastructure, and AI engineering teams | Latency, error rate, cost per request |
| User interactions and outcomes | Product managers and customer success teams | Agent adoption, task completion rate, customer satisfaction |
As the table shows, AI observability involves more than engineering. Your product and customer success also need visibility into agent behavior, which they can get through dashboards, conversation reviews, and evaluation results. Deeper instrumentation and code-level fixes, however, usually require engineering support.
So, how do you choose?
- Start with the problem you need to solve: For example, if users are abandoning conversations, prioritize tools that track user interactions and outcomes.
- Consider who will use the tool and what they need to do with its findings: A PM may need conversation insights and outcome metrics, while an engineer may need detailed traces and debugging capabilities. You may also need to combine tools to cover both.
With that in mind, here’s how the eight tools compare and where each fits into the AI observability lifecycle.
1. Userpilot AI Agent Analytics: For seeing whether users get value from your AI agent
Userpilot is best for product managers and customer success teams that want to connect agent usage to adoption and retention.
Say you launch an AI agent to help users set up their workspace, but many leave before finishing setup. Now, you want to know what they struggled with and whether the agent actually helped.
That’s what Userpilot AI Agent Analytics covers: user-facing AI observability, i.e., user interactions and outcomes.
Once you connect the agent, here’s what you can track without engineering support:
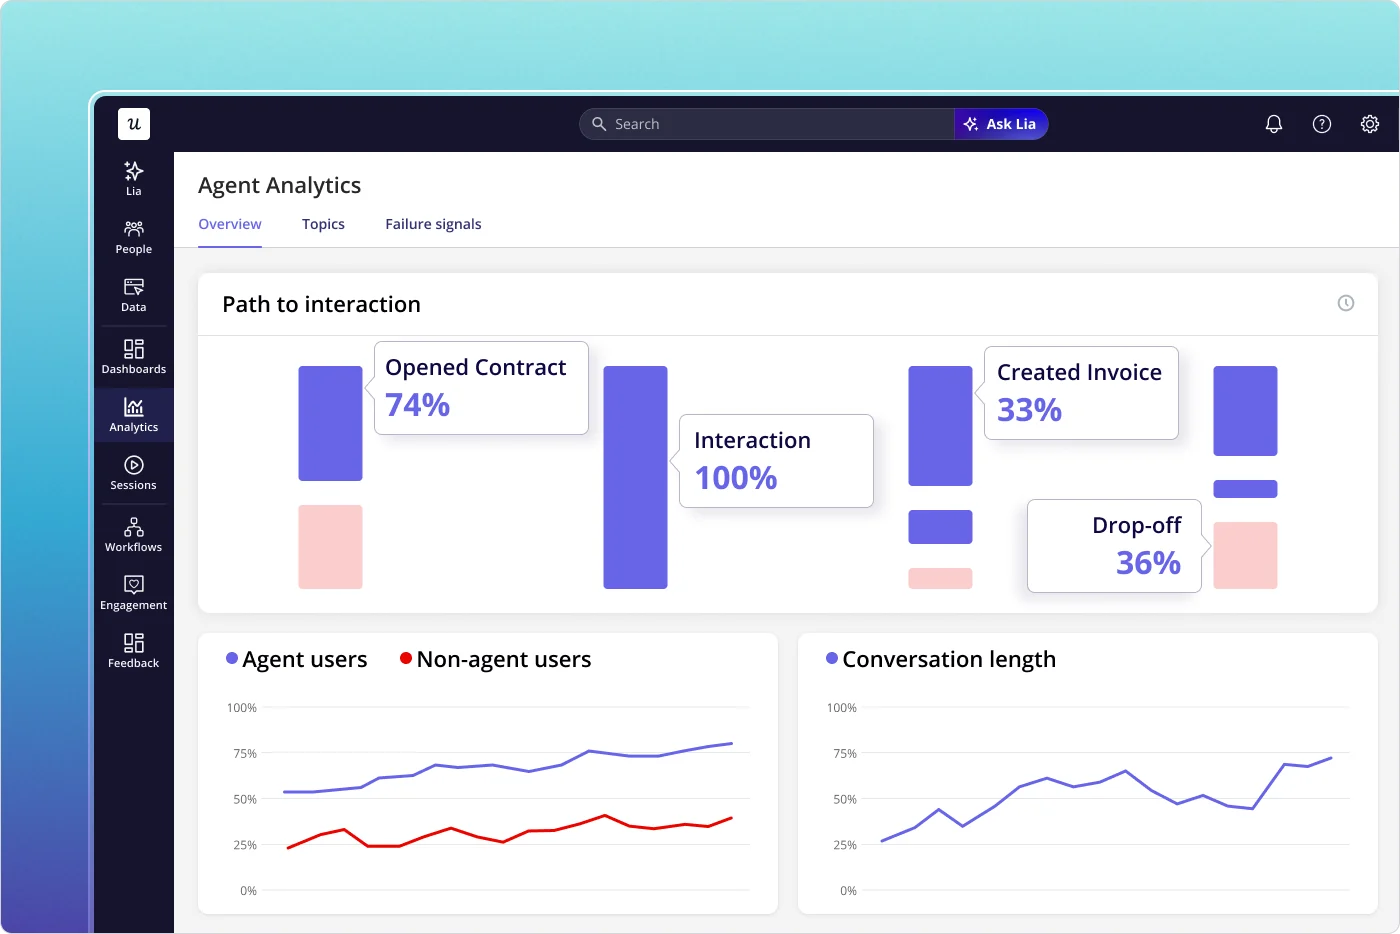
- How users engage with agents: Userpilot shows unique users and companies, conversation volume, and drop-offs by conversation length. It also lets you track queries per user and where people open the agent.
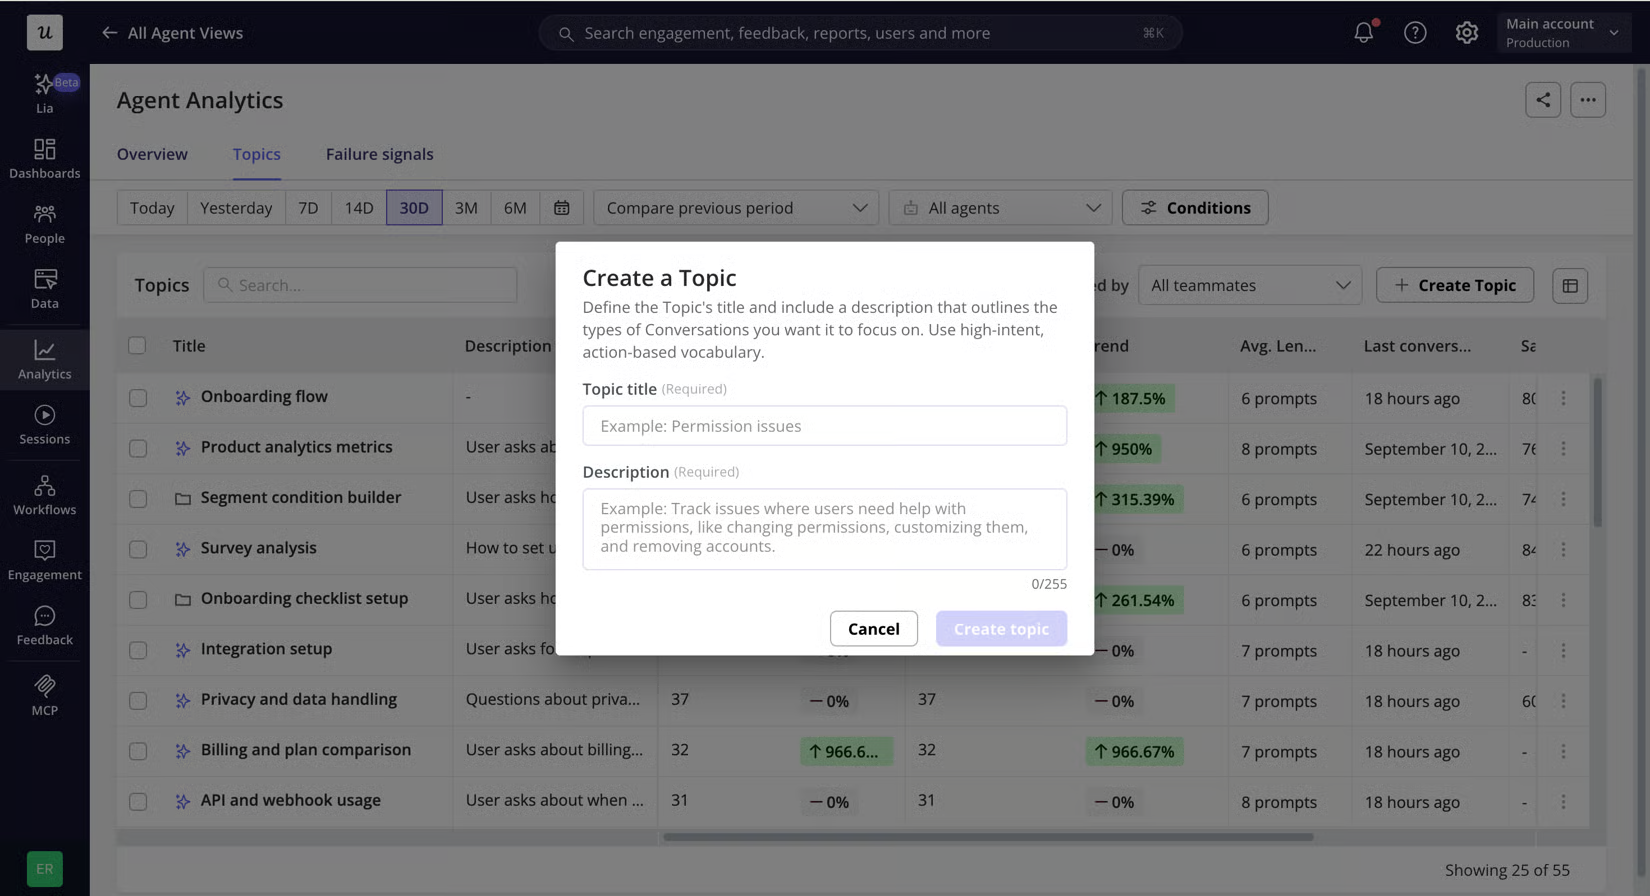
- What users need help with: Userpilot automatically groups agent conversations by topic to reveal common questions and recurring pain points. You can also create custom topics for specific use cases you want to track. This makes it easier to see what users are asking without reviewing every conversation.
- Where agents fail users: Userpilot highlights frustration, drop-offs, and resolution failures by topic. You can also track metrics such as resolution rate, satisfaction score, adoption lift, and retention impact to assess how well your agents deliver value.
But spotting a problem is only the first step. Here’s how I’d use these insights to improve an agent:
- Start by identifying topics with high drop-off or low resolution rates.
- Then, review conversations to find recurring failure patterns.
- If the data doesn’t explain why users are struggling, collect feedback to understand what they expected or where the agent fell short.
- Finally, use those findings to improve the agent and track whether the changes lead to better outcomes.
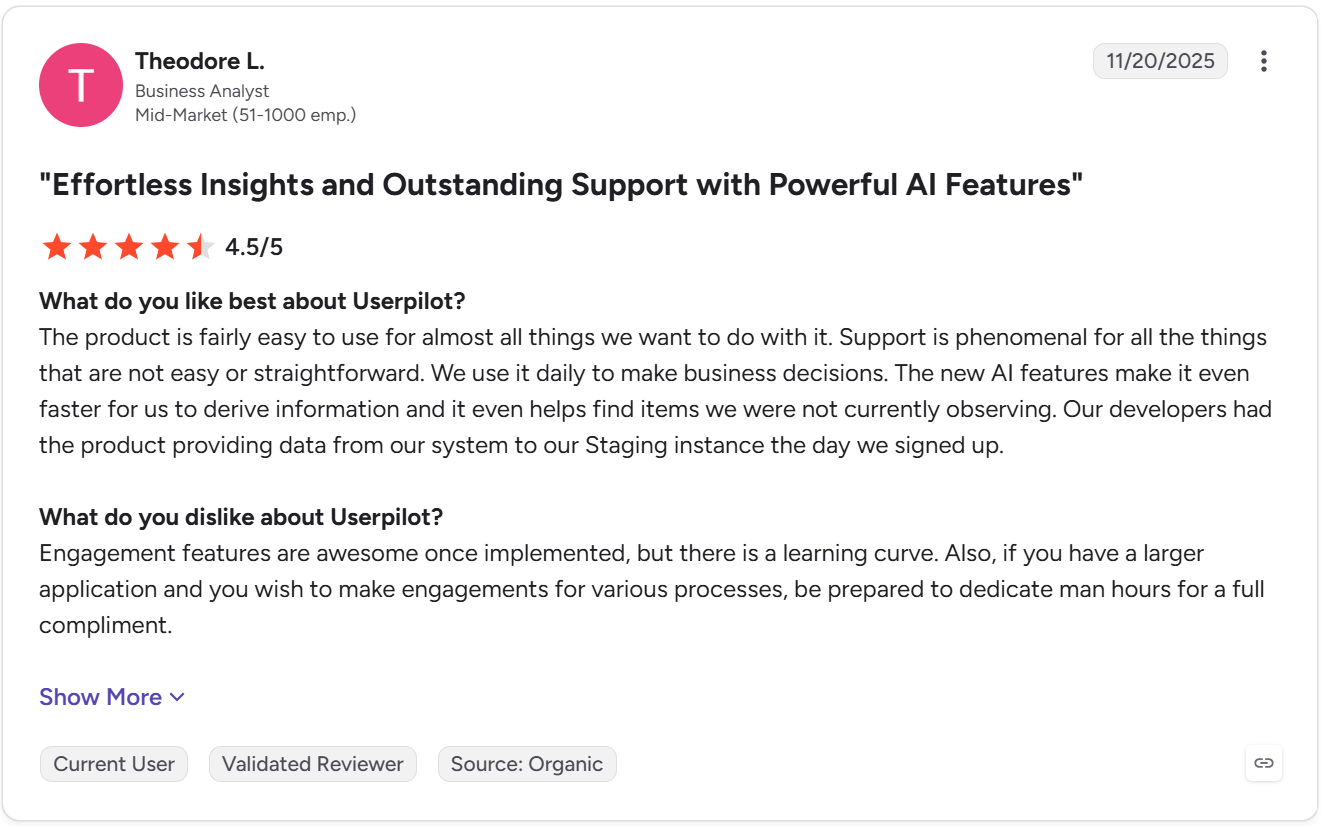
On pricing, we use an MAU-based model starting at $299/month for up to 2,000 MAUs. On our higher plans, i.e., Growth ($849/month) and Enterprise (custom), you’ll get 5,000 free AI (Agent and MCP) analyses. Our Agent Analytics is currently only available as an add-on to the Growth and Enterprise plans.
Overall, Userpilot Agent Analytics focuses on the user side. Skip it if you need low-level traces or prompt evaluations. A tool like LangSmith fits better there. But if your product and CS teams need to connect agent conversations with adoption and retention, Userpilot is the best fit.
2. Raindrop: For catching silent agent failures in production
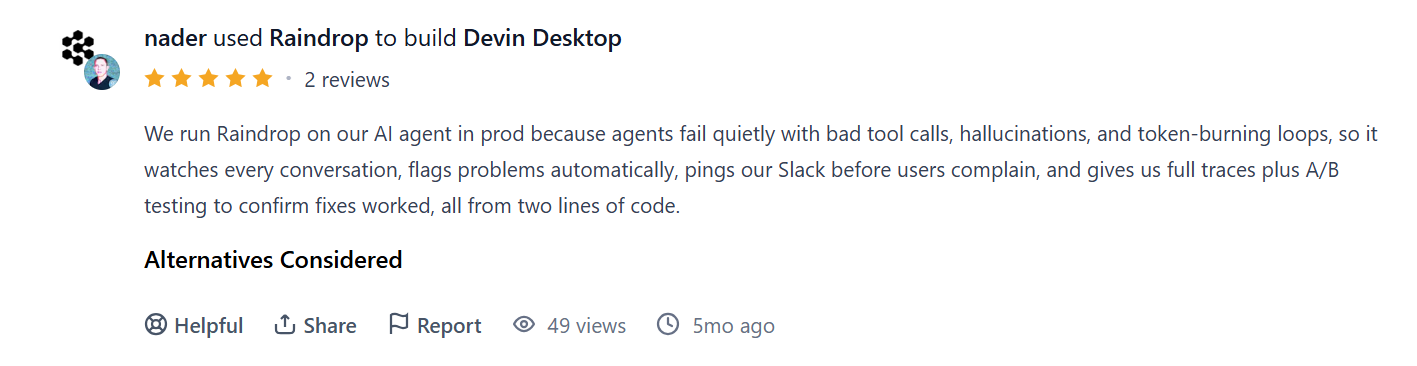
Raindrop is best for AI product teams that need to detect recurring agent failures in production, investigate their causes, and test whether fixes work.
Your AI agent might give users a wrong answer or forget what they asked earlier. These failures don’t throw errors, so they’re easy to miss. Raindrop focuses on monitoring answer quality in production:
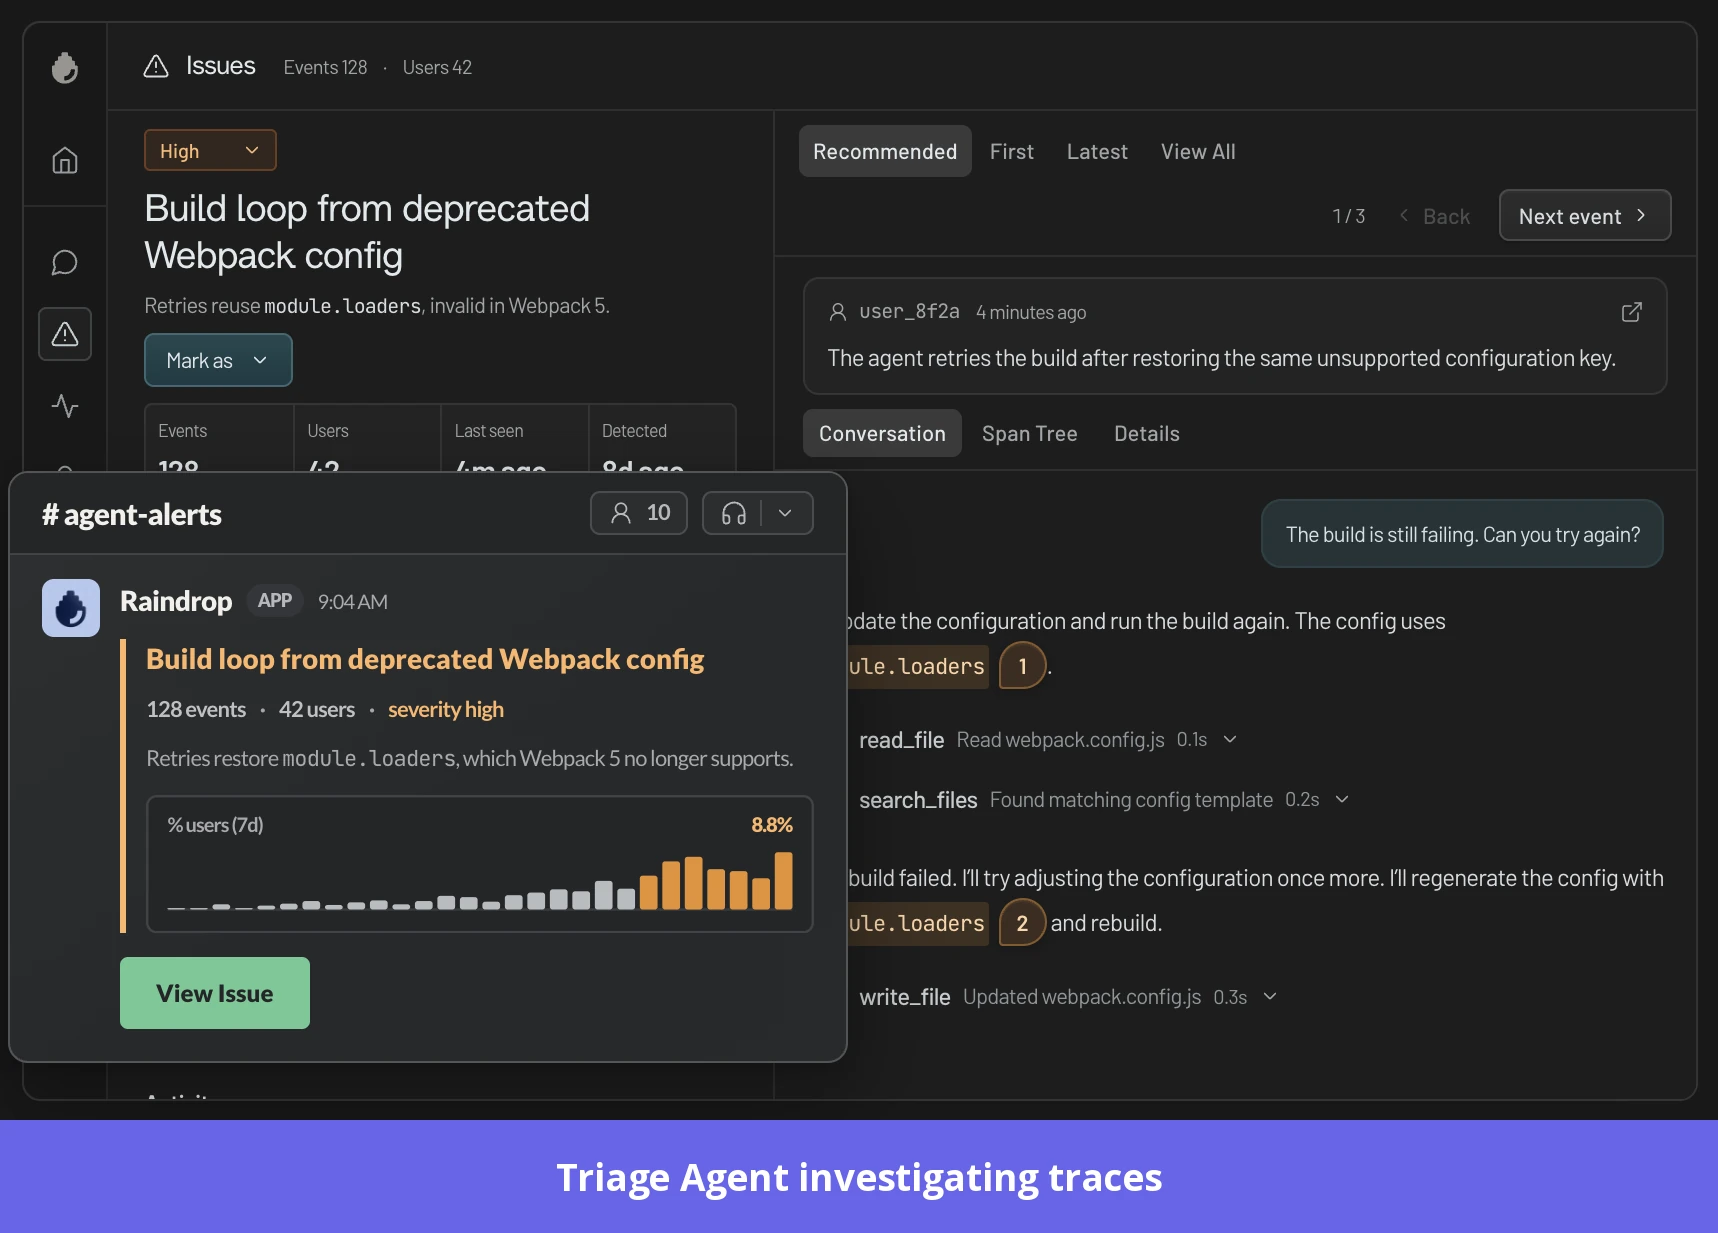
- Spot recurring failures: Raindrop traces agent messages and tool calls, then uses automatic issue detection to group related failures, helping you spot patterns like repeated retries and forgotten context.
- Investigate what went wrong: Once Raindrop identifies an issue, its Triage Agent investigates the underlying traces and summarizes the evidence. You can also ask follow-up questions to dig deeper.
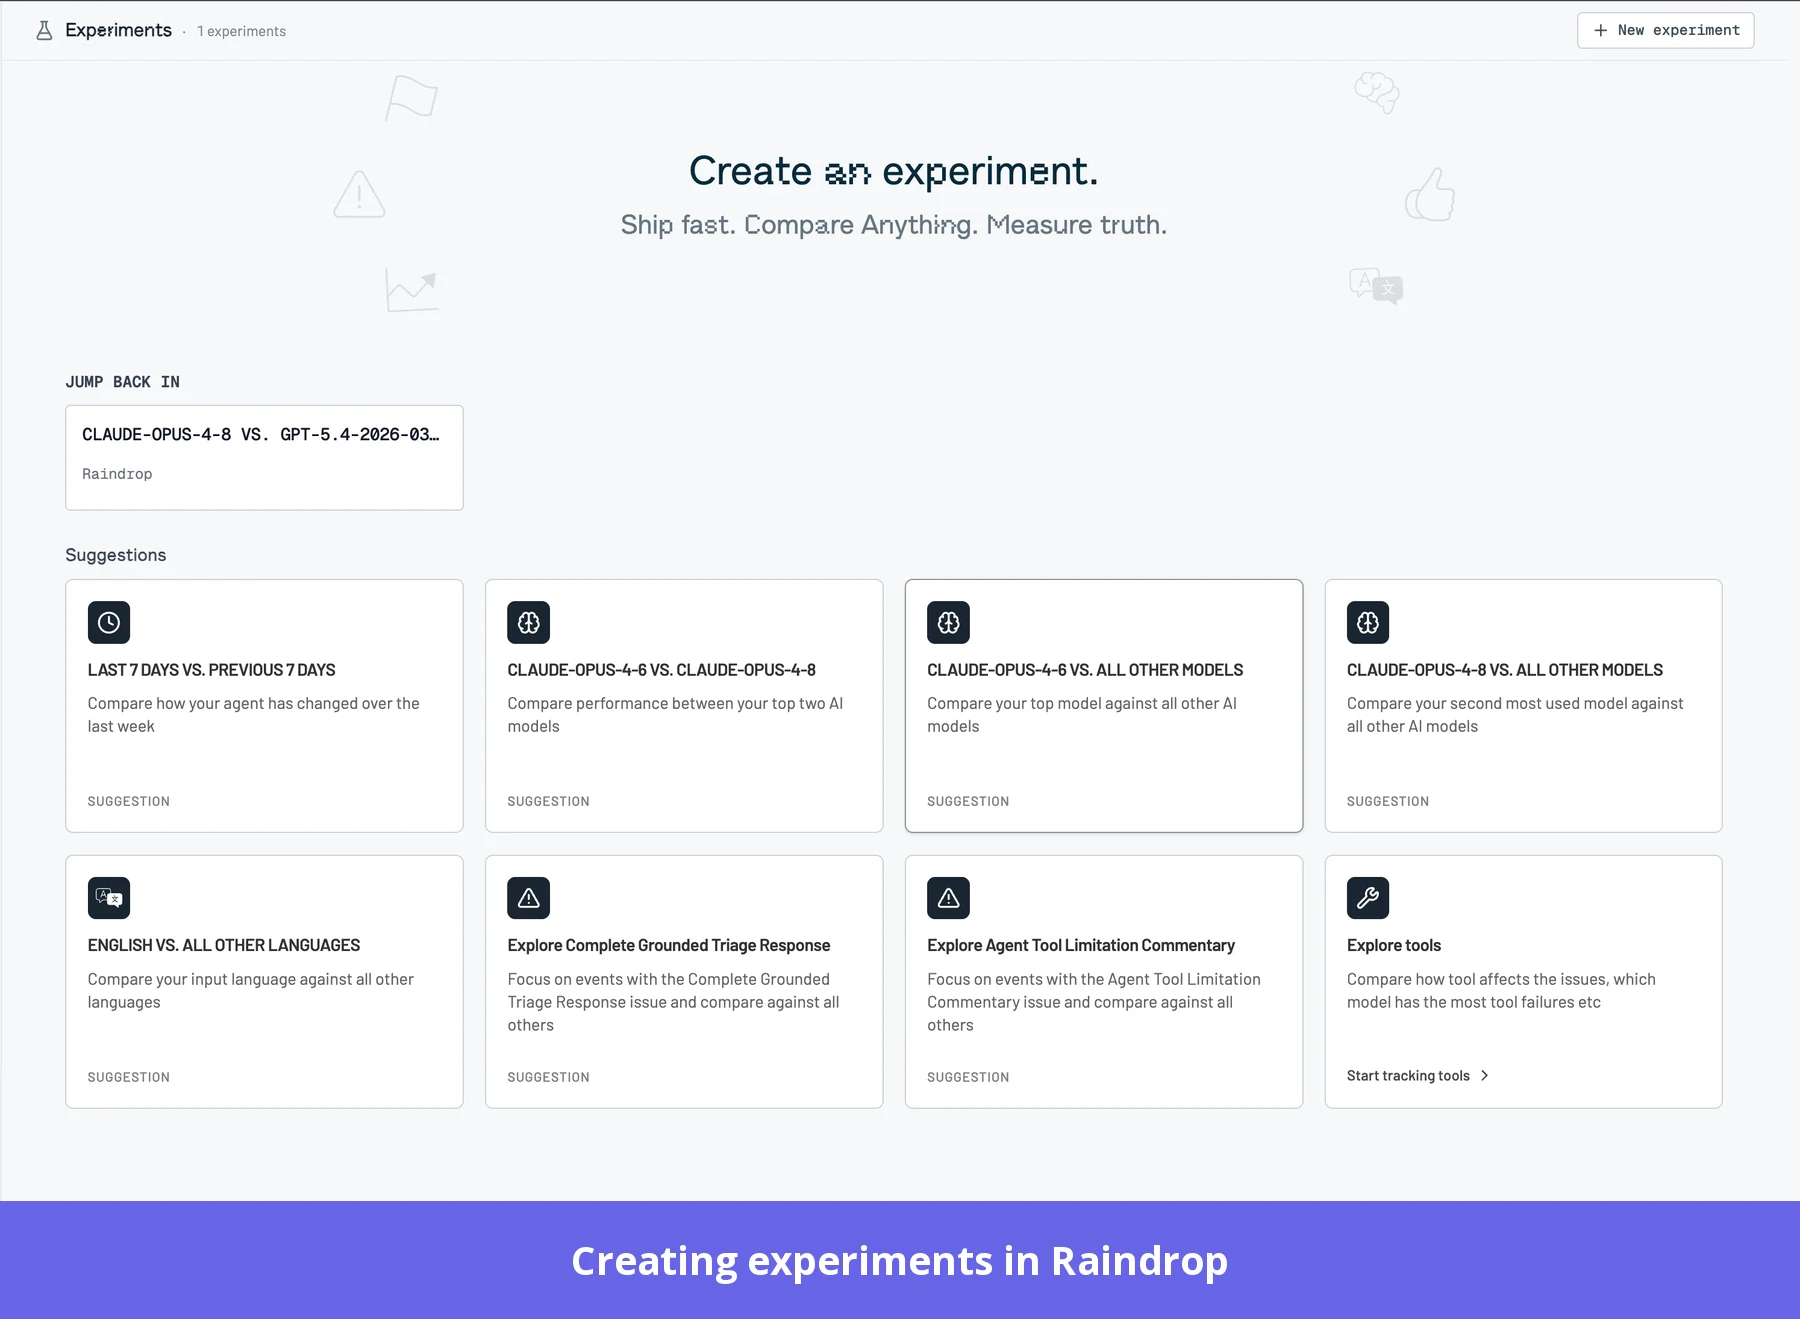
- Check whether a fix works: Raindrop’s Experiments lets you compare two groups of logged events. This could be models, prompts, tools, or workflows using existing production traffic. Then, you can confirm if a change reduces the original failure and check for regressions before rolling it out more widely.
On the flip side, though, you still need engineering help to configure and implement the fix. PMs and CS teams can follow issues through alerts and Triage Agent summaries without touching code. You may also need a dedicated tool for pre-release testing and independent safety guardrails.
Regarding price, Raindrop uses an event-based model. Its Hobby (free) plan lets you trace 1,000 agent activities per month. But you can only do issue detection and experiments on Pro, which starts at $299 per month, plus $0.003 per event up to one million events and $0.002 per event beyond that. Enterprise pricing is custom.
Try Raindrop if you need to find recurring production failures and their causes, and verify that the fixes work.
Skip it if you want a no-code view of product adoption and business outcomes. Pairing it with a tool like Userpilot can solve that.
3. LangSmith: For seeing the steps behind a failed conversation
LangSmith is best for AI product teams that need to trace agent failures step by step and turn those findings into repeatable tests.
LangSmith supports the building and debugging stage of AI observability. Its traces help you follow an agent’s execution step by step, unlike Raindrop, which focuses on detecting and triaging recurring issues.
Here’s how you can use it:
- Trace how a failure happened: LangSmith records agent runs as traces, showing individual steps such as model calls, tool use, inputs, and outputs. Follow the sequence to see where the agent went wrong. For example, if an agent gives a customer an incorrect order status, you can check whether it used the wrong tool or received incorrect data.
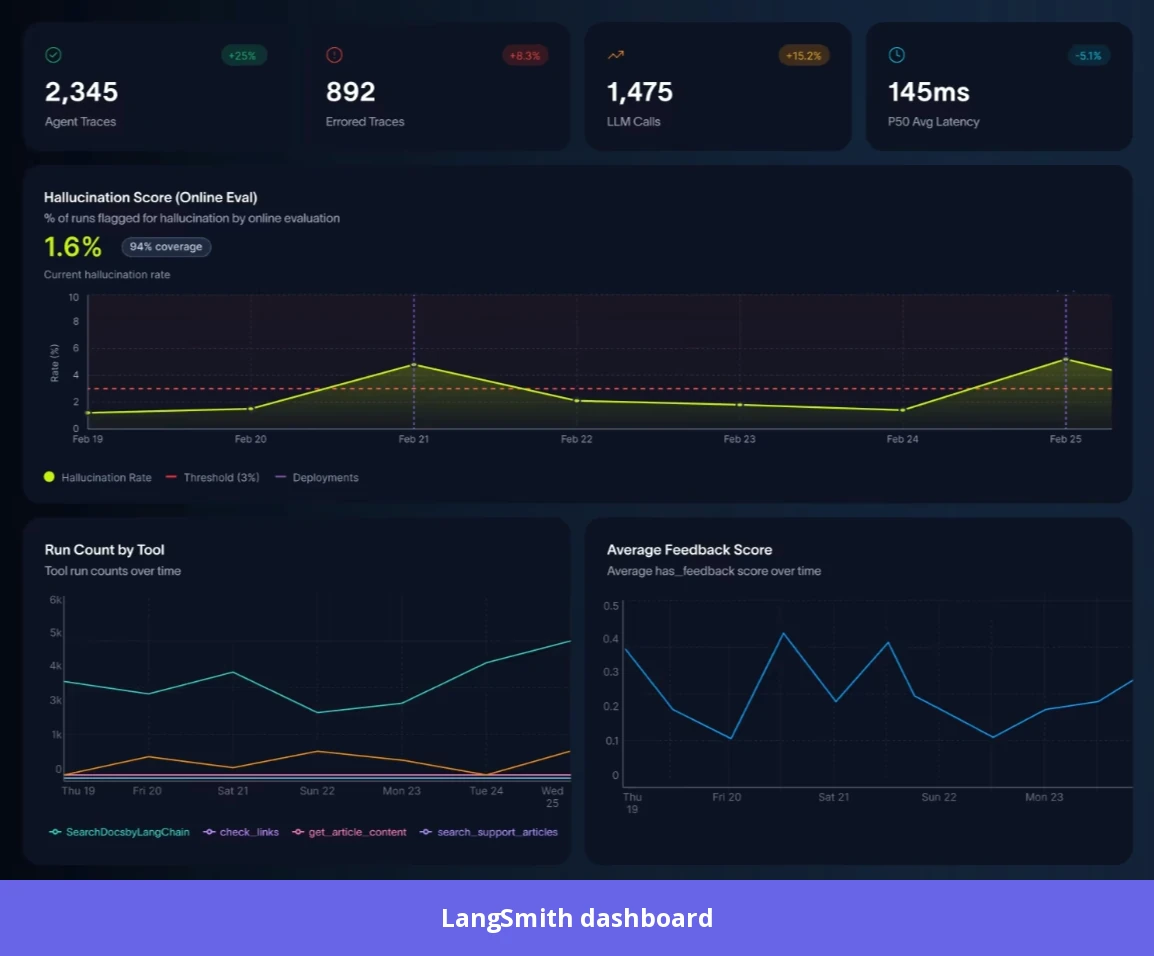
- Find patterns across conversations: LangSmith’s Insights Agent groups production conversations by usage patterns and poor interactions, such as user frustration. Use it to explore the underlying traces to understand common failure modes. Review queues also let non-engineers label conversations and add feedback without debugging the code themselves.
- Check whether the agent meets user goals: Multi-turn evaluations assess the whole conversation, from “what the user wanted” to “how the agent reached its outcome.” This lets you identify gaps and build evaluations that help catch similar failures in future releases.
Beyond agent conversations, LangSmith also tracks technical details like latency and token usage. However, how much detail you get depends on how you built your agent. LangChain and LangGraph agents have native integrations, which provide deeper visibility into their runs. External agents can connect through SDKs or OpenTelemetry, but you’ll need to instrument them to capture the details you want.
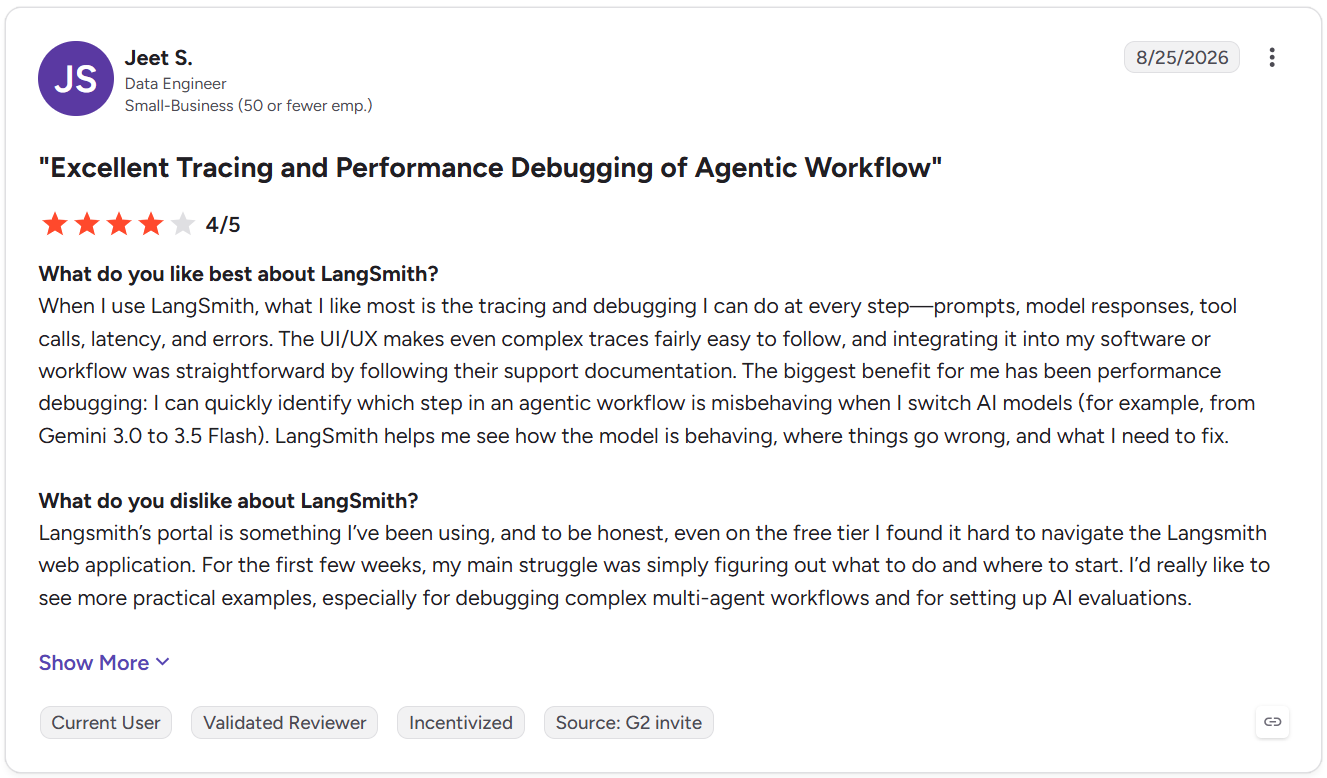
Despite these capabilities, LangSmith’s interface can be hard to navigate, especially for non-engineers. It also doesn’t connect agent interactions to your product usage. For example, it won’t tell you whether successful conversations lead to higher product adoption or retention. For that, you may need to pair it with a tool like Userpilot. Lastly, it doesn’t independently block unsafe answers, so you may also need a separate safety tool.
On pricing, LangSmith uses a mix of per-seat subscriptions and a usage-based model. It offers a free plan (the Developer plan) for one user and includes 5,000 base traces per month. The Plus plan costs $39/seat/month and includes 10,000 base traces. The enterprise plan uses custom pricing. If you exhaust the base traces on both plans, you can add more and pay as you go. But the insight agent and tuned evaluators are only on Plus and above.
LangSmith is great if you need conversation-level insights and repeatable evaluations to improve agent quality. Skip it if you mainly want no-code product analytics or a dedicated safety layer that blocks harmful responses.
4. Braintrust: For classifying conversations and testing fixes before release
Braintrust is best for AI product and engineering teams that want to understand what users ask their agents and test improvements before shipping them.
Braintrust stands out for its Topics, its agent analytics layer. It classifies production conversations by user goal, sentiment, and agent issues, turns them into datasets, and lets you compare fixes.
Here is how you can use it:
- Understand what users are asking and how they feel: Topics automatically group production traces into three categories: Task (goals), Sentiment (positive or negative), and Issues (failed tool calls). You can then filter these groups in Logs and open the original conversations to investigate further.
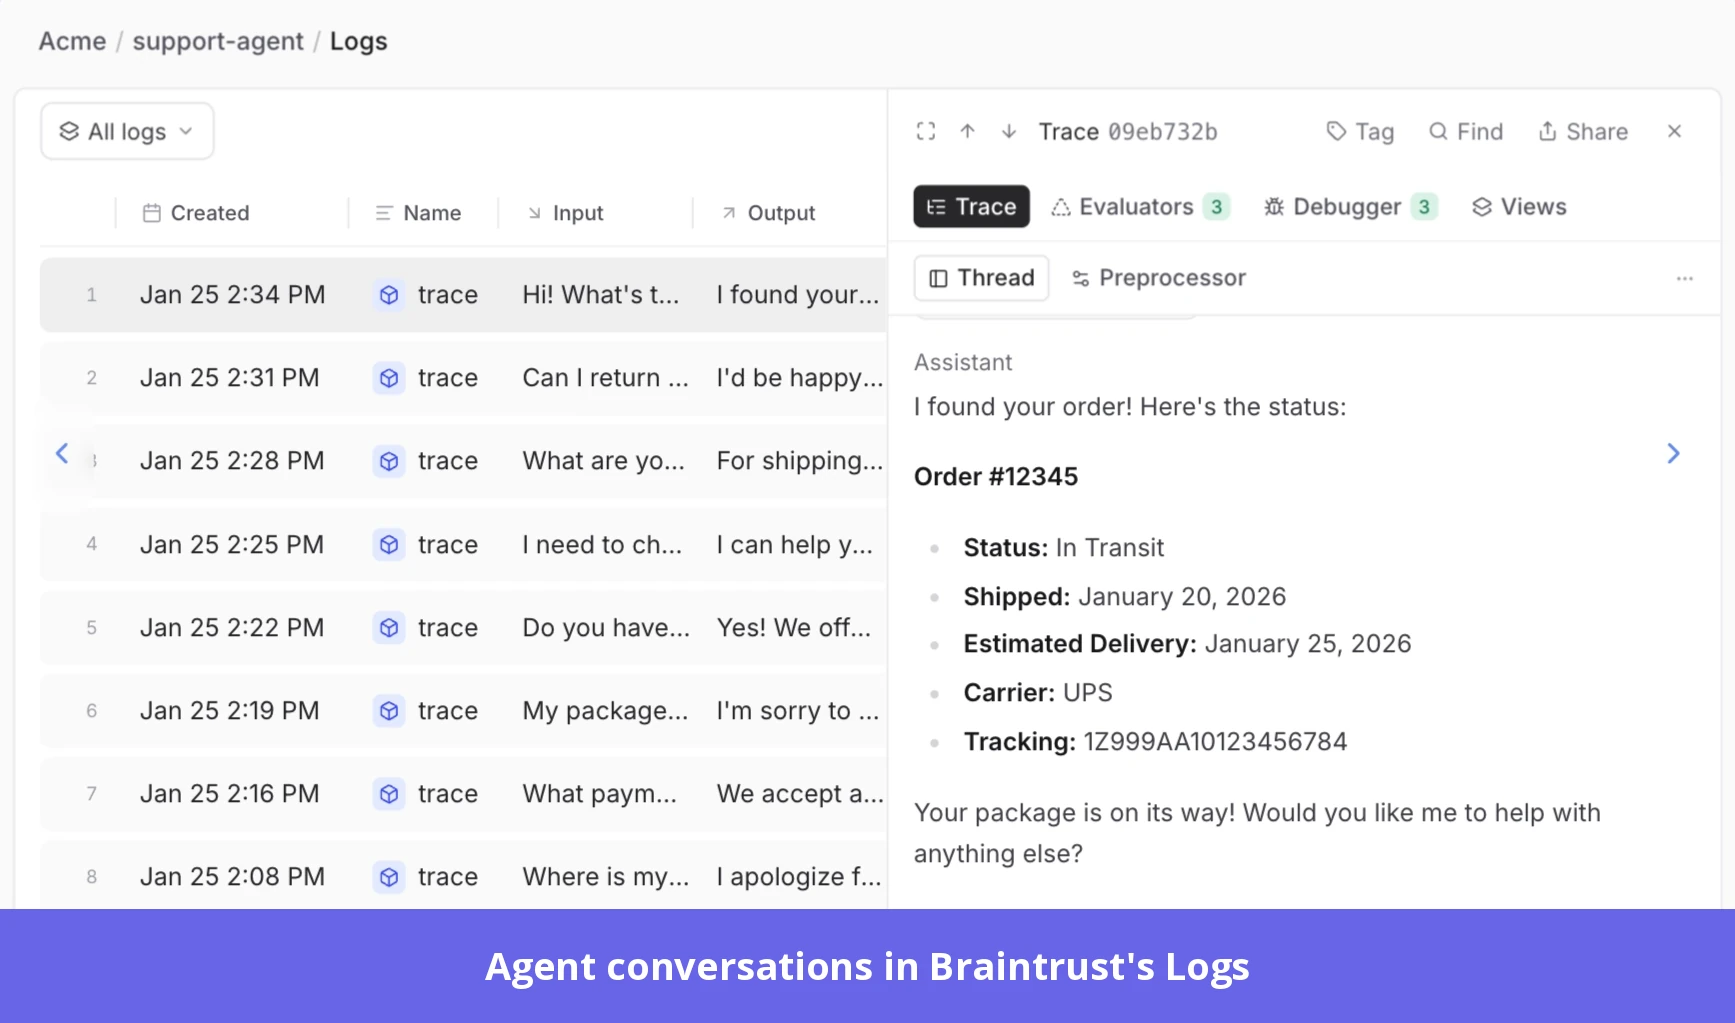
- Turn recurring problems into test datasets: Once you identify a pattern, you can select relevant production conversations and add them to an evaluation dataset. Say several users receive incomplete answers to billing questions. Braintrust lets you collect those conversations into a dataset to test how well your agent handles similar requests.
- Compare changes before release: With those examples in your dataset, you can test a new prompt or model against the same conversations and compare the results. This reveals whether a change improves answer quality or introduces new problems before launch. Your PMs can also review classified conversations and help validate the results, while engineers handle the deeper setup and integration.
Braintrust covers two stages of AI observability: monitoring answer quality in production and testing before release.
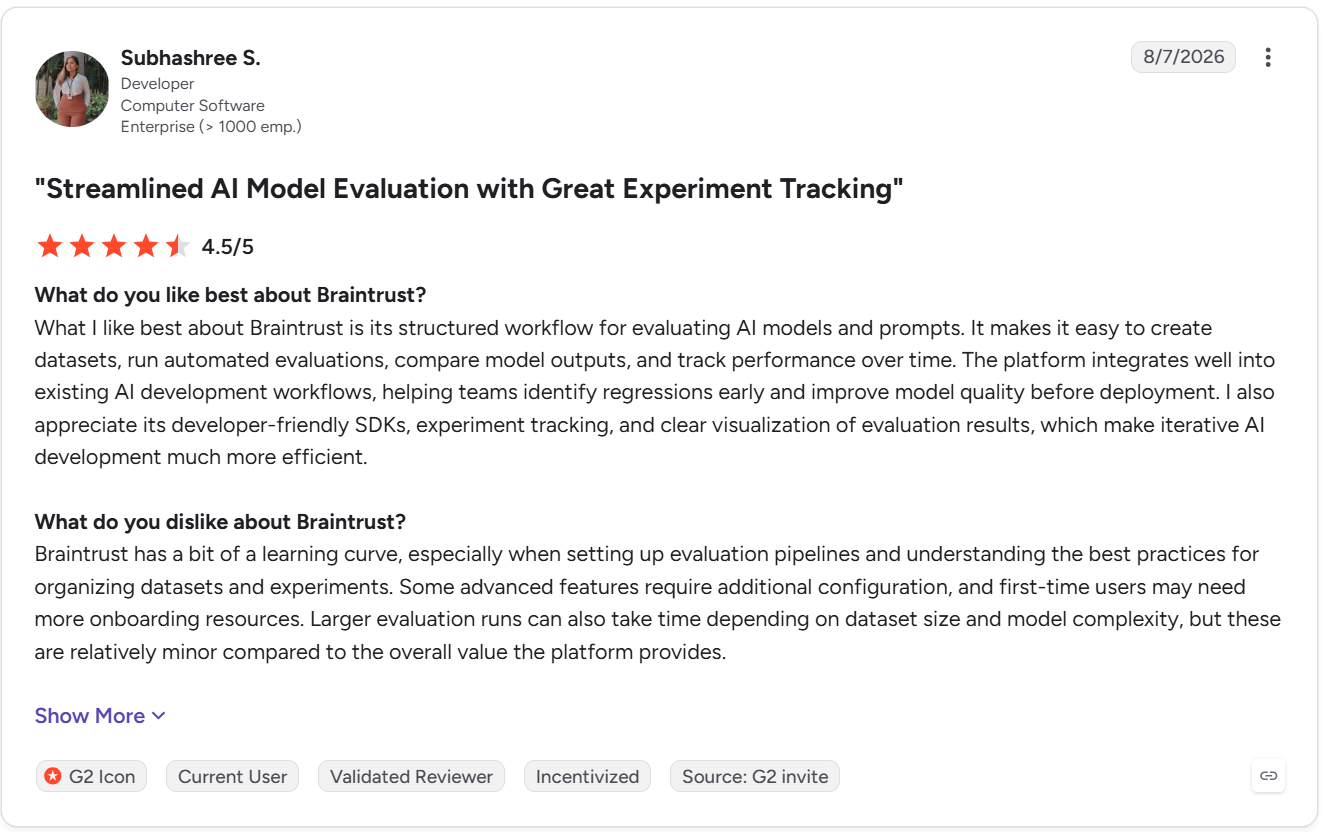
But like most observability tools, Braintrust has a learning curve. It also doesn’t show you how agent interactions affect product adoption and retention. Pairing it with a tool like Userpilot can fix that.
On pricing, Braintrust uses a usage-based model. Its Starter plan is free and includes 1 GB of processed data, 10,000 scores, and 14-day data retention. Pro costs $249 per month and includes 5 GB of processed data, 50,000 scores, and 30-day retention. Extra data and scores incur additional charges, while Enterprise pricing is custom.
Choose Braintrust if you need a tool that turns production conversations into evaluation datasets and tests prompt or model changes before release in one tool. Skip it if you need a simple, no-code view of product adoption or a real-time tool that blocks unsafe answers.
5. PostHog: For model-level data inside your product analytics
PostHog is best for engineering teams already using PostHog that want to connect model-level data like traces, cost, and latency with product usage and user behavior.
PostHog covers the operational health of model calls. It helps developer-first teams monitor LLM traces, including model calls, errors, costs, and latency. It also connects each trace to other PostHog products, such as session replay.
This is useful if you need to examine user behavior, for instance, if conversions drop. You can open a relevant session recording and inspect the AI trace to see what caused a particular problem.
Put simply, PostHog lets your customer success, engineering, and product teams:
- Inspect traces to find where a conversation failed: Review prompts, responses, tool calls, token usage and cost, and latency per model call.
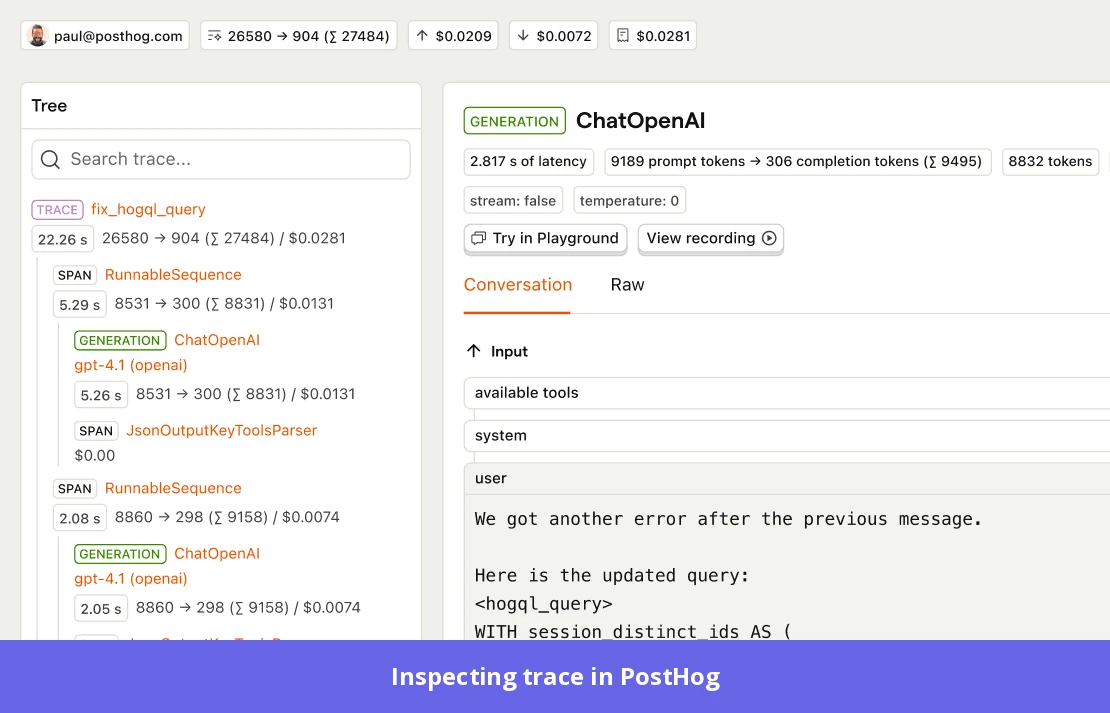
- Monitor answer quality: Use evaluations to score live responses. Use sentiment classification to sort responses as negative, neutral, or positive.
- Use Clusters to find recurring issues: Group similar traces and failures to spot patterns easily.
- Connect failures to user behavior: Open session replays alongside traces to understand users’ experience when interacting with AI.
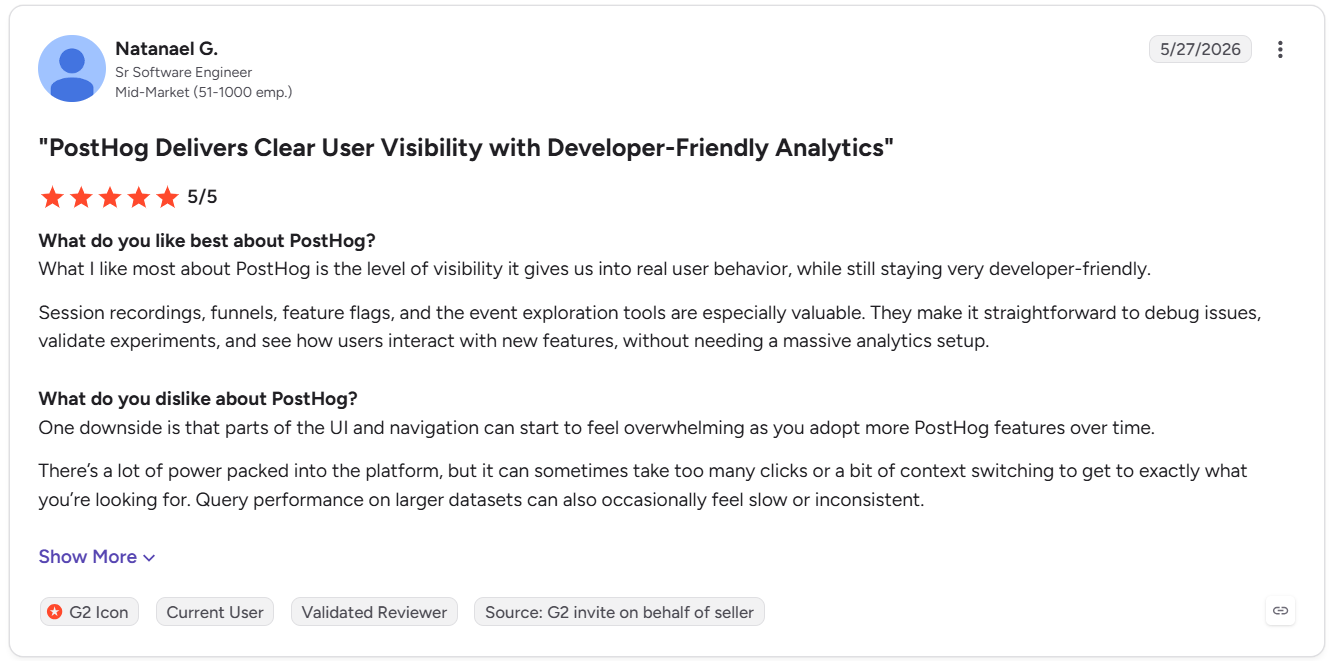
PostHog helps you connect model-level performance with what users experience inside your product. But it can be overwhelming as you use several features.
And while it monitors AI performance, it doesn’t prevent unsafe behavior. To do the latter in the same workflow, pair it with a dedicated runtime layer like Galileo.
About pricing, PostHog uses usage-based pricing. You pay as you go. The first 100K AI observability events are free each month. After that, the pricing starts at $0.000350/event for 100K–150K events and decreases as event volume increases. If event volume is too high, annual plans and volume discounts are available.
Bottom line: use PostHog if your team already uses PostHog analytics and wants to connect model-level data with session replays. But if you need a no-code view of agent outcomes, or a dedicated layer for blocking unsafe answers, skip it.
6. Maxim AI: For testing your agent on simulated users before release
Maxim AI is best for product and AI teams that want to test agent behavior across different scenarios before launch and keep tracking quality after production.
Maxim AI covers testing. Its simulation and evaluation tools let you test how agents respond to different users, scenarios, and tasks before deployment.
It also supports production monitoring and investigates agent performance through distributed tracing. This includes sessions, traces, and spans such as LLM calls, tool use, database queries, and context retrieval.
Once the agent and test setup are ready, PMs and CS teams can:
- Simulate different users and scenarios: Maxim’s Agent Simulation and Evaluation lets teams create simulated users with different personas and test how an agent responds to their requests and behaviors.
- Evaluate agent performance: Use evaluators to score task success, answer quality, and other criteria. Then, compare different prompts or agent versions to see which performs better.
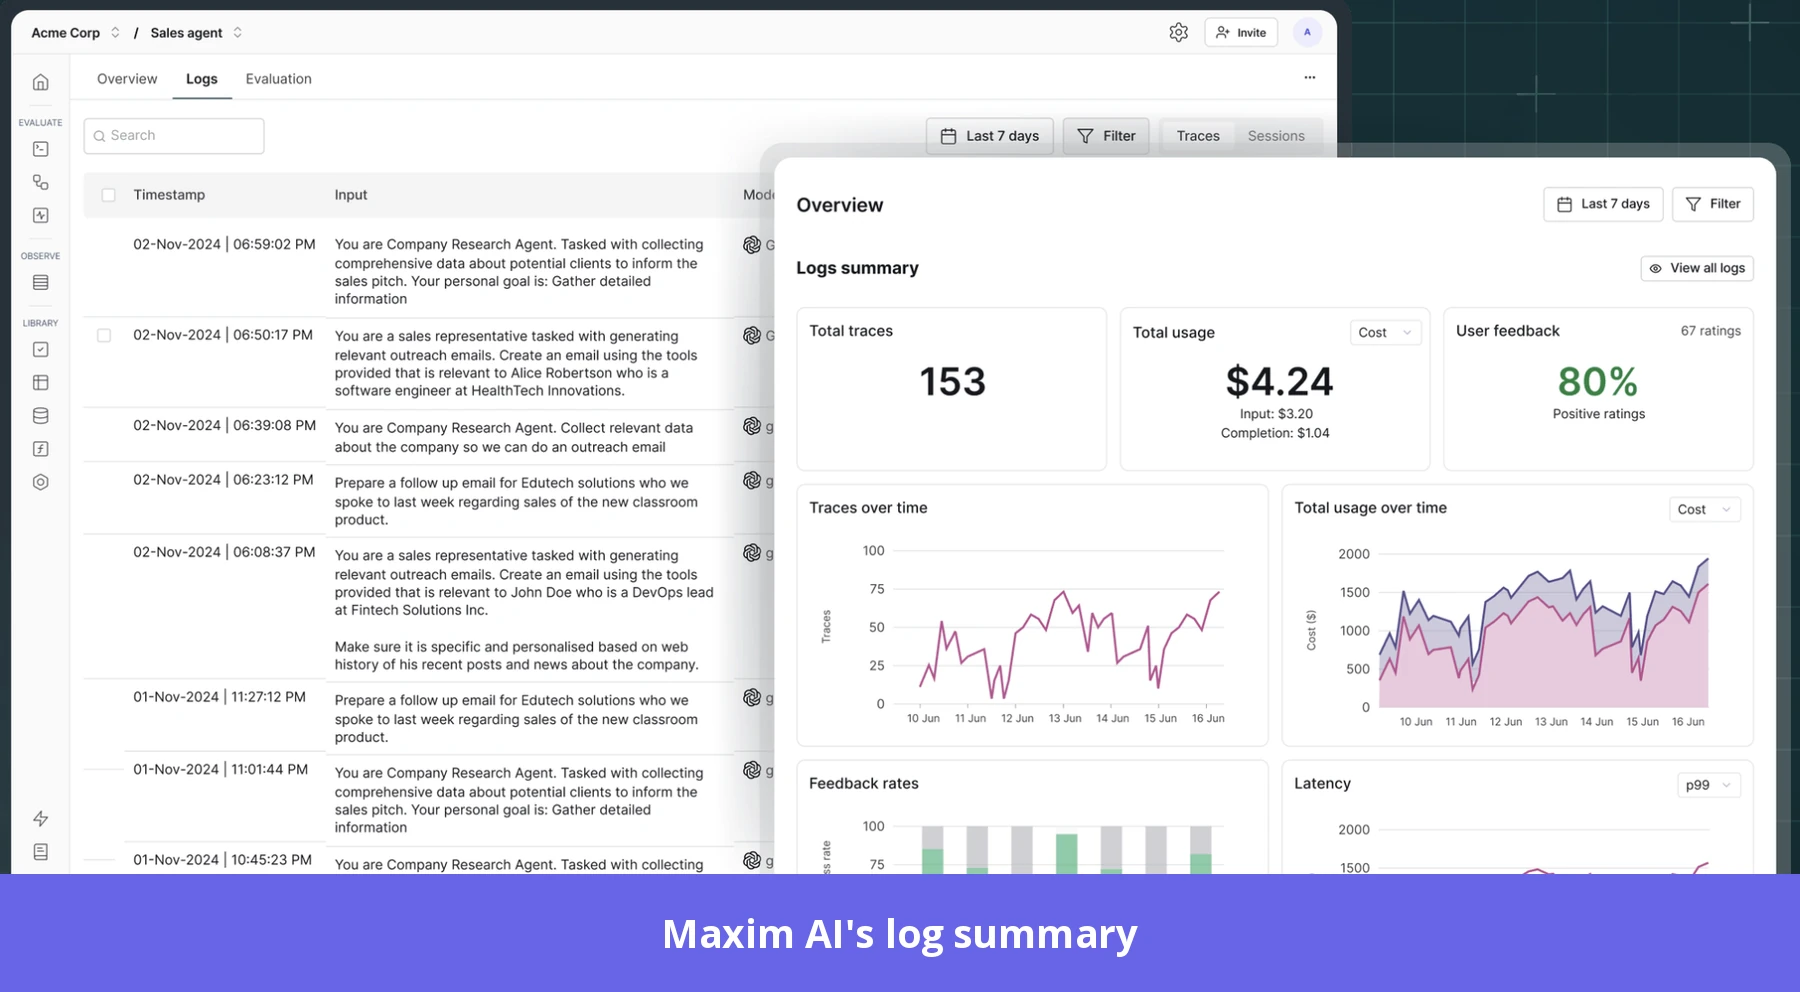
- Monitor agent quality after release: Maxim tracks production interactions to catch failures that simulations may have missed. Teams can use alerts to flag issues such as declining answer quality or rising costs and investigate them through logs and traces.
However, if you need to analyze user outcomes, pair Maxim with Userpilot.
On pricing, Maxim charges based on the number of seats and monthly log requests. Start for free with the Developer plan, which includes up to 3 seats and 10K requests for logs and traces/month. However, simulation runs and online evals start with the Professional plan, which costs $29 per seat/month and includes up to 100K requests. The Business plan costs $49 per seat/month for up to 500K requests, and Enterprise pricing is custom.
Choose Maxim AI if you want to simulate agent interactions, test responses before release, and monitor quality after launch.
Skip it if your priority is understanding user behavior or blocking unsafe answers.
7. Galileo: For catching wrong or unsafe answers before users see them
Galileo is best for teams building AI agents for high-stakes or regulated environments, such as financial services and healthcare, where wrong or harmful answers can lead to serious risks.
Galileo blocks wrong or unsafe answers. Now part of Splunk’s observability portfolio, it also gives teams access to broader capabilities, including pre-release testing and production monitoring. Here’s what you can do with it:
- Detect inaccurate or harmful responses: Galileo uses its Luna models to check agent responses for hallucinations, security threats, bias, and other safety risks.
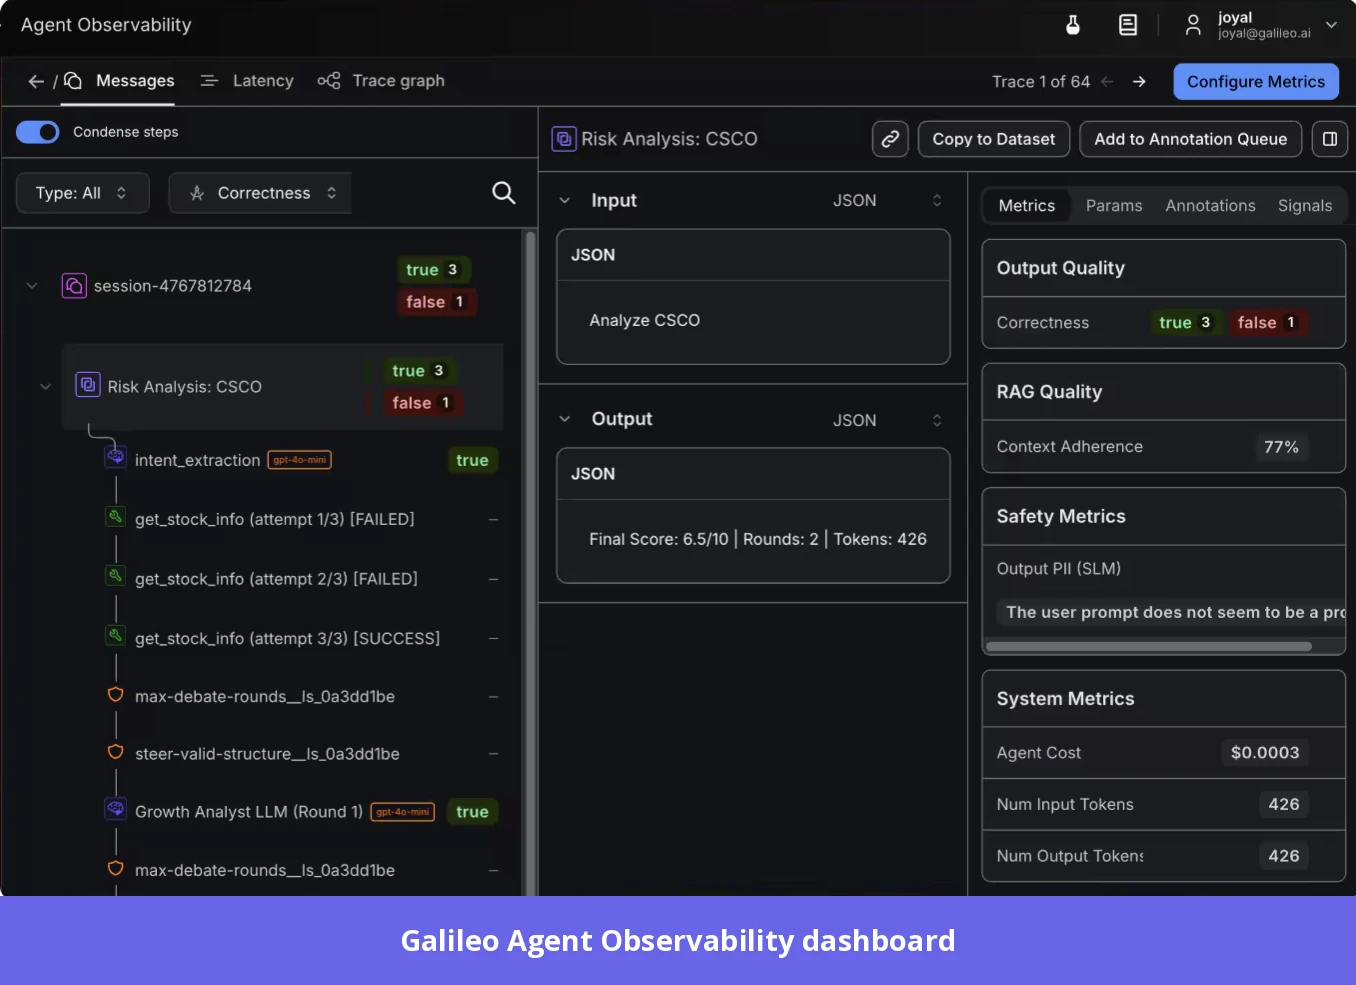
- Evaluate responses against safety criteria: Teams can score and classify outputs to identify harmful, incorrect, or sensitive responses. They can also detect attempts to expose private data or manipulate the agent.
- Block unsafe outputs and actions with runtime guardrails: Teams can configure policies to block harmful responses, prevent unauthorized tool calls, redact sensitive information, or steer risky interactions toward safer responses.
PMs and CS teams can then use the evaluation and flagged interactions to spot recurring quality and safety issues, review problematic responses, and give engineering teams concrete examples to investigate.
However, Galileo isn’t built for debugging. If you need to investigate why an agent produced a bad response, pair it with LangSmith. Its traces help you follow failed conversations and identify problems with LLM calls or tool use.
On pricing, Splunk Agent Observability uses a span-based model, starting at $100/month per 1.2 million spans, billed yearly. Keep in mind that high data volumes can increase licensing costs.
Choose Galileo if you need to detect and block inaccurate or unsafe AI responses, especially in high-stakes environments.
Skip it if your priority is understanding user behavior or testing agent workflows with simulated users.
8. Datadog: For monitoring AI alongside your infrastructure
Datadog is best for engineering and platform teams that need to connect AI agent performance to the health of the infrastructure supporting it.
Datadog covers the operational health stage of AI observability. Say an AI agent becomes slow or unreliable because of something outside the model itself. The database responds too slowly. Then, the service returns errors, or the GPU runs out of capacity. These are issues Datadog investigates.
Here’s what you can do with it:
- Trace problems across your stack: Datadog tracks agent steps, including model calls, retrieval, and tool use. So, you can follow a request through your application to find where the agent slowed down or failed.
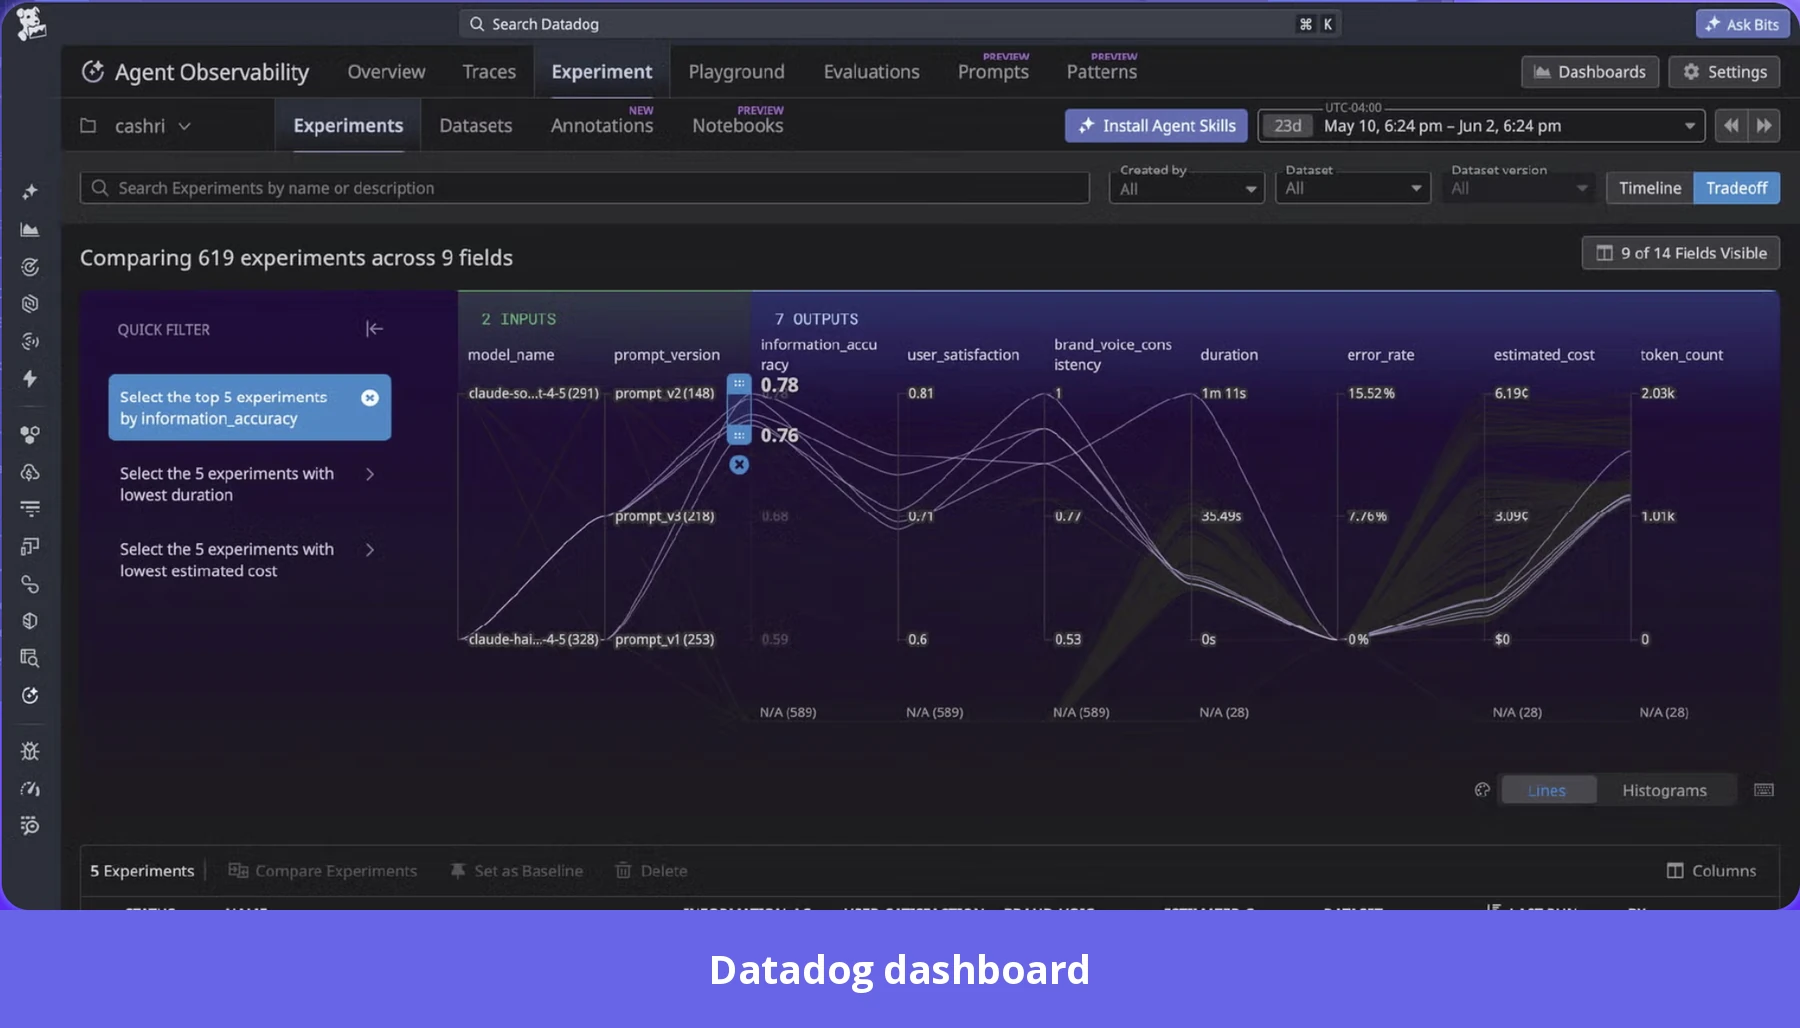
- Monitor performance and costs: Track latency, token usage, retries, and errors at each step. This helps you identify slow calls, repeated failures, and unexpected usage costs.
- Connect agent issues to infrastructure: Correlate LLM traces with application performance monitoring (APM), infrastructure signals, and real user monitoring (RUM) sessions. For example, you can investigate whether a slow database or overloaded GPU is affecting agent response times.
The insights are useful beyond engineering, too. Product and customer success can explore dashboards, review traces, and use annotations and human feedback to flag poor outputs and share concrete examples with engineering. Regardless, instrumentation and implementation still require engineering support.
Beyond operational health, Datadog also supports evaluations and experiments. This lets you test prompt and model changes against production data before release. If you want to understand what these insights mean for users, pair Datadog with a tool like Userpilot.
On pricing, Datadog Agent Observability uses usage and a span meter. It offers a free plan that covers up to 40,000 LLM spans per month, with 15-day trace retention. The Pro plan starts at $160/month on annual billing and includes 100,000 LLM spans. Additional spans cost $3.50 per 10,000 per month on annual billing. Note that this is Agent Observability pricing. Other Datadog products, such as infrastructure monitoring, may add to your total cost, which can be expensive.
Overall, I’d say choose Datadog for two reasons. First, your engineering team already uses it. Second, you need to connect agent performance with application and infrastructure health. Skip it if your main priority is understanding user adoption or conversation outcomes without relying on engineering.
Turn AI agent conversations into product decisions with Userpilot
Most AI observability tools help you trace and investigate failed calls. But it’s one thing to understand why an agent failed. As a PM or CS lead, you still need to connect it to users’ engagement and retention.
That gap is what Userpilot closes. It shows where your agent loses users and whether your fixes bring them back, so you can make agent decisions based on adoption and retention.
Want to see how this works with your AI agent? Book a demo today.
FAQ
What's the difference between AI observability and AI-driven observability?
AI observability helps teams monitor, evaluate, and troubleshoot AI systems. AI-driven observability, on the other hand, uses AI to analyze system data, detect patterns, identify anomalies, and help investigate issues.
Can product managers use AI observability tools without engineering help?
Yes. PMs can use dashboards, conversation reviews, evaluation results, and failure reports to investigate agent performance. However, instrumentation, integrations, and code-level fixes often require engineering support.
What's the difference between AI observability and LLM monitoring?
LLM monitoring tracks large language model performance, such as response quality and latency. AI observability is broader. It covers the agent’s behavior, tool calls, safety, and user outcomes.
About the author