Our Review of the Best Amplitude Alternatives (2026)


“We initially rolled out Amplitude to become more data-driven, but in reality, we’ve ended up with inconsistent event names, broken user IDs that don’t unify across devices or sessions.”
— Reddit user.
If that sounds familiar, you’re not alone.
Over 60% of mid-sized tech firms report that their product teams can’t fully use advanced analytics platforms due to high costs and a lack of trained personnel.
And I know the stakes are high: data-driven businesses are nearly 7 times more likely to retain customers than their competitors. That’s where Amplitude alternatives come in.
After reviewing 25+ product analytics tools, I’ve curated a list of 8 Amplitude alternatives that help product teams move faster, simplify analysis, and make better decisions with qualitative data.

What is Amplitude?
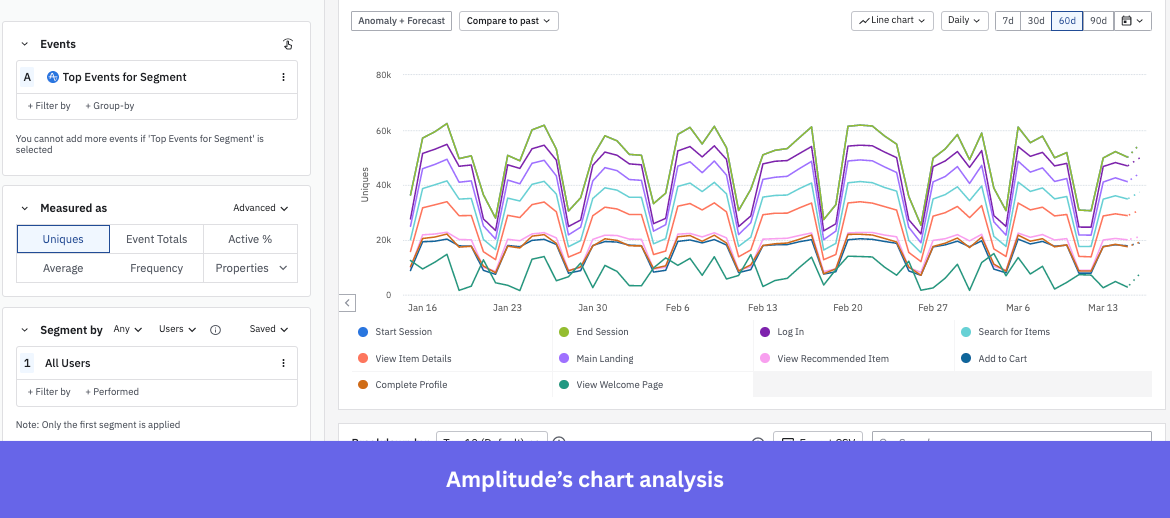
Amplitude Analytics is an event-based product analytics platform that tracks how users engage with your product across web and mobile. It uses a scalable “Wave” lambda architecture with a speed layer for real-time data, a batch layer on Amazon S3 for raw data storage, and a serving layer for pre-aggregated analytics.
By mapping behavior across the entire journey, Amplitude enables teams to optimize product experiences and drive growth with data. The platform has expanded beyond product-only analytics into a unified interface serving both product and marketing teams.
Here’s an overview of Amplitude’s key features:
- Event tracking & segmentation: Every click, scroll, and action is logged as an event, and you can segment them by properties like location, device, or user attributes.
- Funnel analysis: Funnel analysis shows you exactly where users drop off across multi-step flows, like onboarding or checkout.
- Retention & cohort analysis: Groups users by shared traits and tracks their behavior over time to identify what drives retention and where users churn.
- Session replay: Records actual user sessions and links them directly to analytics.
- A/B experimentation: Enables self-service testing of features, messaging, or designs with specific user segments.
- Dashboards & notebooks: Compiles charts, cohorts, and funnels into shareable dashboards; Notebooks add narrative context with text and visuals.
- AI capabilities: Detects anomalies, fosters predictive analytics, and surfaces cohort-level insights automatically.
Why do SaaS teams look for alternatives to Amplitude?
Amplitude is powerful, but when you dig into real user reviews, a few consistent friction points show up. These aren’t isolated complaints; you’ll see them across multiple reviews, like the ones I found below.
1. Steep learning curve
While powerful, Amplitude’s depth often makes it harder for non-technical teams to get up and running. A G2 reviewer shared:
“One downside of Amplitude Analytics is that it can feel overwhelming at first because of the sheer number of features and reports available. There’s definitely a learning curve, particularly when it comes to setting up events correctly and making sure everything is tracked the way you intend.”
2. Event management feels overly complicated
Users find themselves spending more time figuring out how to structure their events than actually analyzing the data. A reviewer from G2 says:
“Sometimes when creating a chart, after adding the events and properties, I try to see how it would look like in a funnel or journey format and I lose the information I added there (events and properties). I wish I could play around (as I am no expert in data tools) without losing the configuration.”
3. Lots of data but not enough direction
Reviewers say Amplitude’s detailed data can become overwhelming, making it harder to see the full customer journey. One G2 user pointed out:
“Some features aren’t as powerful or configurable as other tools, like Looker or Google Analytics. It can be overwhelming with the abundance of granular data, making it difficult to get a clear picture of customers’ entire user journey.”
TL;DR: 8 Best Amplitude alternatives
Here’s a quick overview of the tools that made it to the final list:
|
Tools |
G2 rating |
Standout feature |
Pricing |
| Mixpanel | 4.6/5 |
|
Usage-based |
| Userpilot | 4.6/5 |
|
Starts at $299/month |
| Google Analytics 4 | 4.5/5 |
|
Freemium model |
| Heap | 4.4/5 |
|
Custom pricing |
| Hotjar | 4.3/5 |
|
Starts at $32/month |
| Fullstory | 4.5/5 |
|
Custom pricing |
| PostHog | 4.5/5 |
|
Usage-based |
| Adobe Analytics | 4.2/5 |
|
Custom pricing |
How I narrowed down the best Amplitude alternatives:
Based on my weekly sessions with software teams, I put each tool through these eight qualifying questions:
- Usability: Can PMs and growth teams use it without constant developer support and ongoing maintenance?
- Core analytics capabilities: Does it support event-based tracking, funnels, path analysis, and cohort segmentation?
- Scalability: Can it handle increasing event volume, users, and complexity as the product grows?
- Integrations: Does it connect well with the existing tech stack (CDPs, warehouses, CRM, etc.)?
- Pricing: Is pricing transparent and aligns with the usage and team size?
- Security & compliance: Does it meet standards like GDPR, SOC 2, and other regulatory requirements?
- Data ownership & export: Can you easily export raw data or sync it with your warehouse? Who owns the data?
- Support & documentation: Does it offer dependable documentation, responsive support, and an active user community?
Tools that were overly complex, required heavy engineering effort, or focused only on raw data without actionable insights didn’t qualify.
The 8 Amplitude alternatives that qualified based on our criteria
Below is my detailed breakdown of the 8 Amplitude alternatives, where I discuss their features, pros and cons, pricing, and what real users say about them.
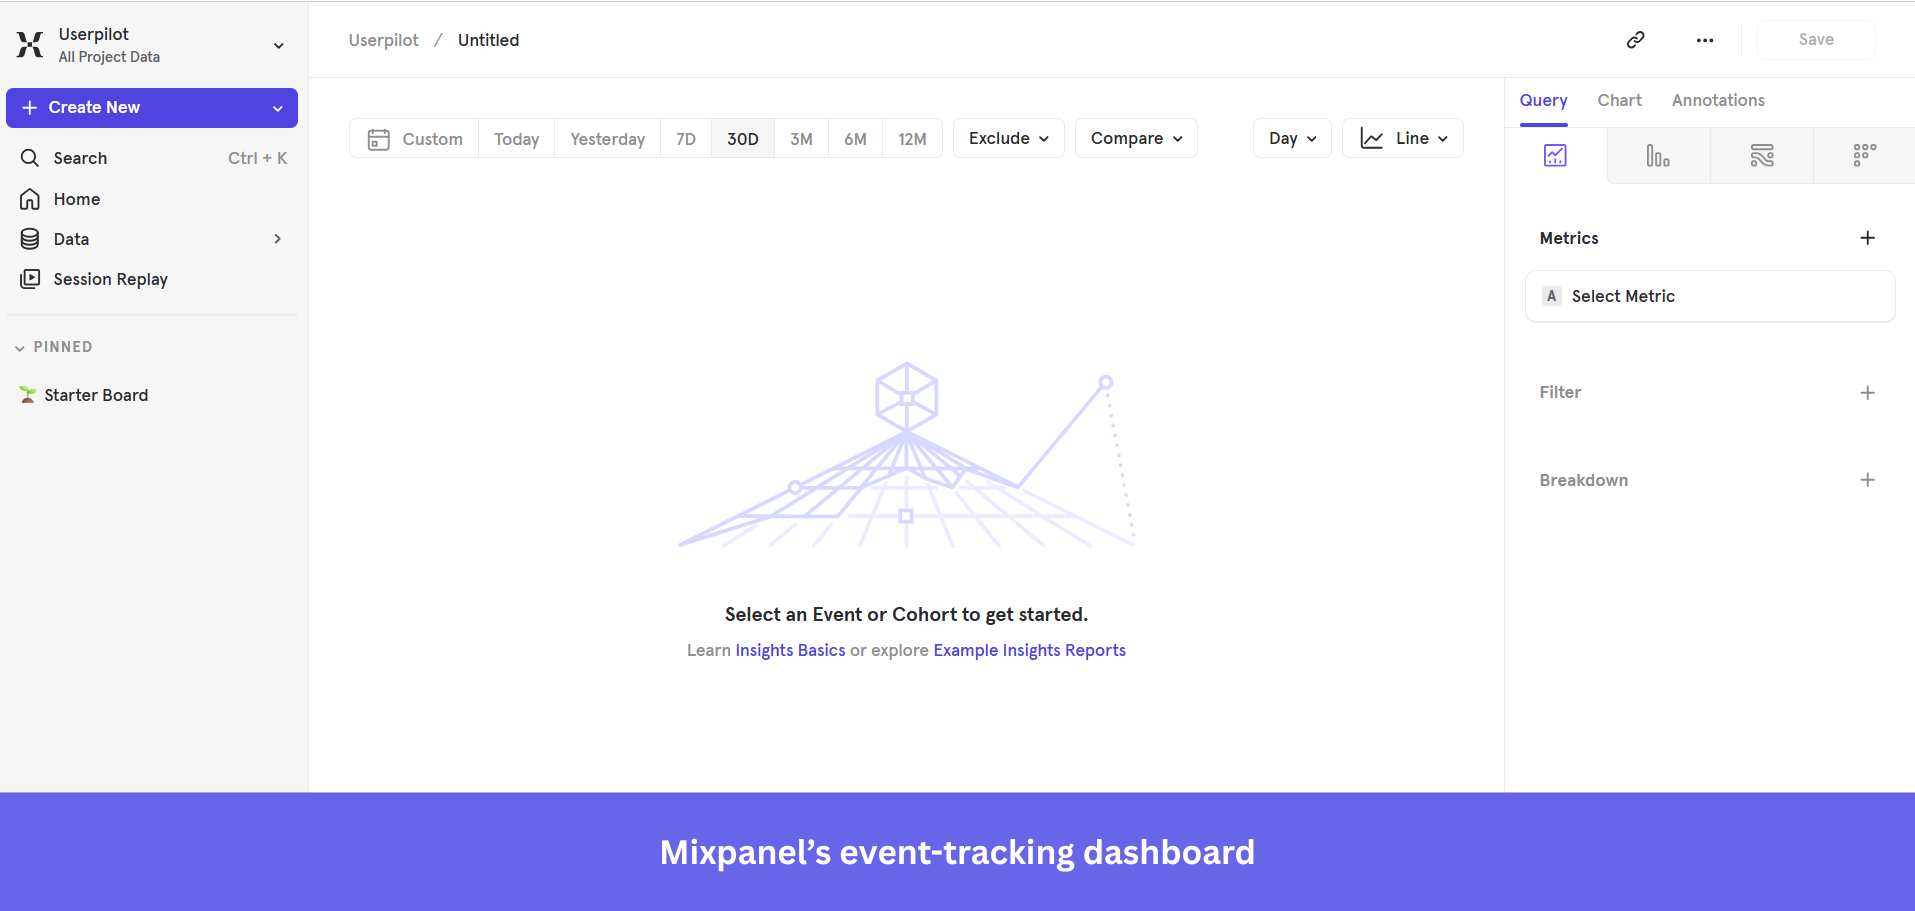
1. Mixpanel: Best for product teams tracking event-based user behavior
- G2 rating: 4.6/5
Mixpanel is an AI-powered product analytics platform that helps product, engineering, and growth teams track user behavior, analyze conversion funnels, and visualize results.
Standout features for behavioral analytics:
- Cohort segmentation with CDP sync: Configure Mixpanel cohorts to isolate high-performing user segments and sync them directly to downstream CDPs like Segment for targeted campaigns.
- Event-based tracking: Every user action is captured as an event with custom properties, giving teams a granular, real-time view of how individuals move through the product.
- Session Replay with heatmaps: Provides session replay paired with heatmaps to record and visualize user sessions, showing aggregated clicks, scrolls, and engagement hotspots.
What real users say about Mixpanel:
Mixpanel pros:
- Ease of use: “What I like most about Mixpanel is how clearly it shows user activity. I can see what users are doing step by step, like where they click, where they stop, and what features they actually use.” (G2)
- Strong analytics: “You can see user adoption or figure out areas to improve. You can also see what users are using that particular feature. Our product team uses it often and we have reports for each of our feature releases.” (G2)
Mixpanel cons:
- Expensive: “As data volume grows, costs can increase quickly, which can be challenging for smaller teams or early stage products.” (G2)
- Management issue: “You have to be really strict with how you name events in your code. If you aren’t careful, the data gets messy and hard to read.” (G2)
Mixpanel pricing:
Mixpanel’s pricing scales with feature usage and tracked events, making it flexible enough for enterprise teams that need analytical depth.
- Free plan ($0): Up to 1M monthly events.
- Growth plan: Starts at $0 for 1 month, then $0.28 per 1K events.
- Enterprise: Custom pricing.
2. Userpilot: Best for SaaS teams improving in-app user onboarding and product adoption
- G2 rating: 4.6/5
Userpilot is a no-code product growth platform that helps SaaS teams and product managers create personalized in-app experiences, from onboarding to feature adoption and retention, without any engineering support.
Standout features for behavioral analytics:
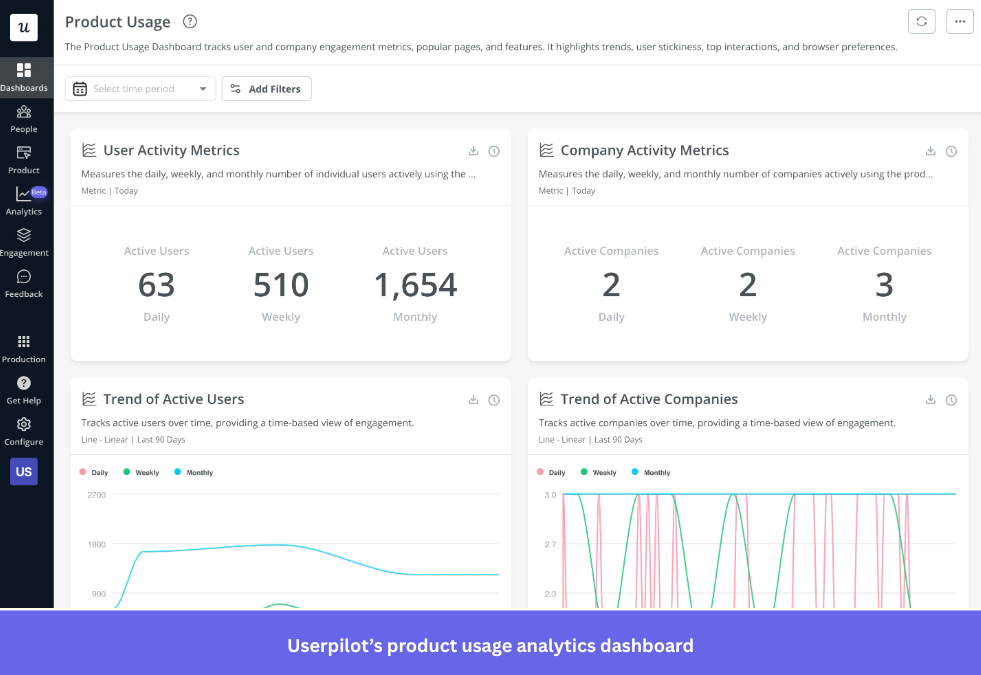
- Trend analysis: Track feature usage and user activity across your product. Spot growth spikes or declining engagement to detect anomalies and growth trends before they impact key metrics.
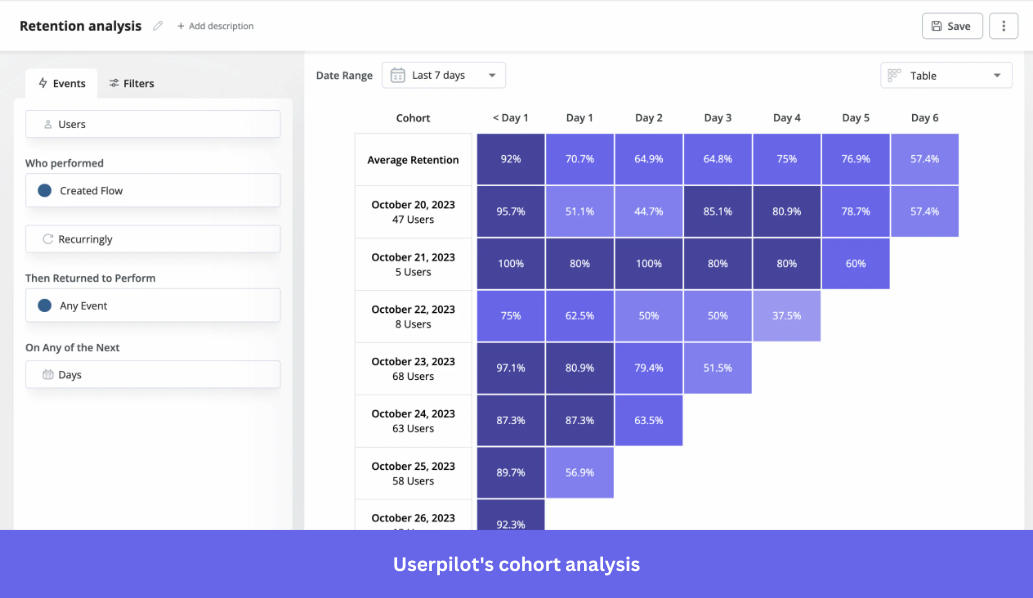
- Retention (cohort) analysis: Segment users based on shared behaviors or attributes and track how each cohort engages over time. Layer in NPS responses to understand the “why” behind each cohort’s behavior.

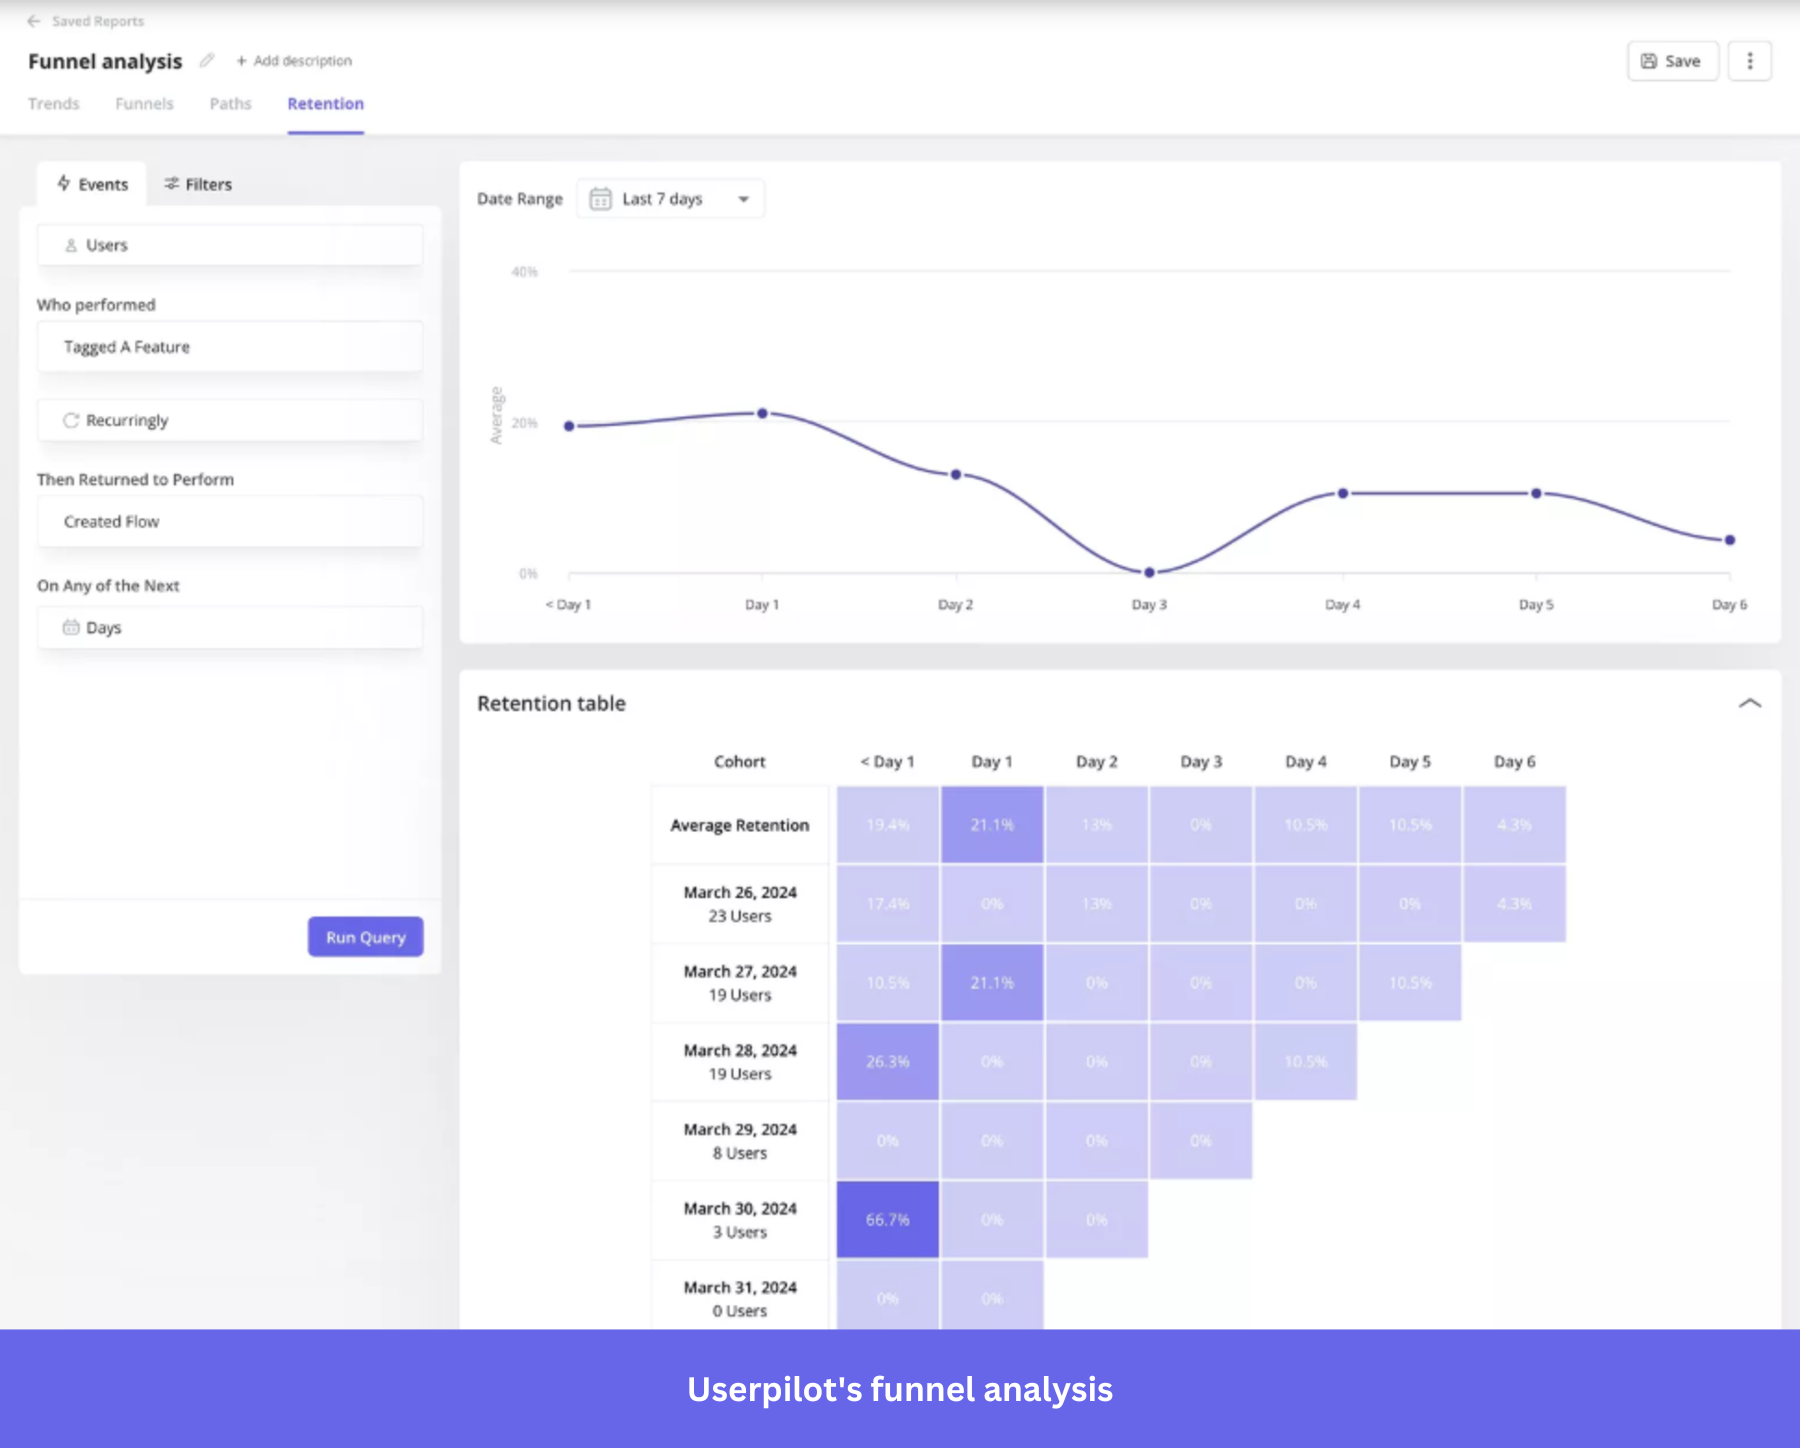
- Funnel analysis: Userpilot maps each step of the user journey, from sign-up to activation, to identify drop-off points and pinpoint bottlenecks impacting conversion rates. Pair it with path analysis to see the unexpected detours that reveal where the experience breaks down.
- Custom analytics dashboards: Build custom dashboards tailored to the metrics your team actually cares about: activation rates, feature adoption, product usage, and more.
What real users say about Userpilot:
Userpilot pros:
- Customer support: “UserPilot customer support has been great and very responsive.” (G2)
- Robust feature set: “Once you get into the product, tagging pages is easy, running reports and setting up dashboards is intuitive, and segmenting and filtering behaves exactly as you would expect.” (G2)
Userpilot cons:
- Limited customization: “Although customization is good overall, there are occasional limitations when trying to perfectly match the brand design. More granular design control would be welcome.” (G2)
- Expensive: “During evaluation, I felt that pricing might be a concern for small teams or learners.” (G2)
Userpilot pricing:
Userpilot uses an MAU-based pricing model and offers a 14-day free trial (no credit card required). The pricing suits mid-market to enterprise SaaS companies with product-led growth.
- Starter: Starts at $299/month, up to 2,000 MAUs.
- Growth: Custom pricing, starts from 5,000 MAUs.
- Enterprise: Custom pricing, full feature access.
Take a look at how Zoezi used Userpilot to understand and improve user retention:
Zoezi, a wellness SaaS platform, initially struggled with limited visibility into how users interacted with their product. Without clear behavioral data, the team found it difficult to prioritize features or understand which parts of the product were actually delivering value.
To solve this, they evaluated four tools: Userpilot, ProductFruits, Appcues, and Pendo. After rigorous testing, Isa Olsson, UX researcher and designer at Zoezi, found Userpilot to be the perfect match because it offered a combination of product analytics, in-app engagement, and feedback collection in one platform at a good price.

After implementing Userpilot analytics, Zoezi started tracking user behavior across key flows and quickly uncovered underused features and friction points. They used in-app flows and a resource center to guide users more effectively and improve communication at critical moments.
The impact was that the team could prioritize product decisions and allocate resources based on real usage data. This increased feature adoption and improved Zoezi’s communication with its customers inside the product. Isa says,
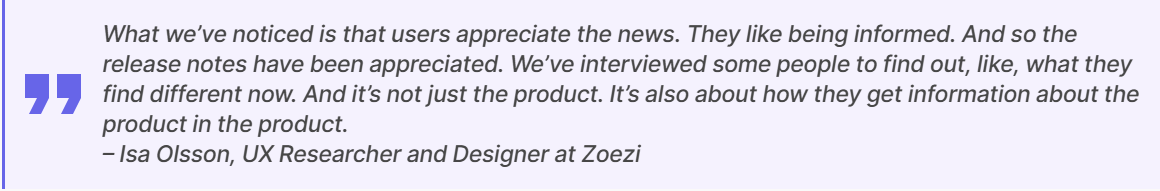
3. Google Analytics 4 (GA4): Best for marketers monitoring cross-channel user behavioral data
- G2 rating: 4.5/5
GA4 is Google’s analytics platform that uses an event-based model to track user behavior across websites and mobile apps, with native integrations across media platforms.
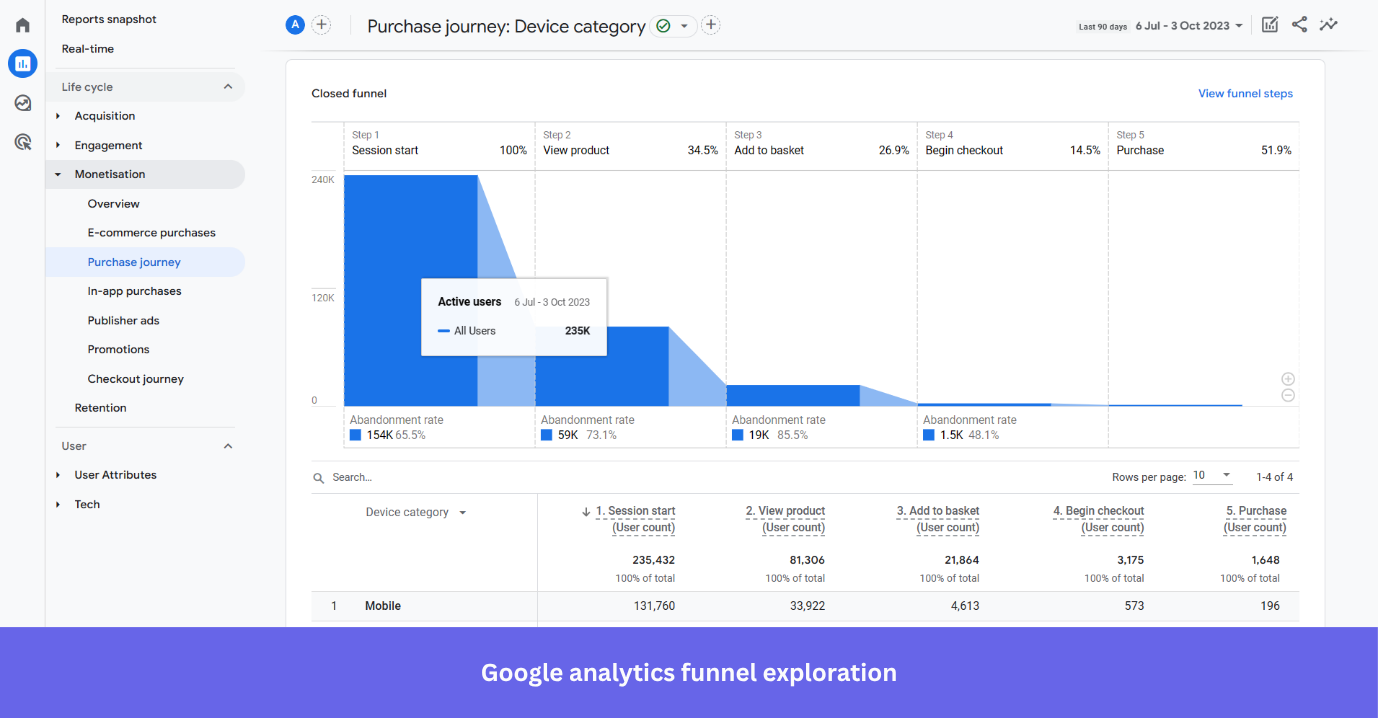
Standout features for behavioral analytics:
- Funnel exploration: Build custom funnels to visualize exactly where users drop off across any multi-step flow, from landing page to conversion.
- Behavioral modeling for “Consent” mode: When users decline analytics cookies, GA4 uses machine learning to estimate their behavior based on similar users who accept cookies, so your behavioral data stays complete.
- Behavioral flow analysis (path exploration): Analyze how users move between pages and screens to understand navigation patterns and identify friction points.
Note: GA4 isn’t suited for complex SaaS workflows or deep feature adoption analysis, as it relies on sampled, aggregate data. For accurate, user-level insights, consider dedicated Google Analytics alternatives built for SaaS.
What real users say about GA4:
GA4 pros:
- Smooth integration: “The integration with Google Ads, Search Console, and other Google tools makes performance analysis and optimization much more effective.” (G2)
- Detailed analytics: “There are uncountable things I like about Google Analytics, but if I had to highlight one, it would be how clearly it shows where users came from and how they behaved on the site.” (G2)
GA4 cons:
- Unintuitive: “Some dislikes I have about Google Analytics are that it has a steep learning curve, especially with GA4, which can feel unintuitive compared to previous versions.” (G2)
- Hard to find reports: “Some standard reports that were easily accessible in Universal Analytics now require extra configuration, and sampling or data discrepancies can occasionally make analysis less straightforward.” (G2)
GA4 pricing:
Google Analytics follows a freemium model, with a free version that covers core analytics needs suitable for SMBs and marketers. The paid enterprise tier (Google Analytics 360) offers advanced capabilities, available through custom pricing.
4. Heap: Best for teams who need usage data without pre-tagging events
- G2 rating: 4.4/5
Heap, now part of Contentsquare, is a behavioral analytics platform that auto-captures user interactions across all touchpoints without manual event tagging.
It applies data science to help product and customer success teams identify friction, improve conversion, and make faster decisions.
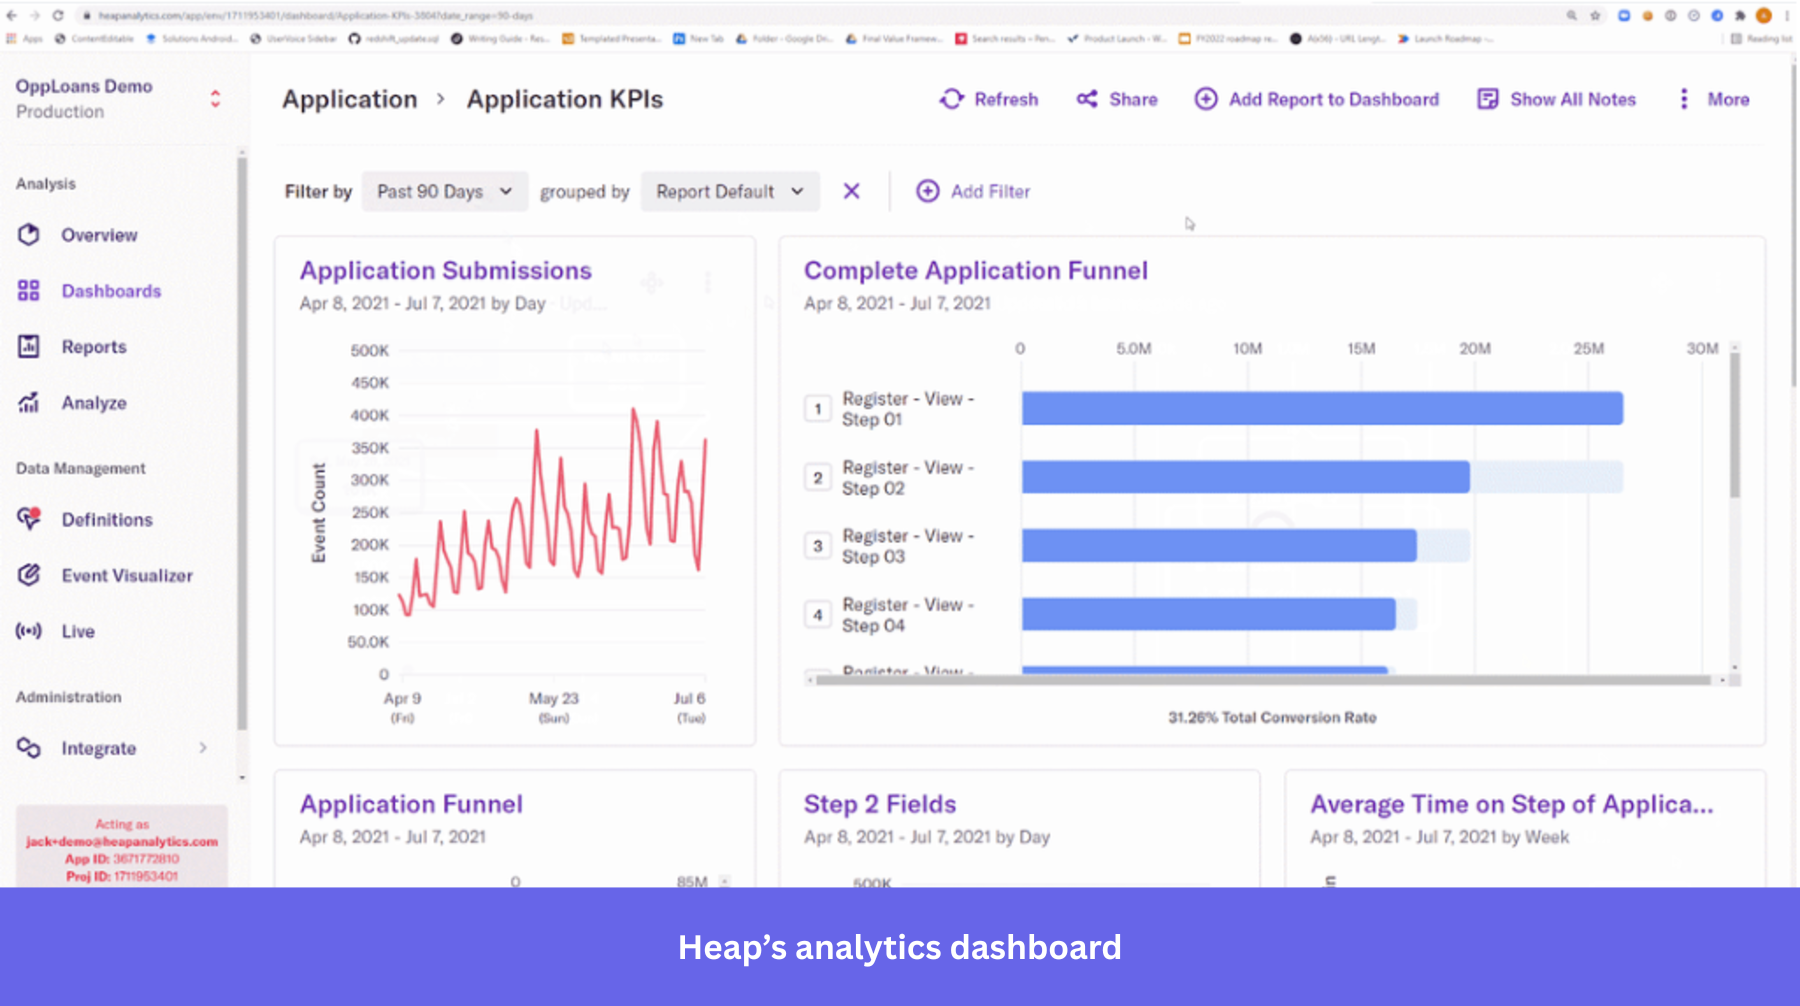
Standout features for behavioral analytics:
- Effort analysis: Pinpoints the steps in your product where users experience the most friction. It is backed by Heap Illuminate, which flags problem areas you weren’t even looking for using quantitative data.
- Heap Autocapture: Automatically records every click, tap, swipe, and page view from day one without manual tracking and developer involvement.
- Journey maps: Presents a visual map of the paths users take to navigate through your product and highlights the conversion rate for each step.
What real users say about Heap:
Heap pros:
- Ease of use: “I like that Heap is so easy for non-technical team members to be able to create tracking events without the need for any coding knowledge or getting the engineering team involved.” (G2)
- Automation: “Heap’s automatic event tracking is its strongest feature. It significantly reduces the need for manual instrumentation, which saves time for product and design teams.” (G2)
Heap cons:
- Delayed performance: “Occasional performance lag is noticeable when working with very large datasets.” (G2)
- Data management issue: “Sometimes the data can be overwhelming. With auto capture Heap collects a huge amount of data and it can be tricky to sift through it all to find the insights that really matter.” (G2)
Heap pricing:
Heap offers custom, usage-based pricing with a 14-day free trial, along with a free plan for limited usage, ideal for product and UX teams at mid-sized companies. The higher plans scale with data volume and feature access.
5. Hotjar: Best for UX teams combining heatmaps, replays, and feedback
- G2 rating: 4.3/5
Hotjar, also a part of Contentsquare, is a no-code visual behavior analytics tool that helps product and UX teams understand and identify usability issues, confusing navigation, and UI roadblocks through heatmaps, session recordings, funnels, and surveys.
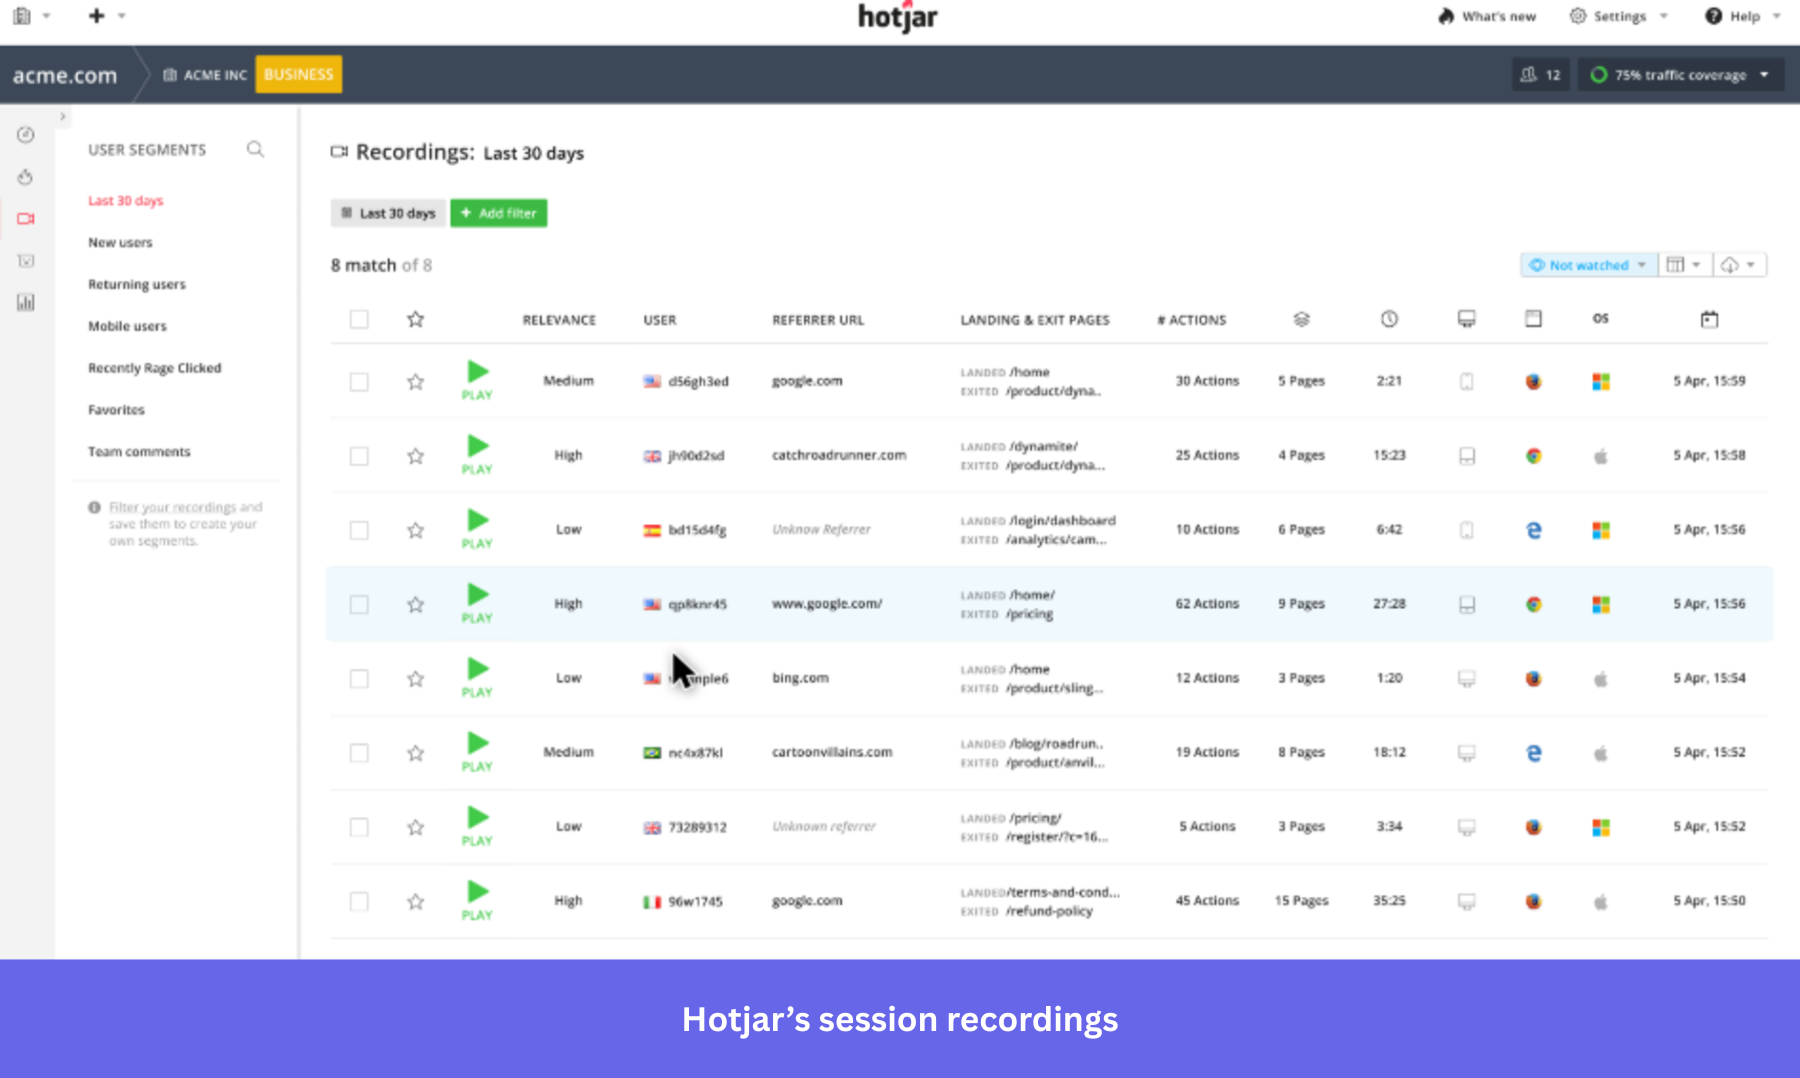
Standout features for behavioral analytics:
- Session replay: Captures full DOM recordings of user sessions, flagging rage clicks, U-turns, and error clicks, with an AI summary that surfaces friction points and exit triggers per session.
- Heatmaps: Aggregates click, scroll, and move data into visual maps, with rage click detection to pinpoint drop-off points and ignored UI elements.
- Surveys & feedback: Collects in-product feedback with NPS scores, satisfaction ratings, and open-ended questions, with AI-powered sentiment analysis that categorizes responses automatically.
What real users say about Hotjar:
Hotjar pros:
- Clear heatmaps: “Hotjar gives me a clear overview of user interaction through heatmaps, whether people are browsing on mobile or desktop, and across platforms from Windows to macOS.” (G2)
- Easy to use: “The platform is incredibly intuitive and easy to use – even non-technical team members quickly mastered it.” (G2)
Hotjar cons:
- Recording constraints: “The session recording limits can be restrictive, and once you hit your quota, visibility drops unless you upgrade.” (G2)
- Limited filtering: “Some advanced filtering options in session recordings could be more granular.” (G2)
Hotjar pricing:
Hotjar pricing follows a modular pricing model with separate plans for behavior analytics (Observe), feedback (Ask), and user research (Engage). It starts with a free plan, and the pricing suits freelancers, small-to-mid-sized teams, and growing businesses.
6. Fullstory: Best for enterprise SaaS teams to diagnose UX via AI-led session replays
- G2 rating: 4.5/5
Fullstory is a digital experience analytics platform that combines session replay, conversion funnels, advanced search, and UX analytics to improve user retention.
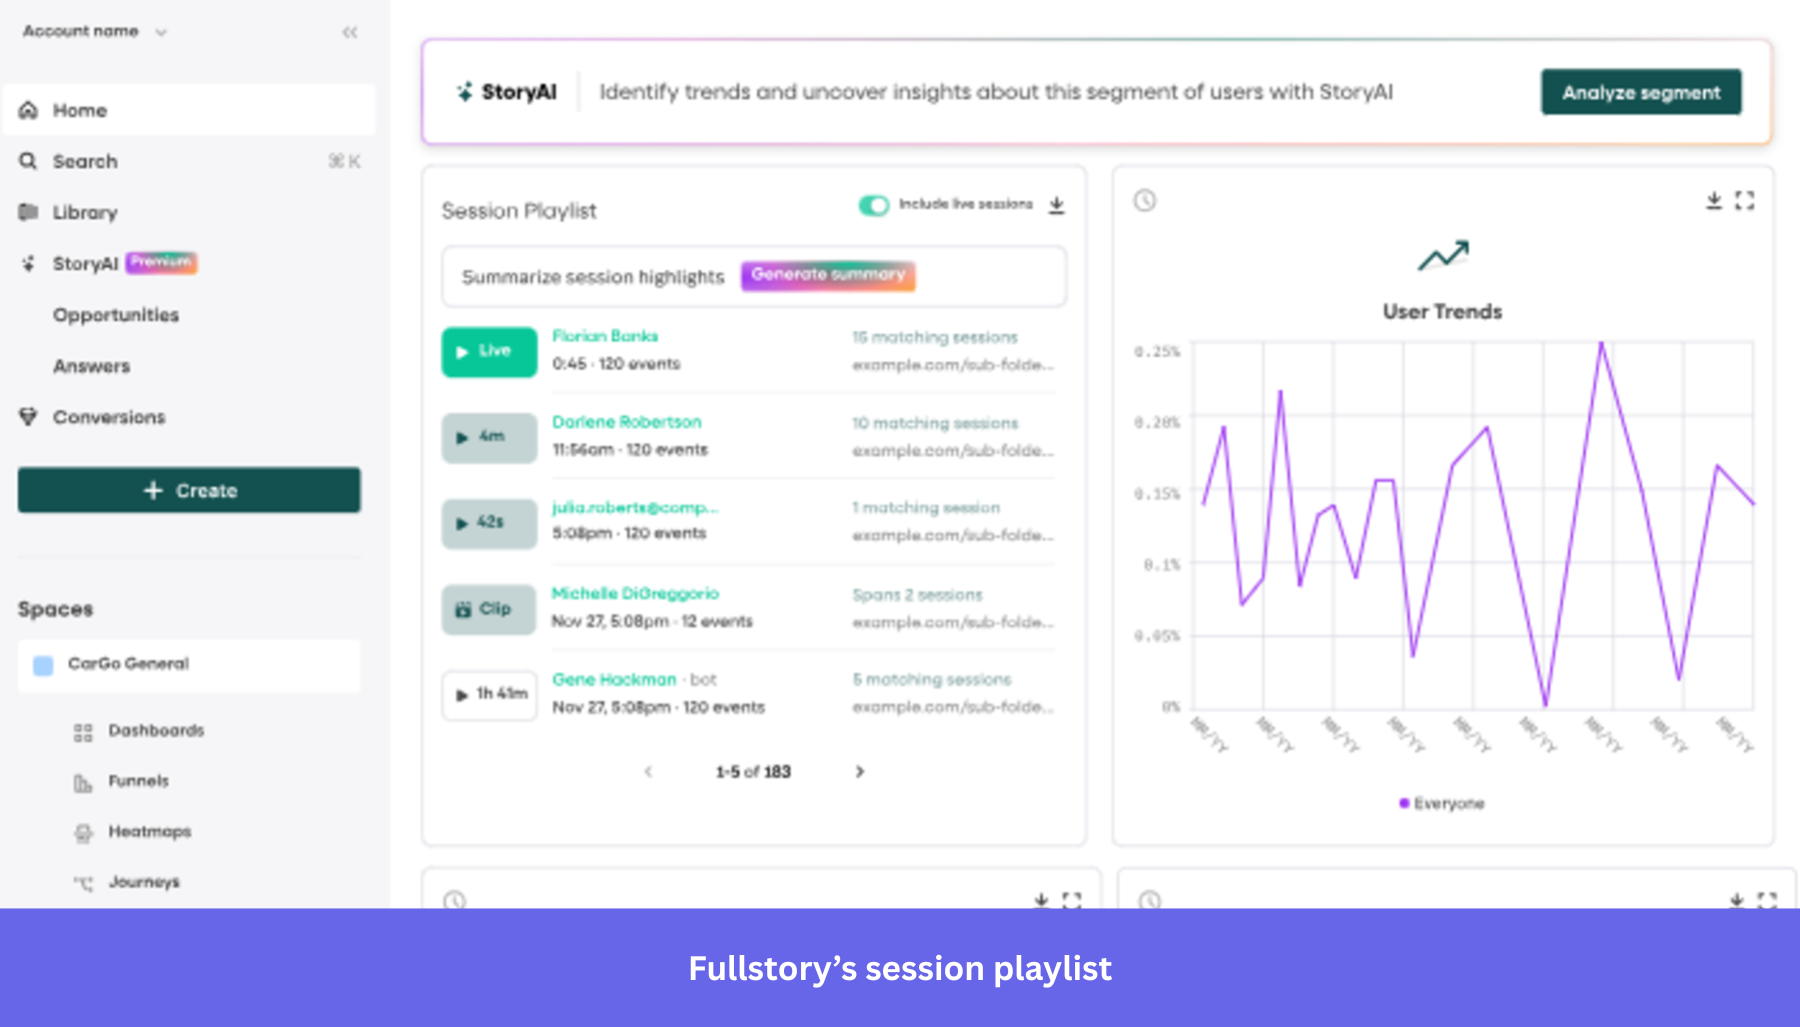
Standout features for behavioral analytics:
- Autocapture (Fullcapture): Fullcapture automatically captures every user interaction without manual event tagging, using a single lightweight script. It’s fully retroactive, meaning historical data is always available for analysis, and it auto-adjusts when the site or app changes.
- Fullstory Anywhere: Connects behavioral data directly to your existing tools, data warehouse, and workflows. You can trigger real-time actions and personalized experiences based on user behavior.
- AI-powered session replay: Records user sessions across desktop and mobile apps, with StoryAI’s one-click summaries instantly surfacing friction points and behavioral patterns.
What real users say about Fullstory:
Fullstory pros:
- Strong customer support: “What I like best about FullStory is the people and the partnership. The team, especially Julie and Jackson, are incredibly helpful, approachable, and genuinely invested in our success.” (G2)
- Detailed insights: “Observing the ways users navigate through the product, identifying where they encounter obstacles, and pinpointing the moments when they show interest in subscribing provides invaluable insights.” (G2)
Fullstory cons:
- Learning curve: “Navigating the software isn’t always straightforward, and it often demands a certain level of knowledge and training to achieve what you need.” (G2)
- Limited features: “I would like to have more comprehensive tools for tracking user flows on a broader scale. Currently, this feature feels quite limited.” (G2)
Fullstory pricing:
Fullstory’s pricing model is ideal for enterprise customers who need an advanced digital experience platform. It offers a free plan with 30,000 monthly sessions and access to core features, but it does not publicly disclose its pricing. You need to contact sales for a custom quote.
7. PostHog: Best for engineering teams to run open-source behavioral analytics
- G2 rating: 4.5/5
PostHog is an open-source, self-hosted alternative to traditional analytics platforms for engineering teams that need user behavior analytics and A/B testing in a unified platform to ship better products without compromising on data ownership.
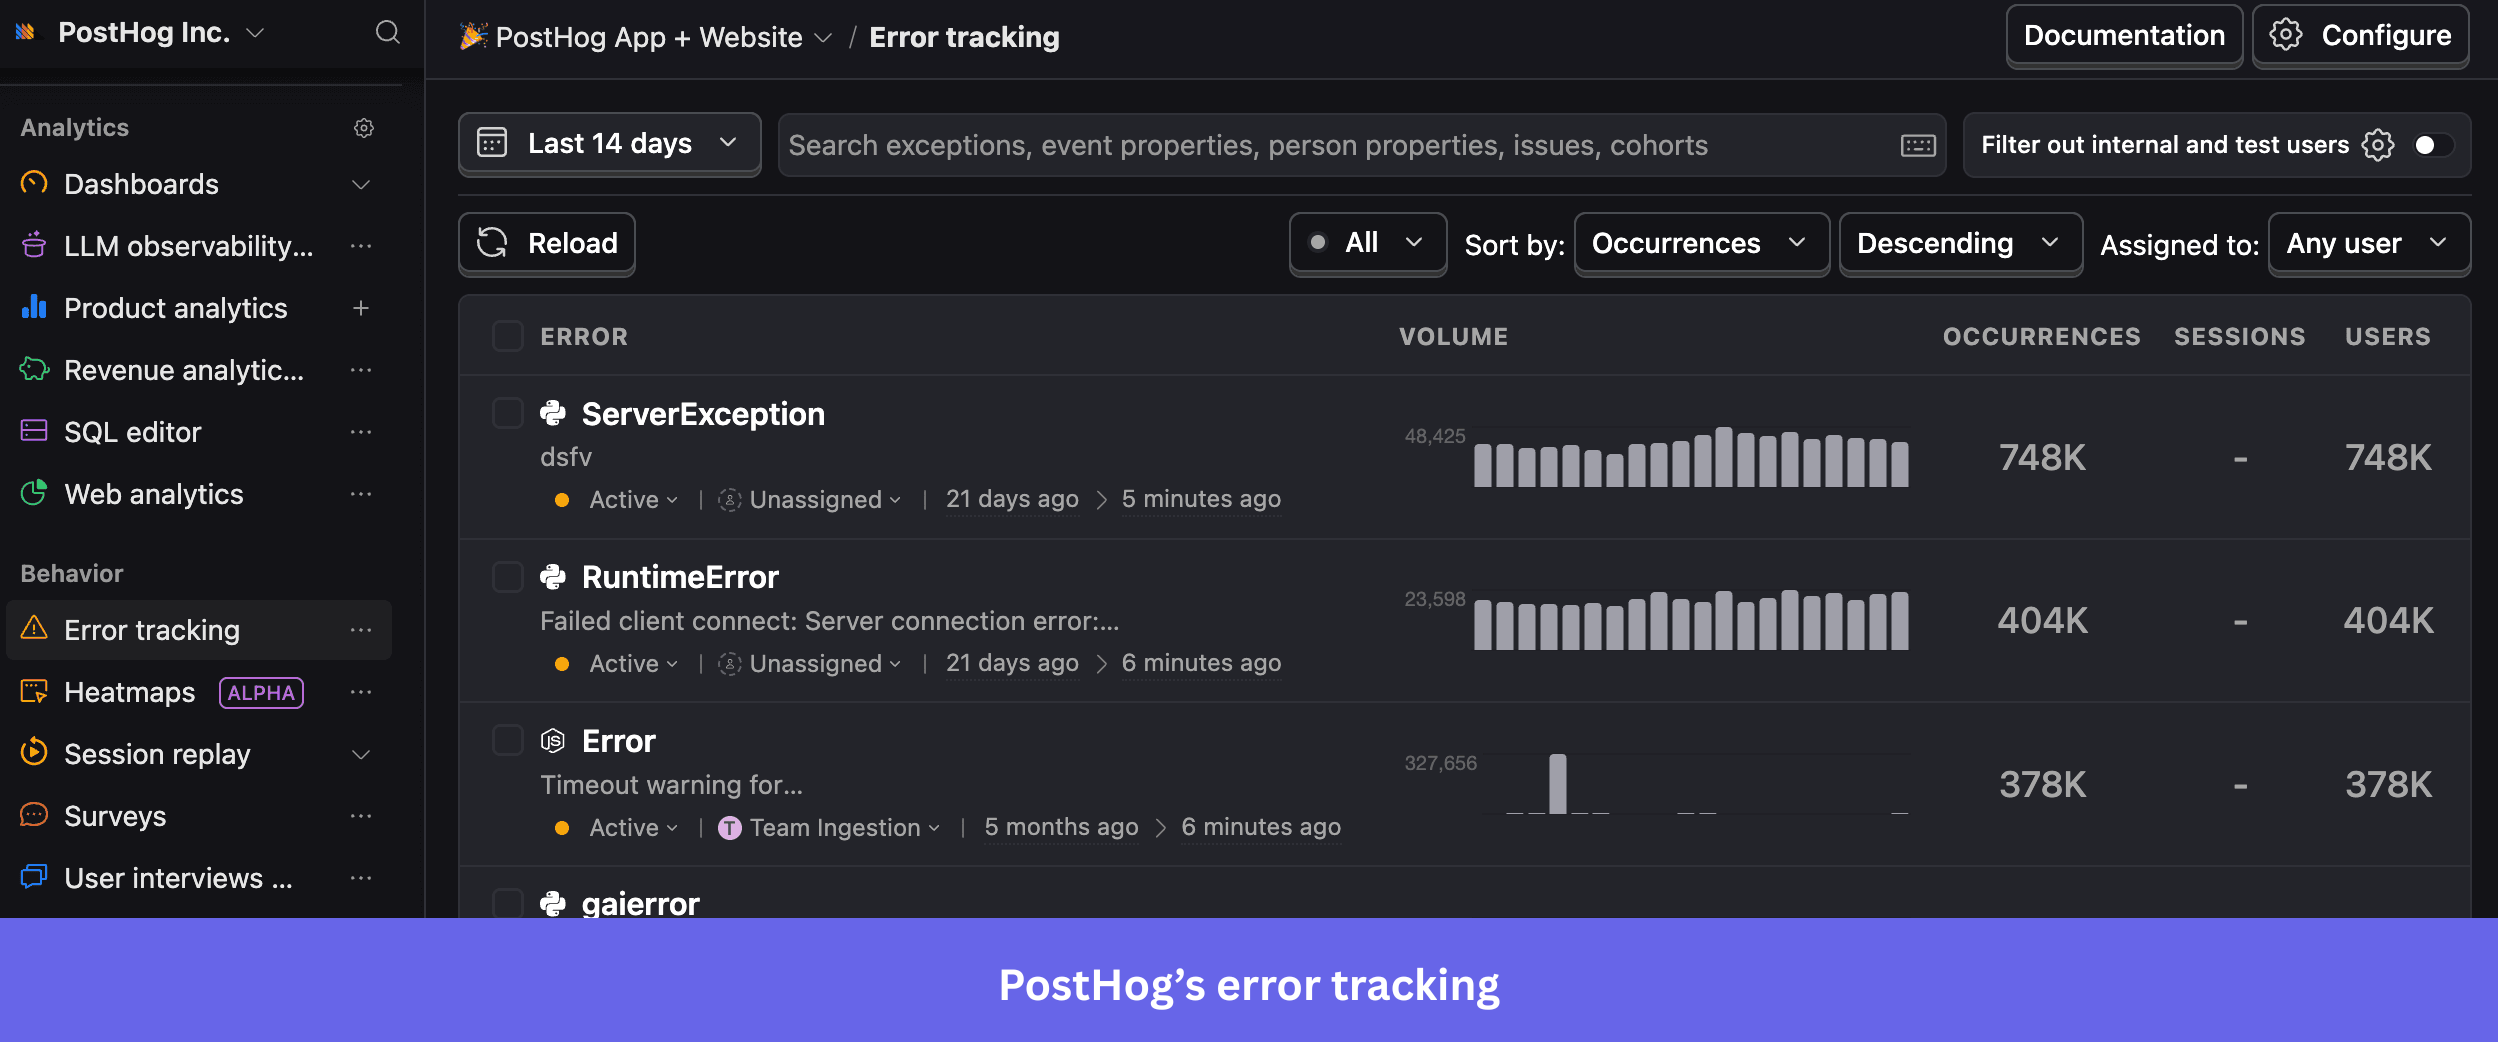
Standout features for behavioral analytics:
- Feature Flags: Roll out features to specific user segments without redeploying code and measure their impact on user behavior through A/B testing.
- Error tracking: Captures exceptions and runtime errors with stack traces. It groups similar issues and links them to session recordings and user behavior for faster debugging.
- Group analytics: Tracks behavior at the account or company level, not just individual users. If you’re a B2B SaaS team, this helps you measure adoption, engagement, and churn across the entire organization.
What real users say about PostHog:
PostHog pros:
- Detailed recordings: “The user recordings are super useful, allowing me to see what users do and click on, and helping me understand where they’re confused.” (G2)
- Easy setup: “Additionally, the initial setup and onboarding with PostHog were pretty easy and straightforward, which I find quite beneficial.” (G2)
PostHog cons:
- Initial learning curve: “There is a bit of a learning curve at the beginning, especially when exploring some of the more advanced features.” (G2)
- Weak documentation: “I had some troubles with the documentation. I found some confusing information in some places about how to add custom data to the tracking event.” (G2)
PostHog pricing:
PostHog uses a usage-based pricing model with generous free tiers, including up to 1M events, 5K session replays, and 1M feature flag requests per month for free. The model is best suited for engineering and developer-led teams that want flexibility and self-hosting options.
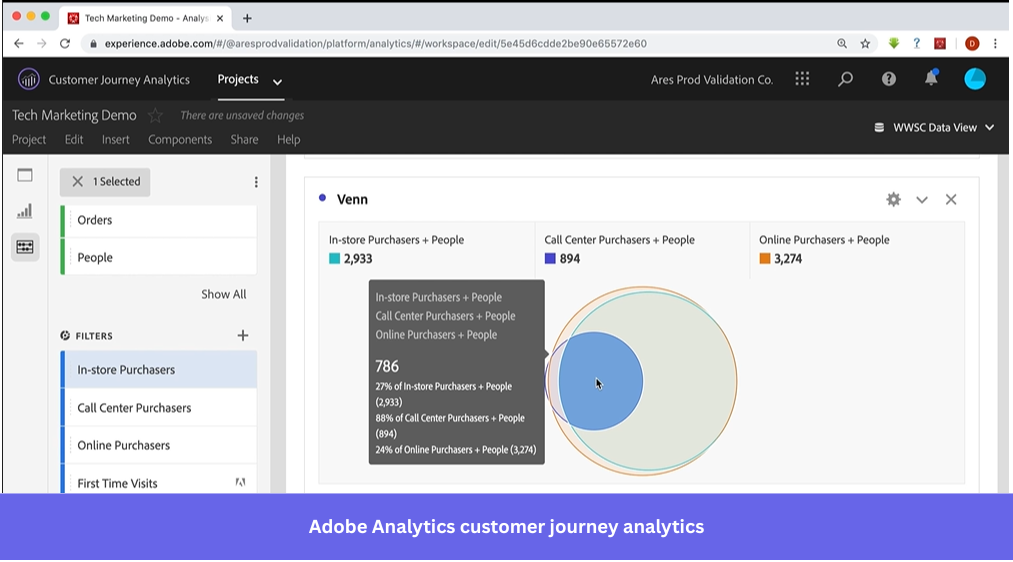
8. Adobe Analytics: Best for enterprises requiring multi-channel behavioral analytics
- G2 rating: 4.2/5
Adobe Analytics is an enterprise-grade digital and marketing analytics suite that unifies customer data across web, mobile, product, and content channels to help marketing teams make faster, data-driven decisions.
Standout features for behavioral analytics:
- Cross-channel segmentation: Build segments that pull data from multiple sources like CRM, call centers, point-of-sale systems, and email into a single definition. You get a unified view of user behavior across every touchpoint, not just one channel.
- AI-driven insights: Adobe Analytics embeds agentic and generative AI to automate segmentation, attribution, anomaly detection, and data queries. Teams get plain-language insights and auto-flagged anomalies without manually digging through reports.
- Real-time reporting: Adobe captures and streams behavioral data into an auto-updating dashboard with under two minutes of latency, refreshing minute-by-minute. You can track live traffic, trending content, and campaign performance.
What real users say about Adobe Analytics:
Adobe Analytics pros:
- Customizable reports: “I like that Adobe Analytics supports highly customized reports. We can break down the data to the minutest time interval, which helps us see what happened and how many users have logged on during a specific time frame.” (G2)
- Deep insights: “It gives me deep insights into user behavior and allows for flexible reporting, which helps me make informed decisions and optimize strategies more confidently.” (G2)
Adobe Analytics cons:
- Learning curve: “One thing that could be improved is the learning curve, especially for new users, since some features aren’t very intuitive at first.” (G2)
- Performance lags: “There can sometimes be a noticeable lag in data processing, meaning that you don’t always receive instant, up-to-the-second feedback unlike other simpler platforms.” (G2)
Adobe Analytics pricing:
Adobe Analytics does not publicly list its pricing. You need to contact sales to get a customized quote based on your data volume and implementation needs. The pricing model is ideal for large enterprises with complex, cross-channel analytics needs.
Stop building in the dark
By now, you’ve seen there’s no shortage of tools that can help you understand your users.
What sets a tool apart is how quickly your team can understand data and make product improvements. Amplitude Analytics gives you depth, but that depth can come at the cost of speed, clarity, and ease of use. And that’s exactly where the Amplitude alternatives in this list step in.
In my experience, building a product users love requires a unified platform to analyze user behavior, collect qualitative feedback, and deploy user onboarding tools in one place.
If that’s what you’re aiming for, consider signing up for Userpilot’s free trial and exploring how it gives you a complete end-to-end picture of your customer journey.
Userpilot strives to provide accurate information to help businesses determine the best solution for their particular needs. Due to the dynamic nature of the industry, the features offered by Userpilot and others often change over time. The statements made in this article are accurate to the best of Userpilot’s knowledge as of its publication/most recent update on March 25th, 2026.
FAQ
What is the best alternative to Amplitude?
The best alternative to Amplitude depends on your specific needs. Mixpanel is strong for product analytics, Userpilot excels at product adoption and in-app engagement, and GA4 works well for web analytics.
Teams choose other analytics tools based on ease of use, pricing, and whether they need analytics alone or a complete product growth stack.
Who competes with Amplitude?
Amplitude faces competition across multiple categories, depending on what you are looking for:
- Mixpanel and Heap: Closest competitors in the product analytics space.
- Userpilot: Strong alternative for product adoption and user onboarding.
- Google Analytics 4 and Adobe Analytics: Better suited for broader digital analytics.
- Hotjar and Fullstory: Focus on behavioral analytics and session recording.
- PostHog: Ideal for engineering-led teams looking for an open-source solution.
Is Amplitude a unicorn?
Yes, Amplitude became a unicorn on May 21, 2020, after raising $50 million in a Series E round led by GIC, which valued the company at $1 billion.
Which is better, Mixpanel or Amplitude?
Amplitude is stronger for behavioural analytics and large-scale data exploration, while Mixpanel is generally considered easier to use and more accessible for smaller teams. Mixpanel is also more affordable at lower usage tiers.
The right choice depends on your team size, technical ability, and the depth of analysis you need.
About the author