7 Actionable Tactics on Using Analytics To Improve Customer Engagement in SaaS


Are you planning on using analytics to improve customer engagement and gain a competitive advantage?
For SaaS companies, leveraging numerous customer data points have tremendous benefits, such as:
- getting actionable insights.
- identifying emerging trends.
- increasing the CLV (customer lifetime value).
- building stronger customer relationships.
In today’s article, you’ll find seven engagement strategies that use customer analytics to boost user engagement, increase retention, and reduce churn.
Ready to get started? Let’s go!
Overview of using analytics to improve customer engagement in SaaS
- Customer engagement refers to all interactions a user has with your product through its app or website.
- Customer engagement is important as it helps you build strong customer relationships with your users, gain a competitive advantage, and deliver greater customer value to your users.
- You can measure customer engagement by time (monthly, weekly, or daily), channel, feature usage, or by the Customer Health Score.
- Data for customer engagement analytics can be collected in several ways. You can track customer interactions with the product, use session recordings, use heatmaps to see how customers behave in your app, and segment customers based on content engagement and the experiences they had, etc.
- To improve customer engagement through analytics, you can use the following strategies:
- Greeting customers with welcome screens to capture customer data and personalize the onboarding.
- Using onboarding checklists that provide in-app guidance drives customers to the activation point.
- Using segmentation to uncover highly engaged/disengaged customers and creating personalized flows.
- Filtering events and tagging features to trigger in-app experiences and encourage customers to interact more with the product.
- Sending NPS surveys to collect customer feedback, using response tagging, and acting on the NPS analytical data.
- Conducting A/B testing to compare multiple in-app experiences and optimizing the user journey.
- Userpilot is a comprehensive customer analytics tool that can help you implement and manage all these strategies from one place.
What is customer engagement?
Customer engagement refers to all interactions a user has with your product through its app or website. It is measured by observing how frequently users interact with an aspect of your product or other touchpoints in the customer journey.
For example, customers repeatedly interacting with one of your features makes it very popular, which indicates the feature has high customer engagement.
Why is customer engagement important?
Highly engaged customers become your loyal customers. Not only do they stay with you for a long time, but they also spend more. Analyzing customer engagement is essential for fostering and sustaining such loyalty.
Developing a better customer engagement strategy helps you:
- guide customers to the activation point
- build relationships with your users
- gain competitive advantage
- deliver greater customer value to your users.
How to measure customer engagement?
There is more than one way to measure your product’s customer engagement capabilities. You can measure by:
- Channel: Discover customer acquisition channels that bring in your most profitable customers.
- Feature usage: Improve your product development efforts by finding out your most popular and valuable features.
- Time (monthly, weekly, or daily): Find out the extent to which your product is successful in attracting loyal customers over time.
- Customer Health Score: Forecast the likelihood of getting a specific outcome from a customer based on engagement.
How to collect data to analyze customer engagement?
Here are three different ways you can collect data for customer engagement analytics.
Track customer interactions in the product
One way to increase customer engagement is by tracking customer interactions with your product and seeing what they do with it.
For example, you can measure how much time they spend with your product, use feature tagging, or both.
Feature tagging helps you answer questions such as:
- Which features your customers are using
- Where they are clicking
- Where their cursors are hovering.
This helps you understand your product’s most and least used features, providing you with some important customer behavior insights.

With Userpilot, you can easily track all sorts of interactions within the app and your primary drivers of revenue, as shown in the image above.
Use session recordings and heatmaps to see how customers behave in your app
Heatmaps are another great way to visualize where and with that your users are engaged the most. In these maps, the red regions are hot areas where customers are highly engaged, while blue represents cold areas with the least interactions.

When you combine these with session recordings – where your users are monitored for the duration of their product usage at certain times – you can get detailed insights. This makes a great starting point to create strategies to boost user engagement.
Segment customers based on content engagement and the experiences they had
Segmenting customers based on different criteria, such as engagement, interactions, and/or the experiences they had with your product, is essential if you want to create effective digital marketing strategies and collect highly accurate data.
Not all of your customers use your product for the same reason. As such, segmenting them helps you uncover the different needs of each customer group correctly, which in turn allows you to deliver a greater customer experience.

With Userpilot, you can create precise segments based on user data, company events, content engagement, and user feedback, as shown in the image above.
Lastly, remember to assess your segments frequently, as customers’ needs constantly change.
7 customer engagement strategies to improve engagement by using analytics
Organizations can use these seven proven strategies to leverage analytics and improve customer engagement.
With Userpilot, a dedicated product analytics platform, you can implement and manage all these strategies using one tool.
Use welcome screens to capture customer data and personalize the onboarding
When you use welcome screens to greet your customers, you take into account their uniqueness and identify what they plan to use your product for. This helps you establish a relationship with your customers from the get-go.
Here’s how Kontentino does it.
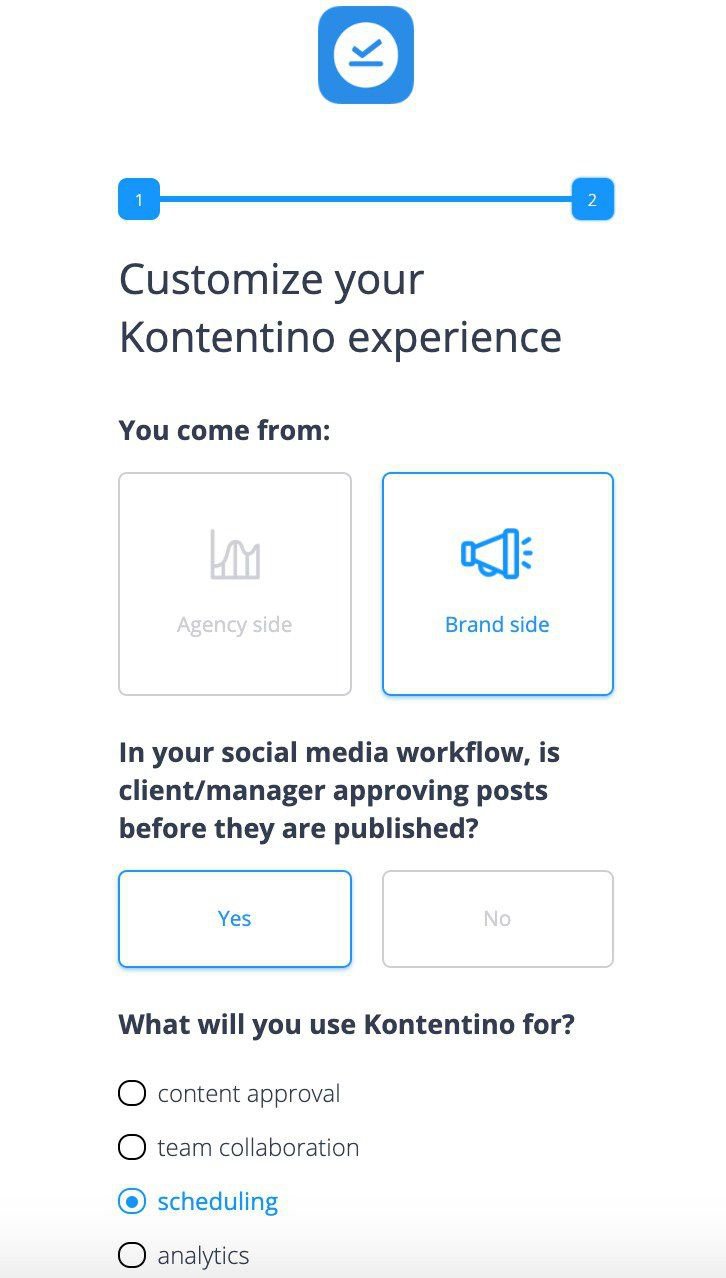
Personalized onboarding leads to high engagement, as customers will only see flows that take into account their use cases. This makes them feel more recognized and increases the chances that they’ll be with you for longer.
Use onboarding checklists to provide in-app guidance and drive customers to the activation point
An onboarding checklist contains steps a user can take to reach full product activation. For example, users are encouraged to record a video with Loom and then share it on social media as part of the product tutorial.
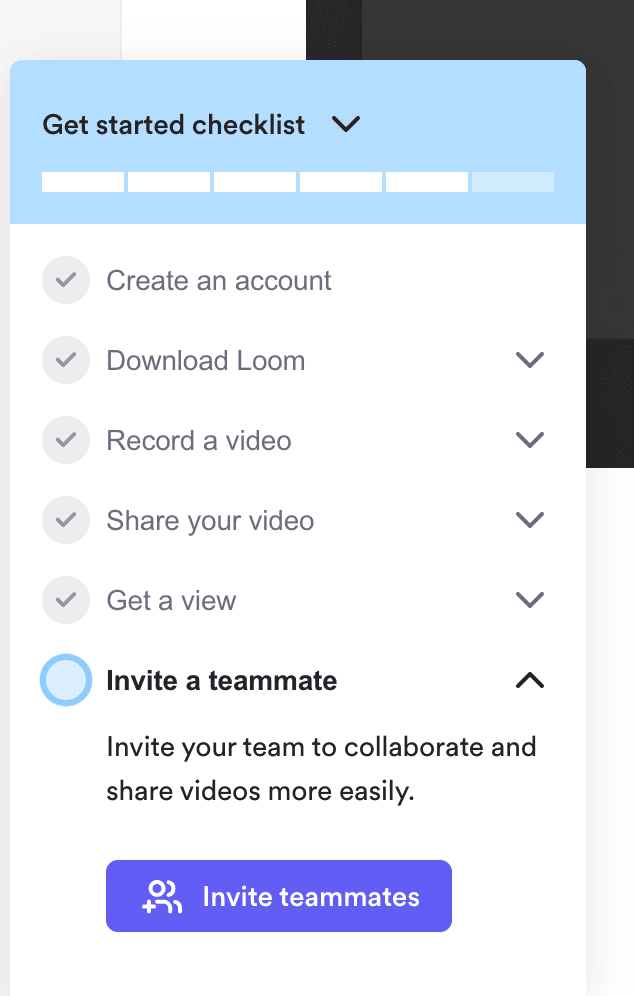
Checklists offer a great way to activate customers completely and keep them engaged as they complete tasks in the checklist. Fully guided, customers won’t be lost about the features of your product.
Userpilot features onboarding checklist analytics that allows you to see who completed it and who skipped it, enabling you to provide personalized flows to those who need support.

Use segmentation to uncover highly engaged/disengaged customers and create personalized flows
Tracking user activity enables you to segment your users based on various engagement levels, interactions, and overall experiences.
You can discover your inactive/disengaged users (customers at risk of churning), power users/highly engaged users (customers who have reached full product activation), and everyone else in between.

You can then create different marketing strategies to retain your most loyal users and win back disengaged users, improving your customer relationships further. For example, here’s how Eversign sends a re-engagement email to inactive users.

Filter events and feature tags usage and trigger in-app experiences
Tracking events and tagging features within your product give you a great view of your feature usage. It allows you to track in-app user behavior and helps you understand which aspects of your products to improve and which ones to remove.
Feature tagging is essential to understand the impact of your in-app flows on your customer engagement strategies.

Finally, you can use triggers to encourage users to interact with your product. For example, if a user adds an account or connects to one, and schedules a post, you can offer him/her a promo code.

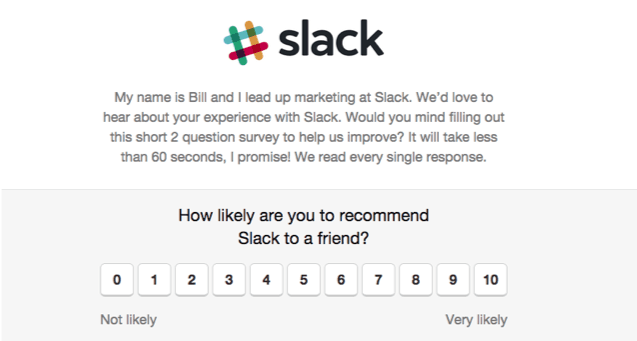
Send NPS surveys to collect customer feedback and act on the NPS analytics data
The Net Promoter Score (NPS) is a great way to measure customer loyalty and engagement and collect customer feedback. It also helps you identify your product’s promoters and detractors.
The survey asks one question to your users, “How likely are you to suggest this product to your friends?”. Users then choose an answer on a scale from 1 to 10, with 1 being the least likely and 10 being the most likely.
You can even add a qualitative follow-up question with your NPS. This helps you get further explanations for different scores.
With Userpilot’s response tagging, you can identify patterns and trends in your NPS score. For example, one user might be satisfied with the customer service you provide, while others might have complaints about your product’s usability.

Conduct A/B testing to compare multiple in-app experiences and optimize the customer journey
A/B testing refers to comparing two different experience flows to see how customers interact with them. The main idea is to see which ones work better for your product, i.e, create high engagement, and optimize the user journey.

A/B testing is necessary as it can help you save time, energy, and resources by not implementing an experience flow that won’t be appealing to users. It helps you adjust your digital marketing campaigns to the right customers, which improves conversions and increases your ROI on marketing efforts.
Conclusion
Customer engagement analytics are being used by many businesses to gain a competitive advantage, succeed in marketing, and draw in customers more successfully over the long term.
Different SaaS companies approach data analytics in different ways. What’s important is to understand what you want to achieve, as this will guide all your efforts.
While you can analyze customer engagement on your own, using an analytics platform can help you conduct your research faster and better. This saves you time, which can be used to plan your product growth strategies.
Want to start using analytics to improve customer engagement? Get a Userpilot Demo and see how you can create effective customer strategies that generate more revenue, increase user retention, and lower churn.
About the author