Looking for a customer behavior analysis example to see how you can extract valuable insights?
Well, we have 5 of them ready for you, so you’re in the right place.
In this article, you will also learn how to conduct customer behavior analysis step-by-step and how Userpilot analytics can help.
But let’s start with some background basics.
Try Userpilot Now
See Why 1,000+ Teams Choose Userpilot

What is customer behavior analysis?
Customer behavior analysis is the process of studying how customers interact with your product.
It involves collecting and analyzing qualitative and quantitative data to understand user pain points, preferences, and motivations.
Apply real-world strategies to your product
Learning from Netflix or Amazon is great, but how do you apply it? Take this 4-step assessment to find customer behavior analysis examples to improve customer engagement in your own app.
Why is analyzing customer behavior important?
It’s difficult to imagine successful SaaS products, marketing, or customer success initiatives without robust customer behavior analytics.
Why? Here are 3 reasons.
Helps make data-driven decisions
Analyzing customer behavior allows SaaS businesses to make informed decisions based on real user data.
By understanding how customers interact with your product, you can identify the most valuable features, effective engagement strategies, and where to allocate resources for maximum impact.
This ensures your decisions are based on empirical evidence rather than assumptions or hunches.
Identifies friction points in the customer journey
Customer behavior analysis helps pinpoint where users encounter bottlenecks or drop-offs in their journey.
By identifying these friction points, you can make targeted improvements to optimize the UI, enhance usability, and provide in-app support.
This leads to smoother navigation, higher conversion rates, and a better overall user experience at all stages of the funnel.
Increases customer satisfaction and customer retention
Understanding your customers’ behavior enables you to tailor your product to better meet their needs.
By addressing pain points, satisfying their desires, and enhancing the user experience, you can improve customer satisfaction.
Customer satisfaction is linked to increased retention rates and greater customer lifetime value.
Here’s the kicker:
Loyal customers don’t just renew their subscriptions regularly but often promote your product via WOM. This makes customer acquisition easier and reduces CAC.
What are the 4 types of consumer behavior?
How customers behave depends a lot on factors like price or purchase frequency. Here are four main behavior types.
- Complex buying behavior: When the customer is highly engaged in the purchase and goes to great lengths to understand the differences between brands. Normally, this happens with infrequent but expensive purchases, like cars, high-end electronics, or enterprise software.
- Dissonance-reducing buying behavior: When consumers are highly engaged in a purchase but don’t always make an effort to understand the differences (or aren’t able to), they can experience post-purchase dissonance. That’s when they seek reassurance that they’ve made the right choice.
- Habitual buying behavior: When customers make lots of regular purchases, their engagement drops and they stop paying attention to differences between products or brand reputation. Bottled water is bottled water.
- Variety-seeking buying behavior: When consumers switch to other products for the sake of variety more than anything else. Are they dissatisfied? Not at all. Just curious.
How to conduct a customer behavior analysis?
With the theory out of the way, let’s go through the process of customer behavior analysis step-by-step.
1. Define clear goals for consumer behavior analysis
The very first question to answer is why you’re doing this: Is it to improve your marketing conversion funnel? Boost new user activation and product adoption? Increase customer lifetime value through account expansion?
The answer to this question determines what tools you use, what data you collect, and how you analyze it.
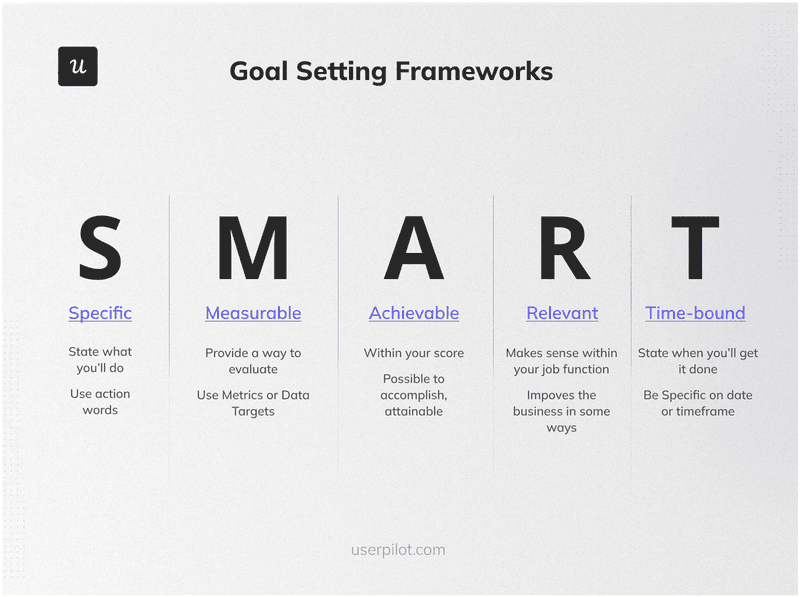
When setting goals, use a framework like OKR or SMART to ensure your goals are clear and easy to measure.
A good example of a SMART goal would be “Increase free trial conversions by 7.3% by the end of Q2.”
2. Determine which customer segments’ behavior to analyze
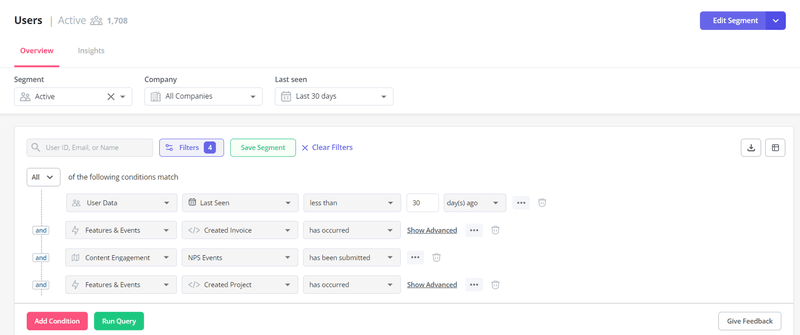
To make the user behavior analysis meaningful, narrow down its scope to specific user segments.
Let me explain:
Different user personas have different jobs to be done, so they use the product differently. In other words, their behavior differs from those of others – comparing apples to pears isn’t much use.
That’s not all.
Say you want to improve the NPS score. To do so, you need to segment the promoters, passives, and detractors and analyze their behavior separately to gain actionable insights. That’s how you can figure out what obstacles the detractors face – and how the promoters solve them.
3. Analyze quantitative data related to user behavior
Once you have singled out the segments to analyze, collect the quantitative data you need. For example, if you’re improving the activation and adoption rates, you’re most likely interested in the user engagement with your onboarding flows.
In many analytics tools, you don’t have to add any code to track events or features. You can tag them from the front end.
Next, analyze the data using relevant analytics tools, like:
- Trend analysis: To evaluate the changes in key metrics over time and find correlations between data sets.
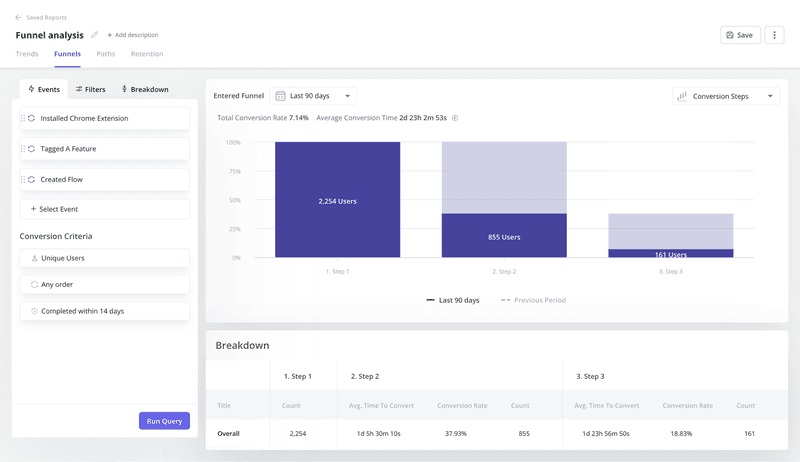
- Funnel analysis: To track how users progress from one stage of the user journey to another, analyze drop-off points, and identify friction.
- Path analysis: To map out user actions at individual journey stages, before or after a conversion event, find friction, and the happy paths.
- Retention analysis: To assess how long different user cohorts stay engaged and find the optimal time to target them with communications.
For example, if you want to optimize your sign-up flow, you can conduct funnel analysis to identify friction points. And follow up with path analysis to get detailed insights into user actions around them.
4. Collect and assess qualitative data
Quantitative data from analytics doesn’t always help you understand why users act in a particular way. To get a complete picture of their motivations and sentiments, collect qualitative data as well.
How? There are a few options:
- Surveys – both in-app and email ones.
- Interviews and focus groups.
- Customer support and customer success conversations with customers.
- Session recordings.
Qualitative data analysis used to be a chore, but modern tools have made it less punishing.
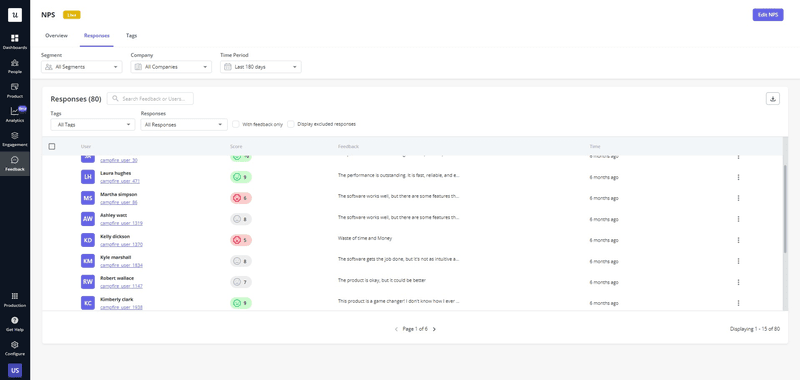
For example, Gong uses AI to extract data from customer calls while Airfocus – to summarize customer feedback. This feature is also coming to Userpilot this year and in the meantime, you can tag qualitative NPS survey responses to easily identify patterns and trends.
5. Improve the user experience based on customer data insights
Now that you’ve analyzed the quantitative and qualitative data, and understand your users’ pain points, needs, and wants, it’s time to act on the insights.
How you do it depends on the kind of problem you’ve diagnosed.
For example, if your user drops off during the sign-up process, you can streamline it by removing unnecessary steps and enabling single sign-on (SSO).
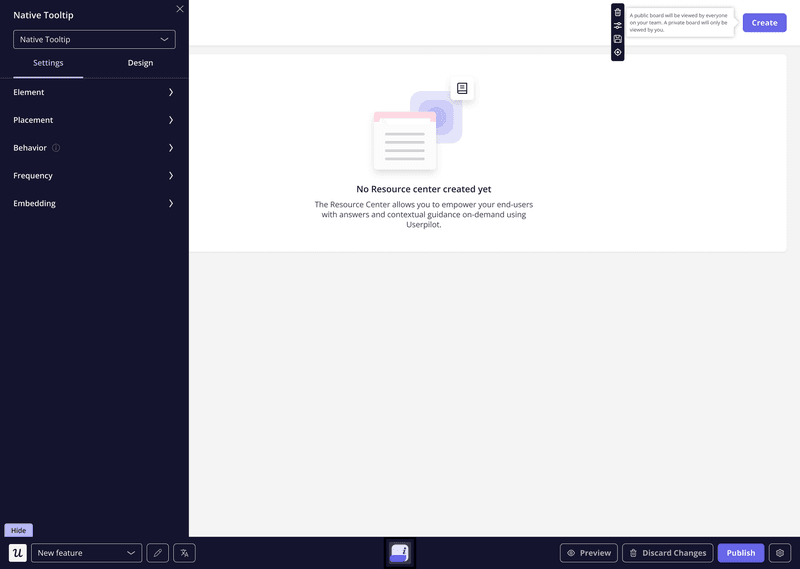
Want to improve core feature discovery inside the product and help users adopt them? Design interactive walkthroughs that guide users step by step and show them how to use it. And keep nudging them with in-app patterns until they start using it regularly.
6. Continuously analyze customer behavior data and improve experiences
So you’ve implemented the strategies. Job done, right?
Not quite.
First, how do you know they work? Second, even if they work today, can you guarantee they will tomorrow?
To evaluate the impact of your strategies, keep tracking user behavior on an ongoing basis. That’s how you can ensure they’re effective and adjust them to accommodate changes in user needs.
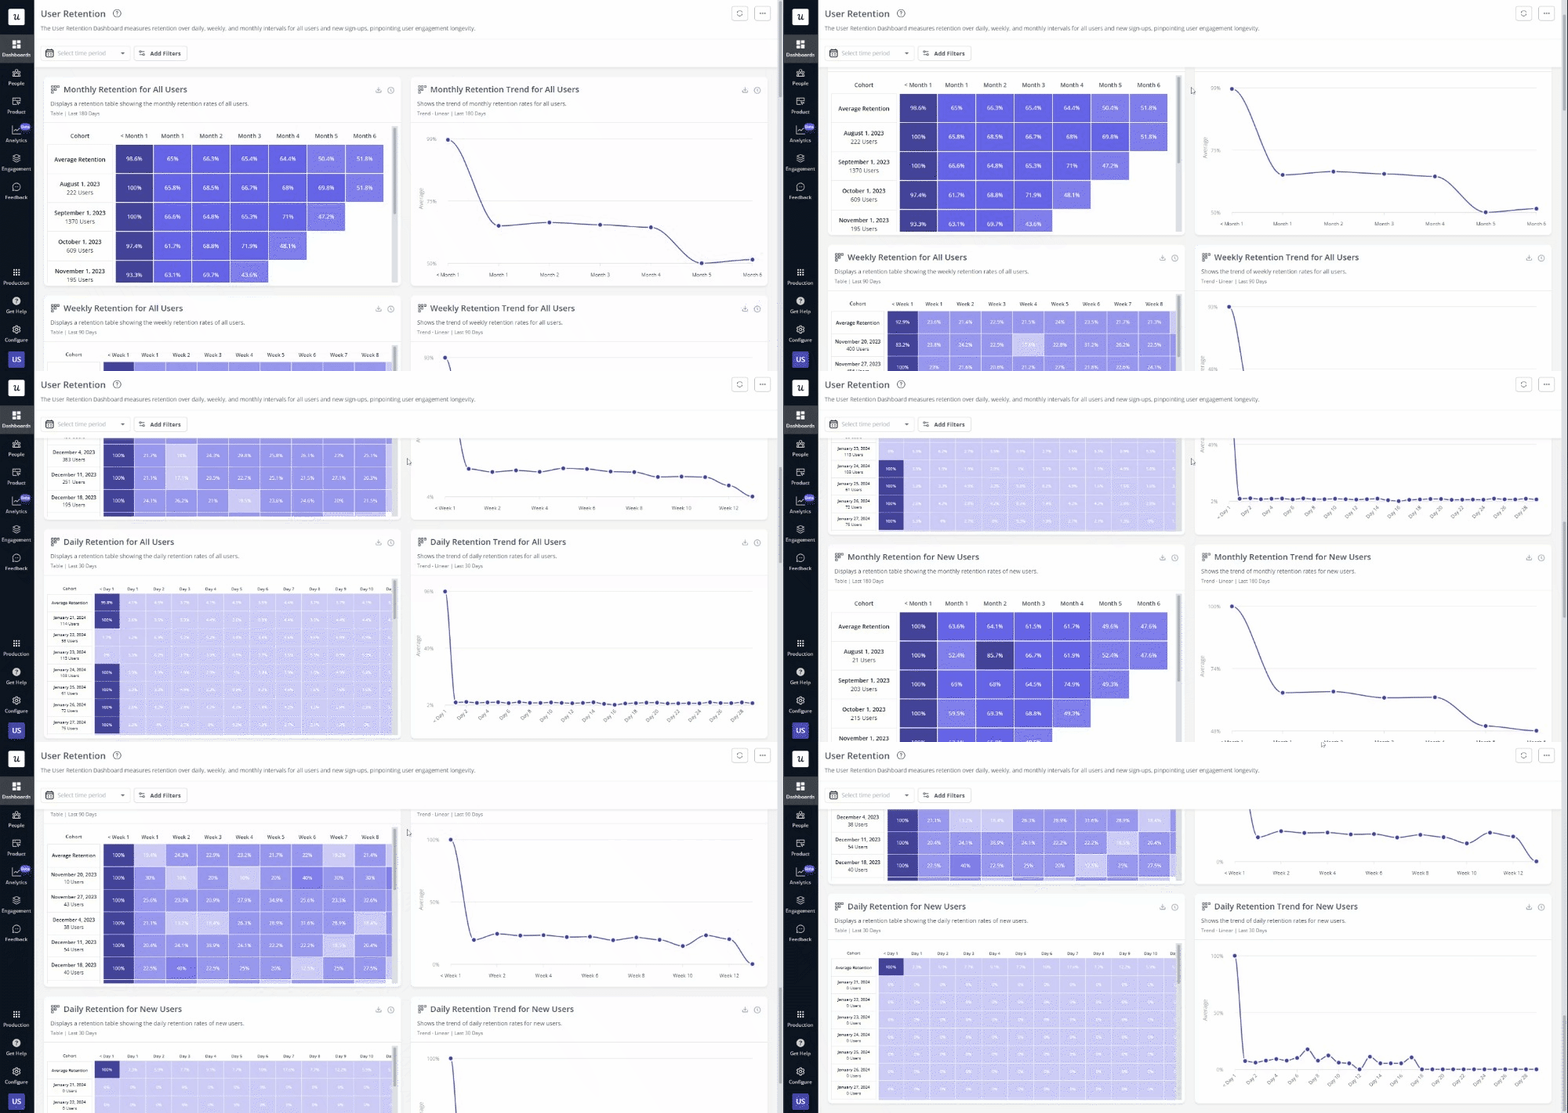
You can do it by creating custom dashboards for each product performance aspect you’re optimizing. For example, if your focus is on user activation and revenue expansion, you could have separate dashboards for tracking relevant metrics.
5 examples of customer behavioral analysis
Let’s now look at 5 companies and how they leveraged customer behavior analysis to improve their KPIs.
ClearCalcs improved activation using cohort analysis
ClearCalcs is a structural design and analysis software designed to streamline engineering calculations. Need to design beams, columns, or frames? ClearCalcs got you covered.
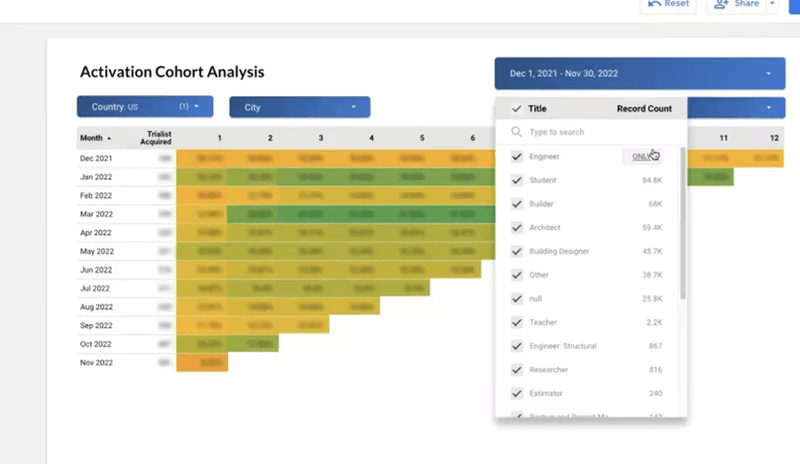
Cohort analysis helped ClearCalcs realize that some of their paying customers weren’t activating until a few months after they gained access to the product. That meant their companies weren’t getting the value they were paying for. Why would they renew their subs then?
ClearCals used Userpilot to create personalized onboarding flows that ultimately improved activation.
Pictory improved conversion rates by understanding customer behavior of different segments
Pictory is an AI-powered video editing tool. In 3 simple steps, it allows you to create a ready video from a script, with stock imagery, music, voiceovers, and all that jazz.
To drive growth, Pictory decided to focus all its efforts on the most valuable customers – those with the highest conversion rates and lifetime value.
How did they find their ideal customer?
They segmented their users by location, industry, job title, and professional and private activities and analyzed their behavior.
Netflix increased retention by offering personalized experiences
With just under 270M subscribers, Netflix is the largest streaming service in the world. This can be attributed to its incredible retention rate of 93%.
How do they achieve this?
By leveraging user behavior analytics and personalization.
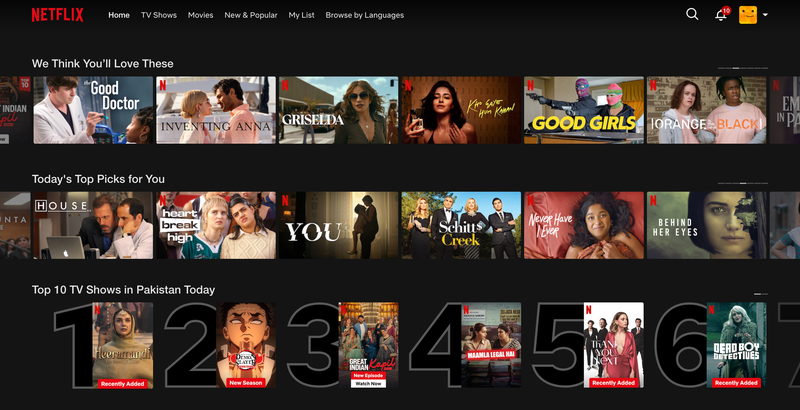
The company analyzes users’ viewing patterns – when they watch what and for how long.
They use the insights for personalized recommendations and trailers generated by AI and develop original content that appeals to customer tastes.
DocuSign improved upgrades through funnel analysis
DocuSign is a leading digital transaction management and e-signature platform.
The company offers a freemium plan to its users, but that’s, of course, not where their dosh comes from. To boost their freemium-to-paid conversion rates, they decided to give free users access to some premium features.
How did they know which features would drive upgrades?
They used funnel analytics to identify them.
The outcome? They improved conversions by 5%, which is a big deal considering they see 130k new users every day.
Amazon increased sales by analyzing habitual buying behavior
Amazon is the biggest e-commerce business around. But did you know that 35% of their sales come from recommendations?
Amazon analyzes your behavior on the site in great detail: what you view, add to the cart, or buy. That’s how they figure out what you may want or need and use the insights to create personalized recommendations.
How to use Userpilot for customer behavior analytics?
Userpilot is a product growth platform, not just an analytics tool. Don’t let this fool you, though, because it offers a ton of invaluable analytics features.
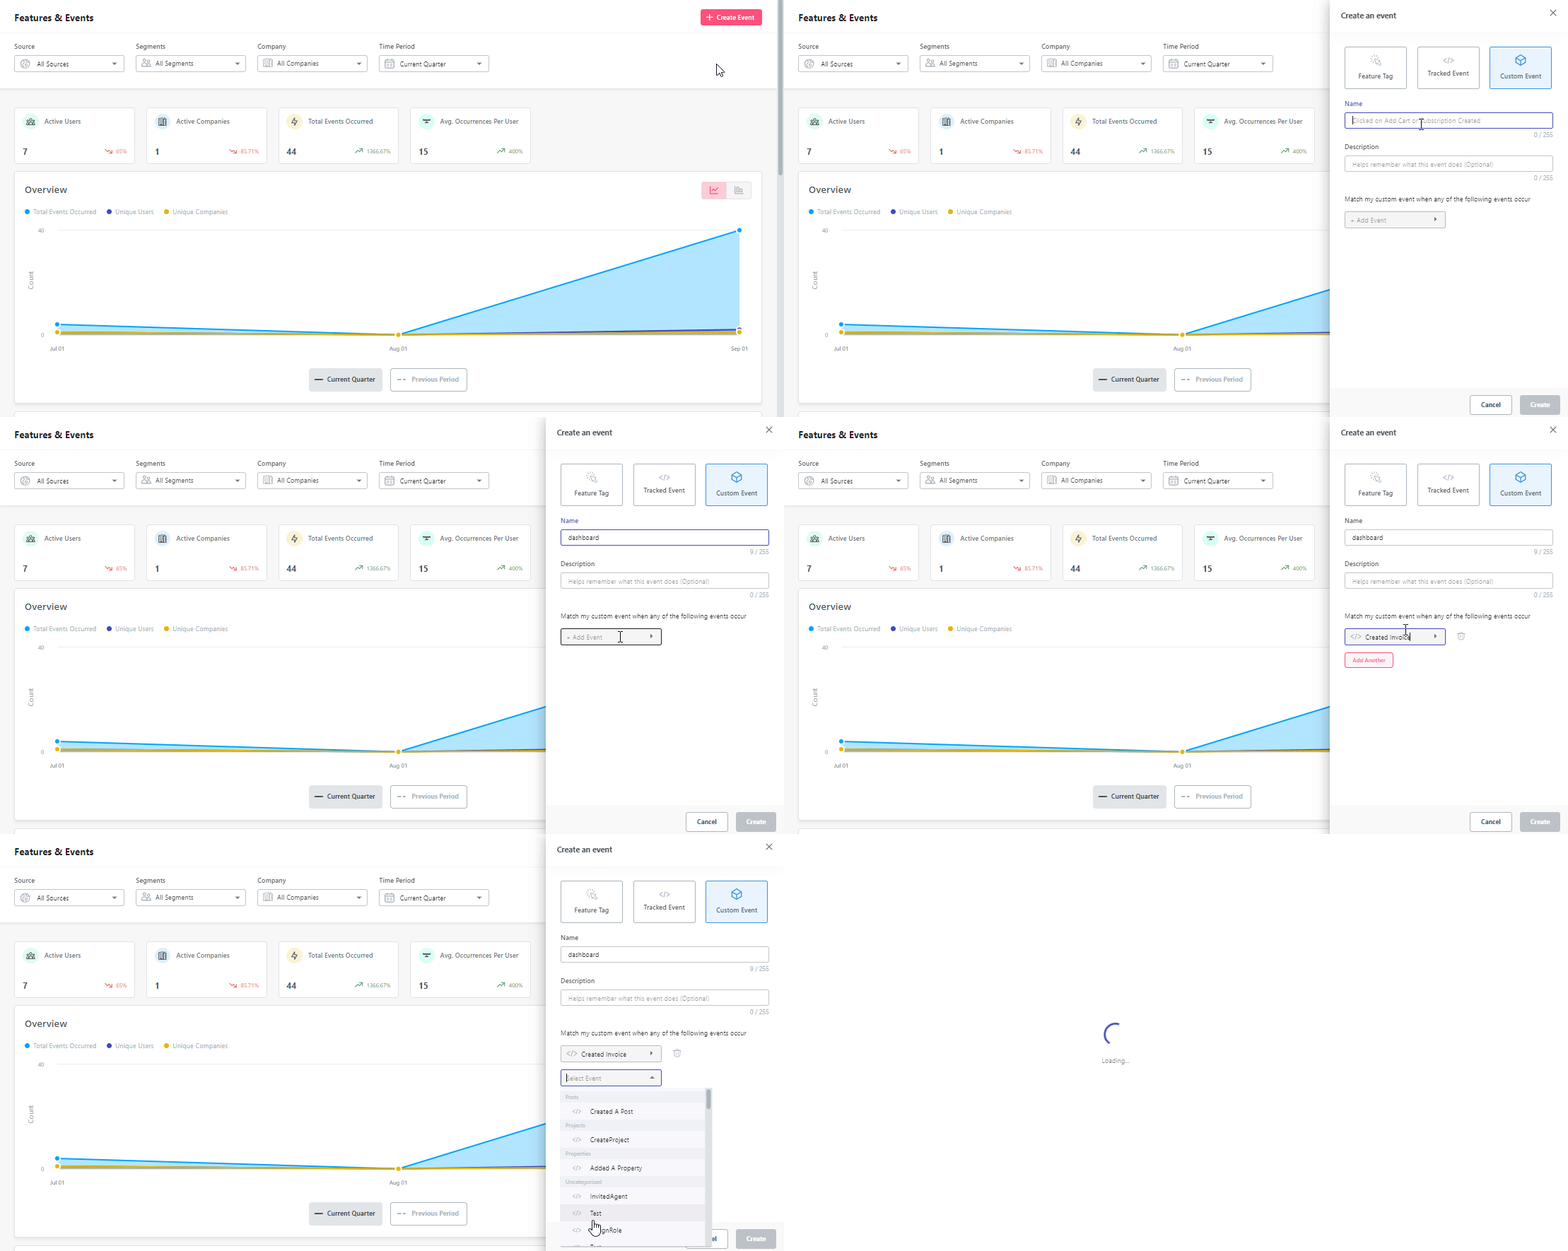
It allows you to track individual and custom events so you can monitor multiple actions as one. To track them, no coding is needed. Just tag them from the Chrome extension.
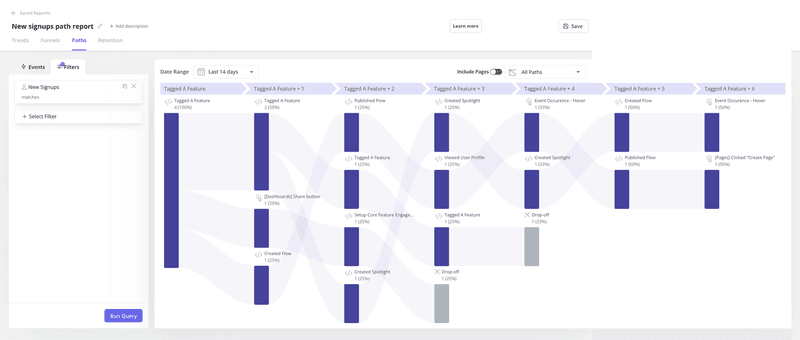
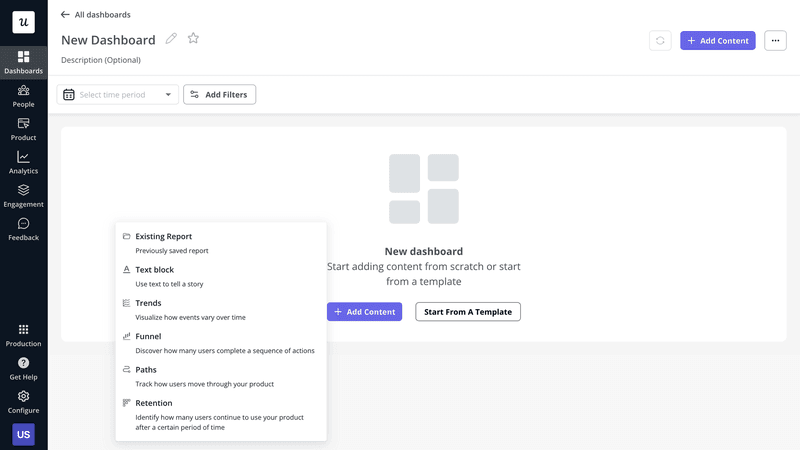
Once you have the data, you can analyze it in one of the reports (Trends, Funnels, Paths, Retention) to extract actionable insights.
You can access all the reports separately or add them to custom dashboards. That’s how you can monitor specific aspects of the product performance from one place. So that you never miss important insights.
And, of course, there are feedback features.
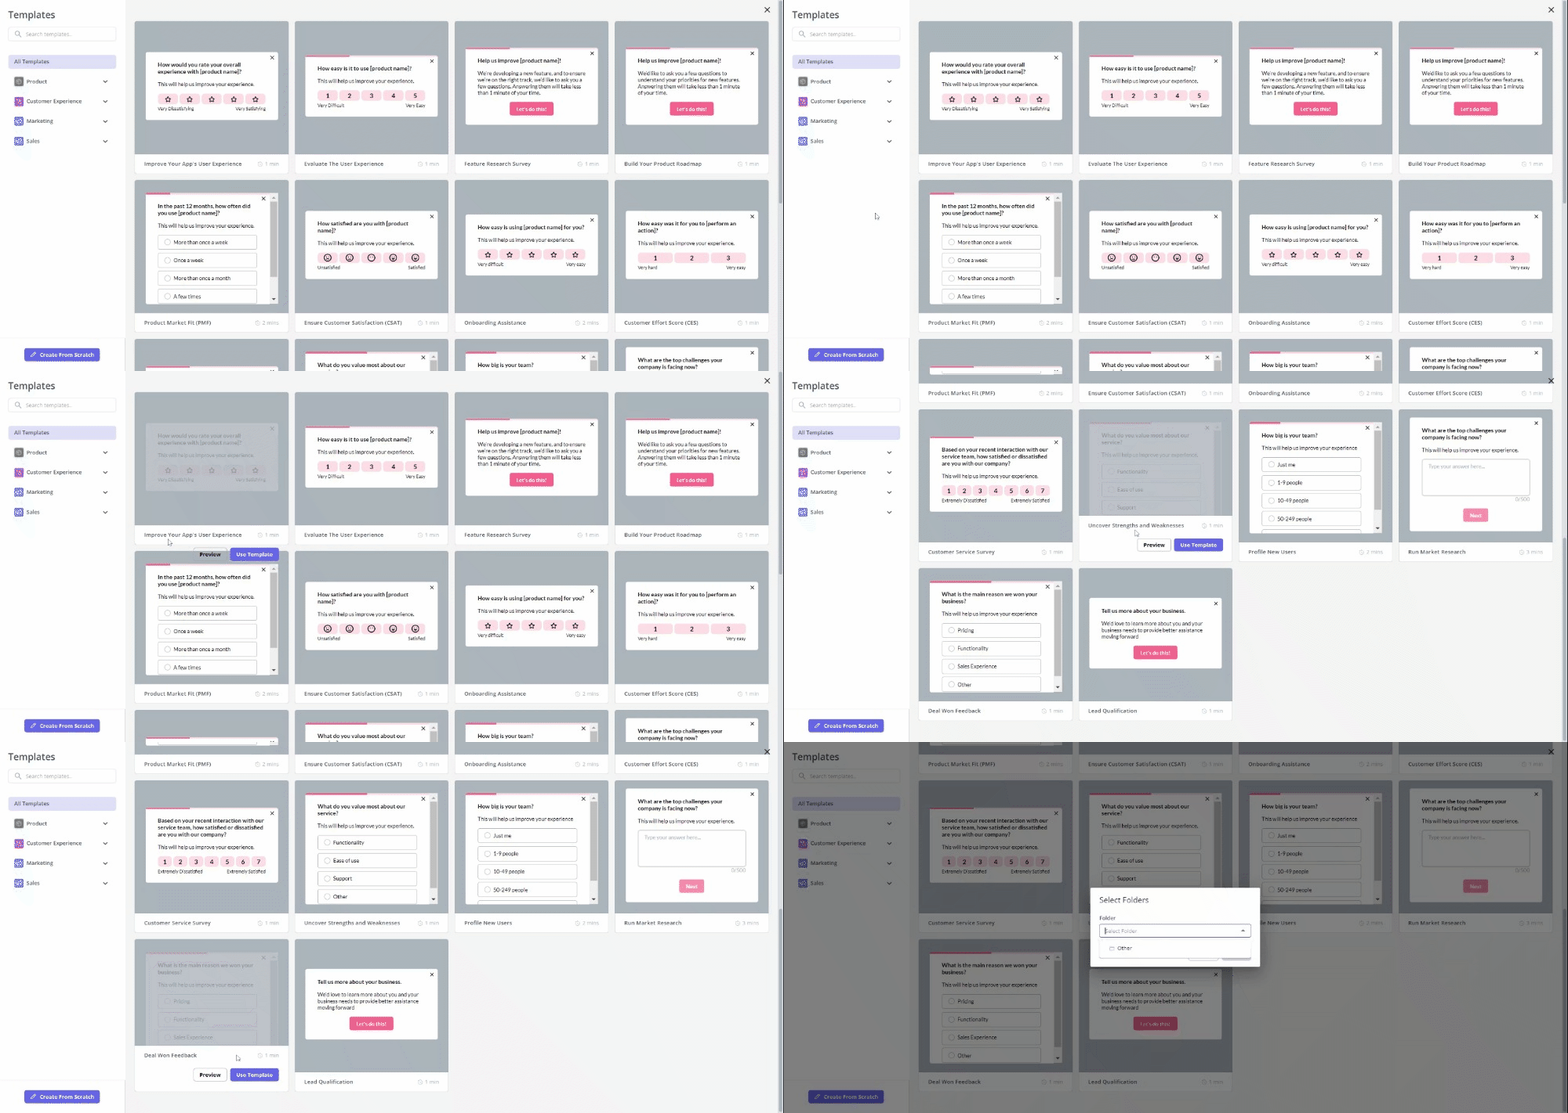
Userpilot makes creating in-app surveys easy thanks to its template library, visual editor, and localization feature. You can send them to specific user segments and trigger them at a specific time or in response to user actions.
Conclusion
User behavior analysis gives product teams the insights that they need to make informed decisions. Thanks to them, they can guide product development to enhance product value and offer personalized experiences enabling users to extract it.
To learn more about Userpilot analytics, book the demo!


