The right user behavior tool doesn’t just track data; it helps you build better products and drive more conversions.
Deciding on the best tool can be tricky, though. With countless platforms promising powerful features and deep data insights, it’s easy to get overwhelmed, or worse, invest in a tool that doesn’t deliver what you need.
That’s why I’ve done the heavy lifting for you, tested dozens of user analytics tools, analyzed hundreds of real user reviews, and evaluated seven shortlisted solutions against our key criteria.
But first, let’s make sure we are on the first page by defining what exactly these tools entail and what you can expect from them:
What are the different types of user analytics tools?
Generally speaking, analytics tools are software that allow you to collect, analyze, and report on user interaction data. But all analytics tools aren’t created the same; each of them collects different types of insights and serves a specific purpose. Here are the most common types of analytics tools:
-
Traditional analytics tools: Track overall web performance with metrics like traffic sources, bounce rates, page views, and session duration.
-
Product analytics tools: Analyze how users interact with features inside web or mobile apps. Provide quantitative insights through features like funnel visualisations, retention cohorts, or path analysis.
-
UX analytics tools: These focus on visualizing user behavior through heatmaps, scroll maps, and session replays, helping you identify friction points.
-
Feedback and VoC analytics tools: Capture direct user input using surveys, feedback widgets, and interviews.
-
A/B testing tools: Experiment with different versions of content to determine what drives better engagement or conversions.
I included the best tool from each category in our review, so you can find a solution that works for your specific use case!
Best user analytics tools at a glance
Don’t want to read through walls of text? Here’s a summary table:
|
Tool |
Best For |
G2 Rating |
Standout Features |
Starting Price |
|---|---|---|---|---|
|
Userpilot |
All-in-one customer analytics. |
Auto-capture |
$299/month |
|
|
Full-stack product experience management and analytics. |
Product analytics |
Custom pricing (~$20K+/year estimates) |
||
|
Deep quantitative analysis of user behavior. |
Marketing analytics |
Paid plans from about $24/month (usage-based) |
||
|
Google Analytics |
Web analytics and website performance tracking. |
Data analytics |
Google Analytics 360 custom (~$50K+/year estimates) |
|
|
Fullstory |
Gaining contextual understanding of individual user experiences. |
Session replay |
Custom pricing (estimates ~$10K+/year) |
|
|
Hotjar |
Visualizing user behavior and collecting qualitative feedback. |
Maps (Scroll, Click, Heat, etc.) |
Paid plans start from about $39/month |
|
|
Optimizely |
Optimizing digital experiences through rigorous testing. |
Feature flags |
Enterprise plans often start around $36K/year |
How I chose the best user analytics platforms
Based on product teams I talked to, and from my own experience, here are eight qualifying questions you should answer when choosing a tool:
-
Core features: Does it offer the needed capabilities for your business, be it automated event tracking, custom dashboards, visualization reports, or A/B testing?
-
Integrations: Can it connect with your existing tools and tech stack (CRM, data warehouse, SDKs)?
-
Data and privacy: Is it compliant with GDPR/CCPA? Who owns the data, and can you export it?
-
Pricing: Is the pricing model transparent, and does it match the value it provides?
-
Ease of use: Is it user-friendly for non-technical team members?
-
Scalability: Can it handle your current and future data volume?
-
Collaboration: Does it support multiple users, roles, and shared dashboards?
-
Support: Is there reliable documentation, responsive support, or an active community?
A deep dive into the top 7 user analytics tools
Let’s now have a closer look at the tools listed above and discuss each tool’s standout features, pricing, and pros and cons.
To keep the comparison fair, I limited this list to mature analytics solutions with strong market adoption and consistently positive user sentiment. Each platform represents a leading product in its category. I also included real user reviews to highlight both strengths and limitations based on real-world usage.
1. Userpilot
Who should choose Userpilot: Product-led SaaS teams that want to analyze user behavior and act on insights with built-in in-app engagement tools.
G2 rating: 4.6/5⭐
Userpilot provides a 360-degree view of user behavior by combining qualitative and quantitative data into one platform. Instead of relying on multiple web analytics tools, product teams can analyze product usage, collect feedback, and deploy in-app experiences from the same workspace.
From event tracking and analytics dashboards to surveys and session replays, the platform helps teams understand how users interact with their product and identify friction points that affect activation or retention.
Because analytics and engagement features live in the same system, teams can quickly turn insights into product improvements without switching between tools.
Userpilot key features
-
Autocapture: Userpilot automatically records user interactions, including clicks, text input changes, and form submissions. This eliminates the need to manually configure every tracking code before collecting usage data.
-
Analytics dashboards: Take advantage of analytics dashboards to view all your key performance metrics in one place. You can use a pre-made dashboard or create one from scratch to fit your needs.
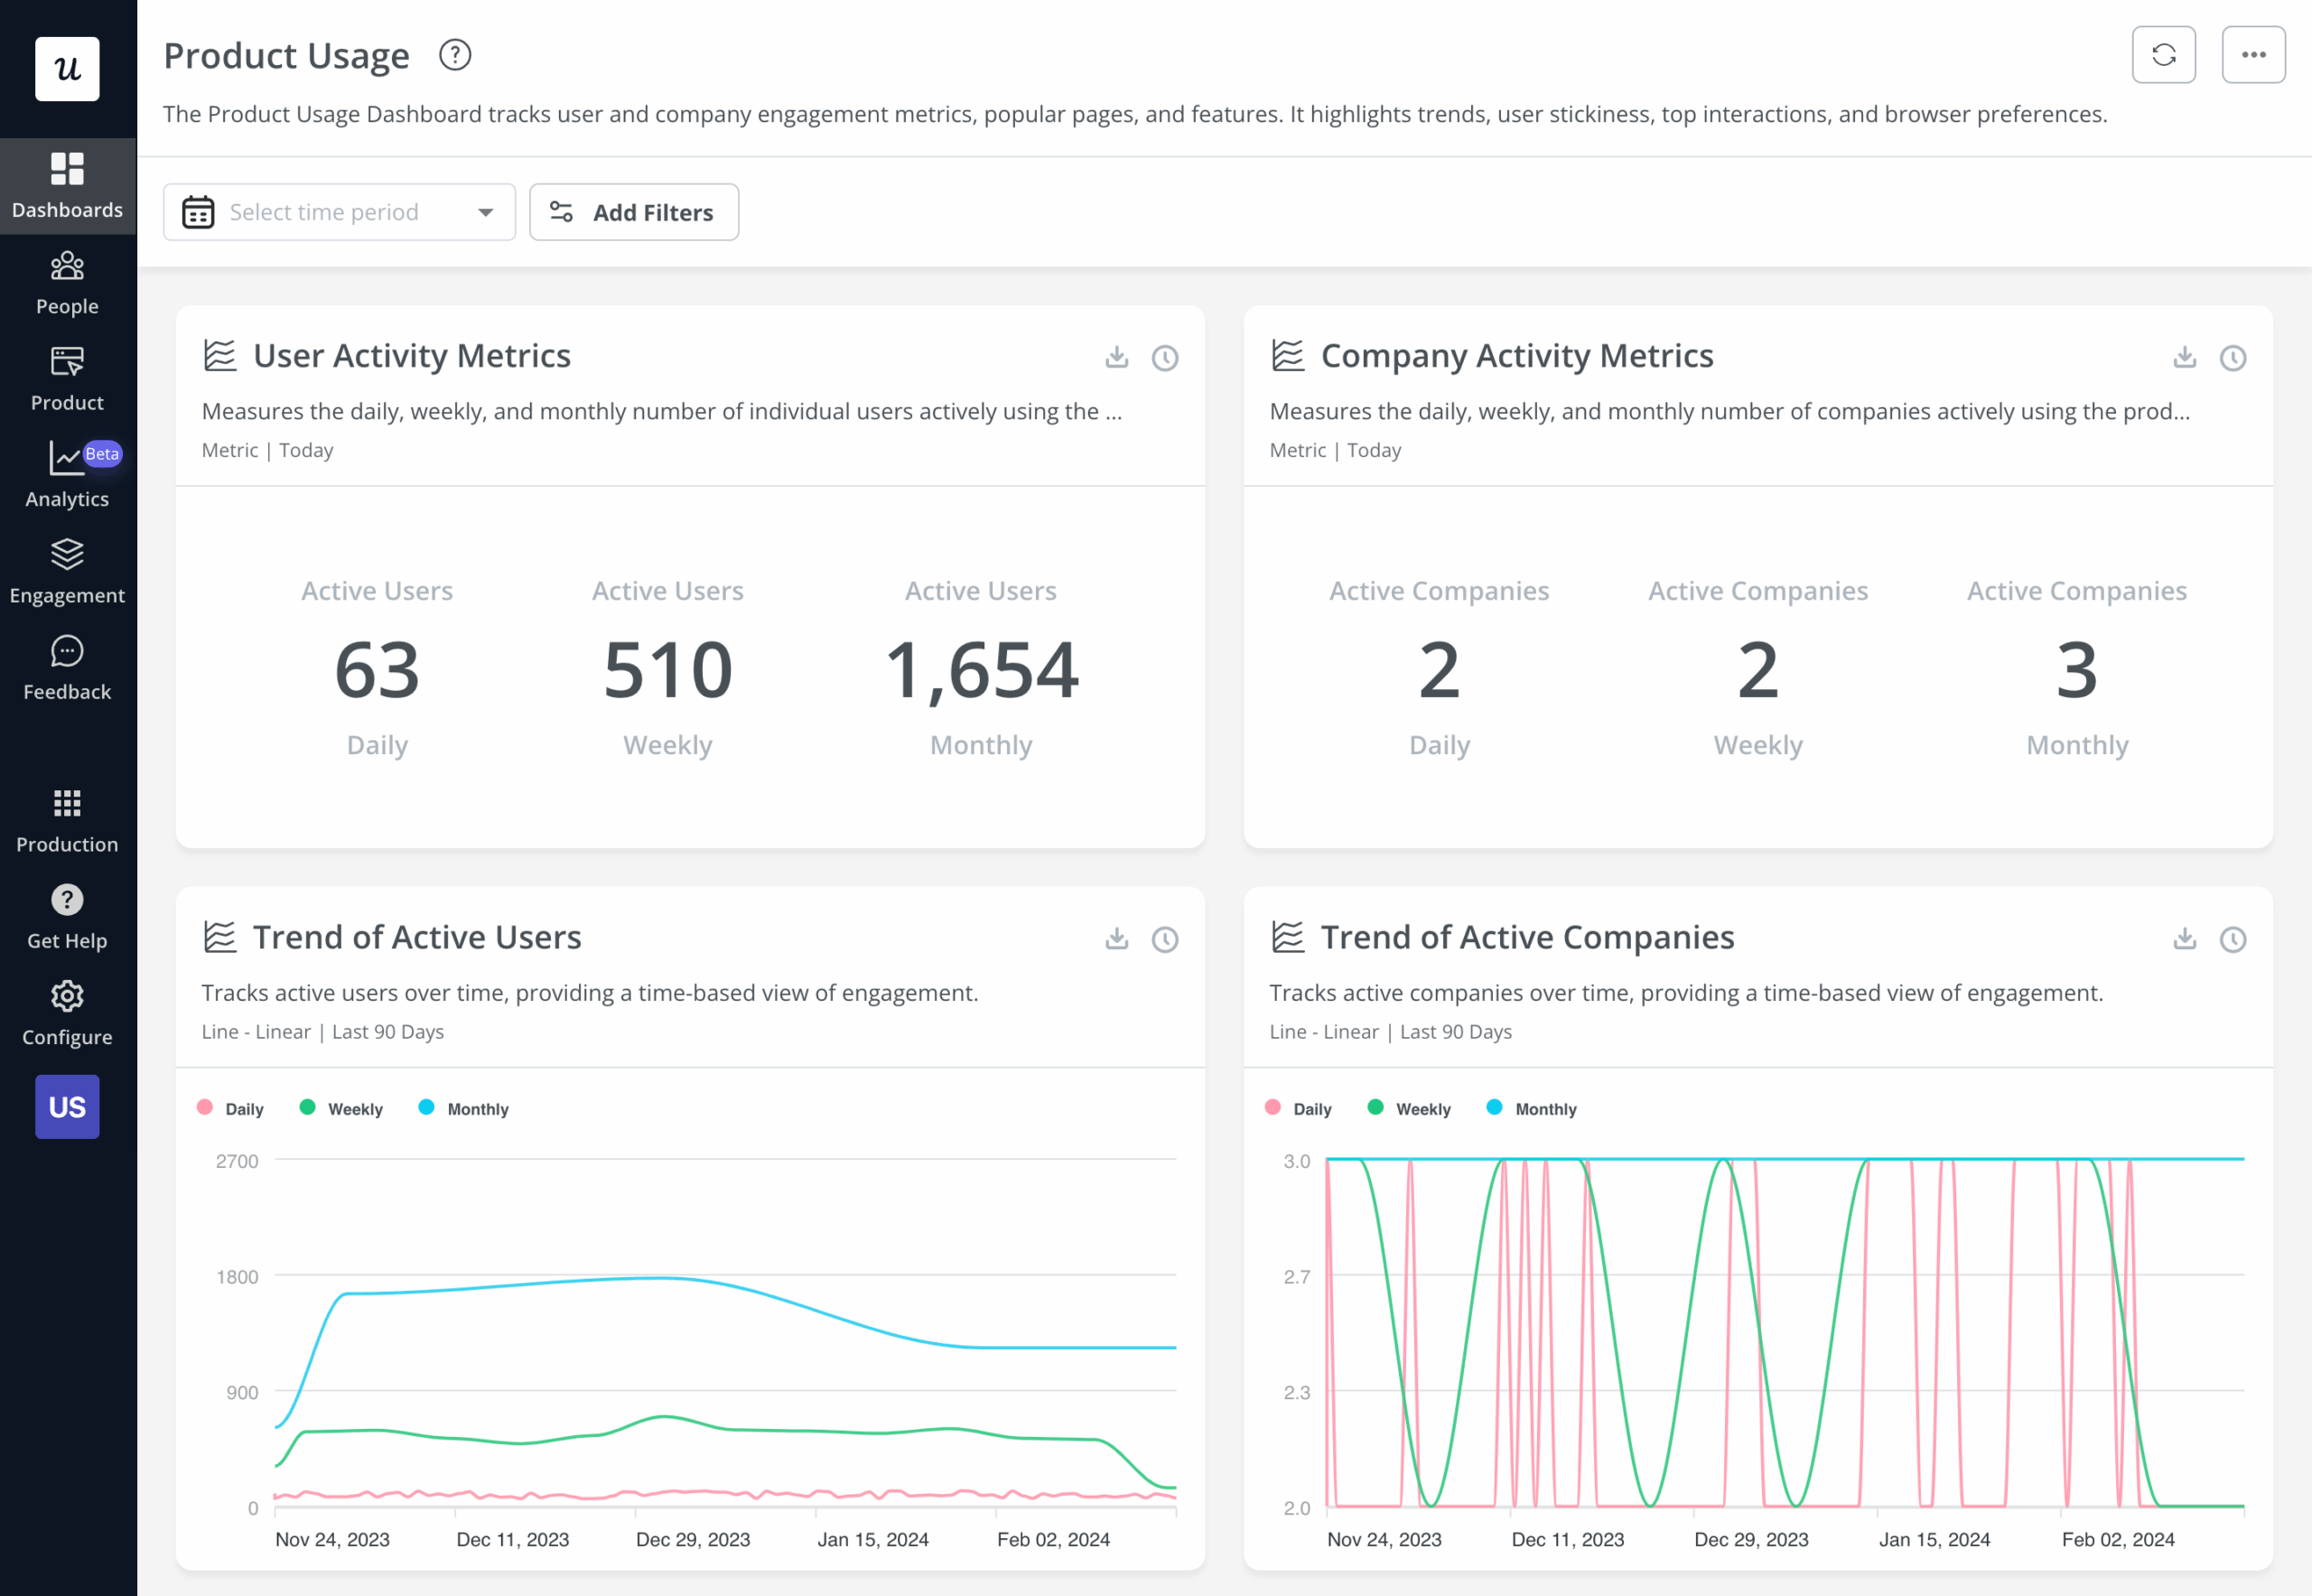
Product usage analytics dashboard in Userpilot.
-
Funnel Analysis: Analyze user progression through key workflows, identify drop-off points, and optimize onboarding or conversion paths for improved retention.
-
Paths: Userpilot maps out user navigation patterns within the product, revealing unexpected behaviors, bottlenecks, and areas where users struggle so teams can optimize the experience.
-
Cohort Analysis: Group users based on shared behaviors or time-based actions, so you can compare engagement, retention, and the long-term impact of product updates.
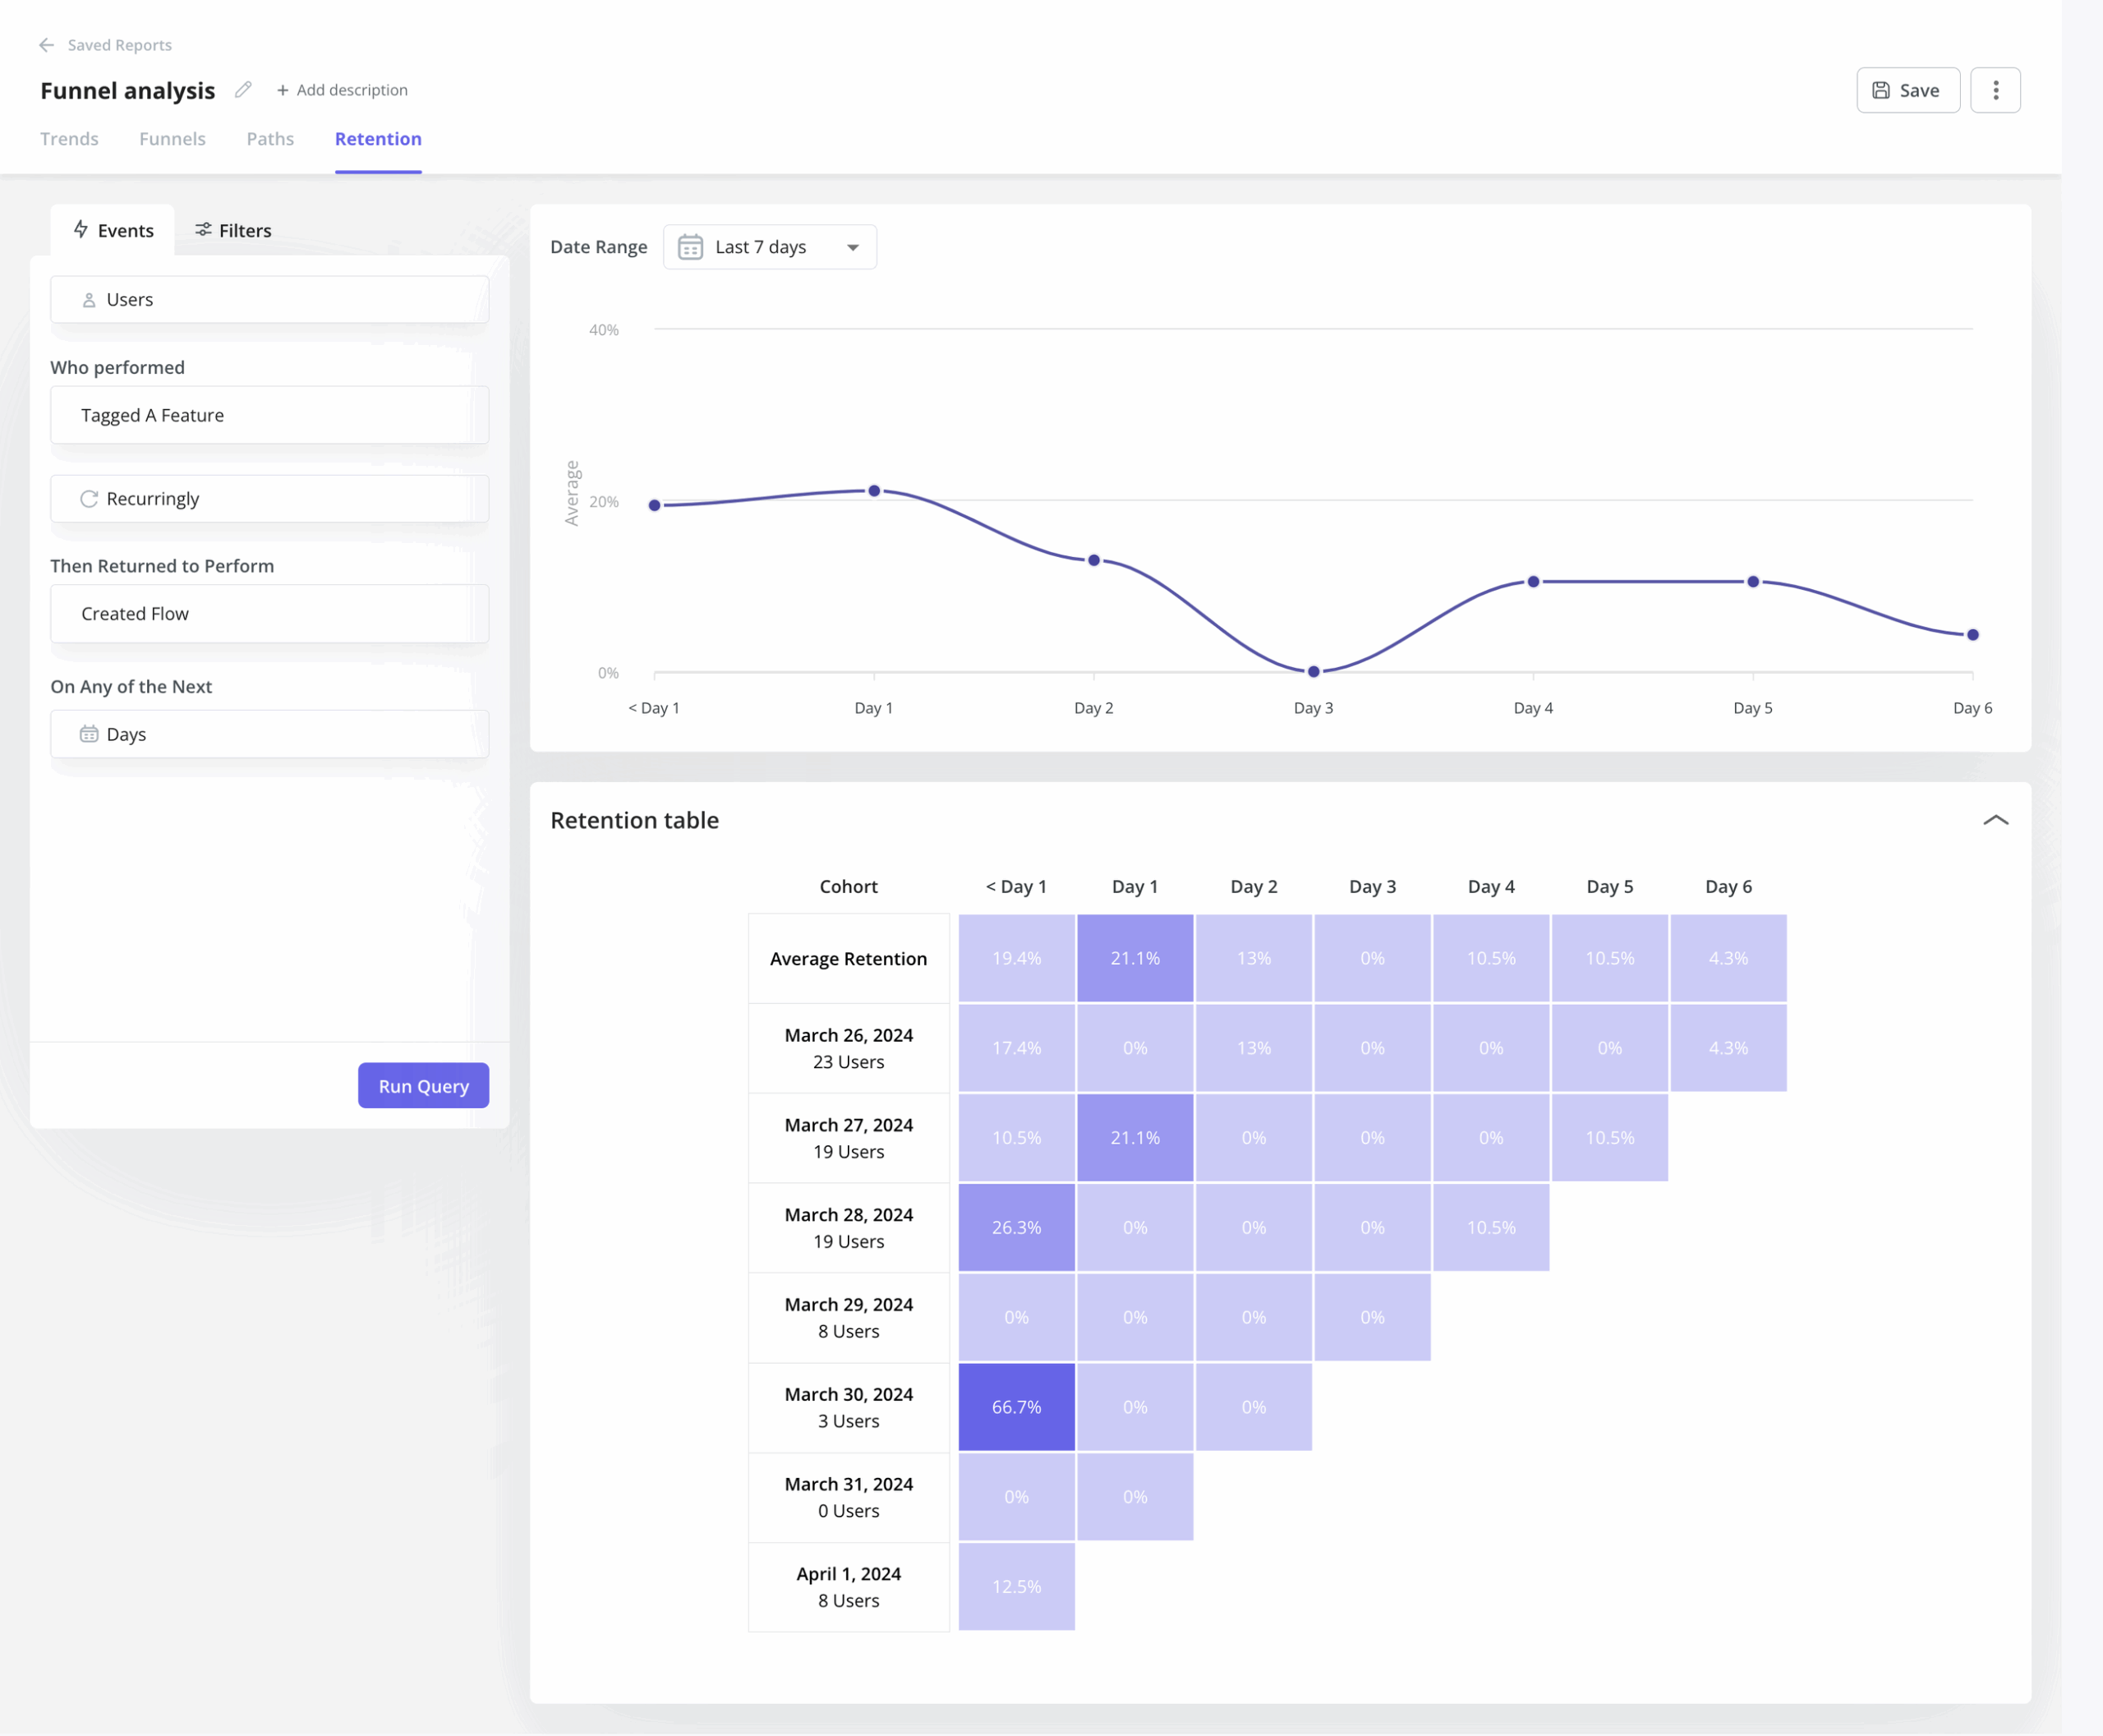
Funnel analysis report with cohort view in Userpilot.
-
Session replay: View user activity during sessions, including their clicks, scrolls, page views, and more, to help you better understand the user experience and identify areas of difficulty.
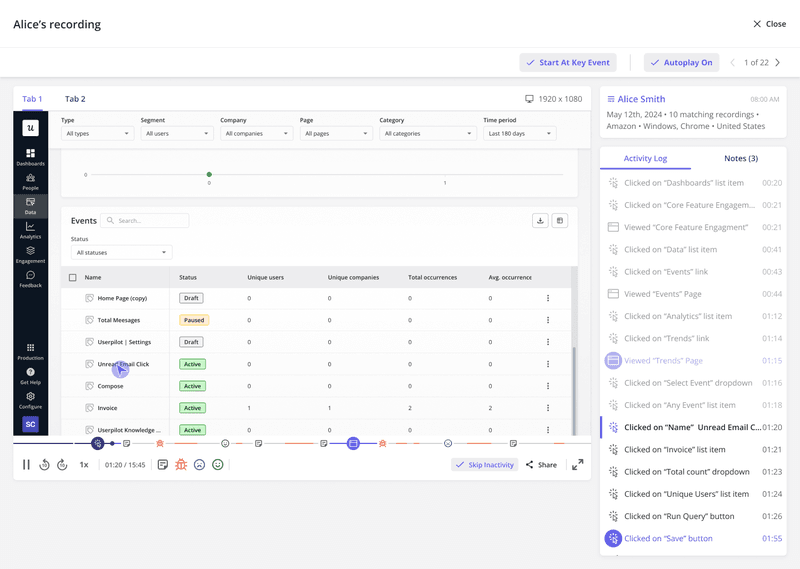
Session replays in Userpilot.
-
In-app surveys: Collect qualitative feedback directly inside the product. Survey responses are linked to behavioral analytics so teams can connect user sentiment with product usage data.
Userpilot pros and cons
✅ Intuitive and easy to use: Non-technical team members can easily track events, analyze data, and build in-app experiences without relying on developers or writing a single line of code.
✅ Unified platform: Userpilot replaces the need for multiple tools, breaking data siloes and reducing your stack complexity.
✅ Actionable analytics: You can go beyond tracking user behavior and act on collected insights right away with in-app engagement features such as tooltips, modals, and product tours.
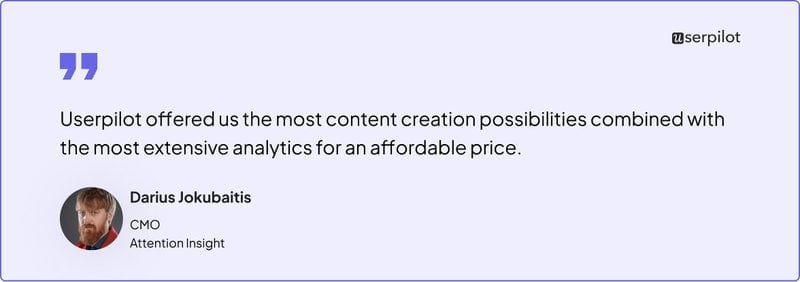
For example, by combining Userpilot’s analytics and engagement layers, Attention Insight, an AI-powered heatmap analytics tool, improved user activation metrics by 47%:
❌ No free version: Although Userpilot offers a limited free trial, there is no free version of the product.
❌ High pricing for small businesses: Unfortunately, if you are a startup with a limited budget, Userpilot might not fit your budget. I know that our products are mostly used by mid-sized businesses and enterprises that have the budget for dedicated tools.
Userpilot pricing
Userpilot offers three pricing tiers:
-
Starter: Features up to 2,000 monthly active users with in-app user engagement, usage trend analysis, NPS surveys, etc. Userpilot’s Starter plan is only offered as part of an annual subscription, priced at $299 per month.
-
Growth (Most popular!): Includes expanded product analytics features, retroactive event auto-capture, in-app surveys, session replay, etc. Pricing for this plan depends on your specific needs.
-
Enterprise: Features bulk data export and import, custom roles and permissions, SOC 2 Type 2 security audit & compliance, etc. Pricing for this plan depends on your specific needs.
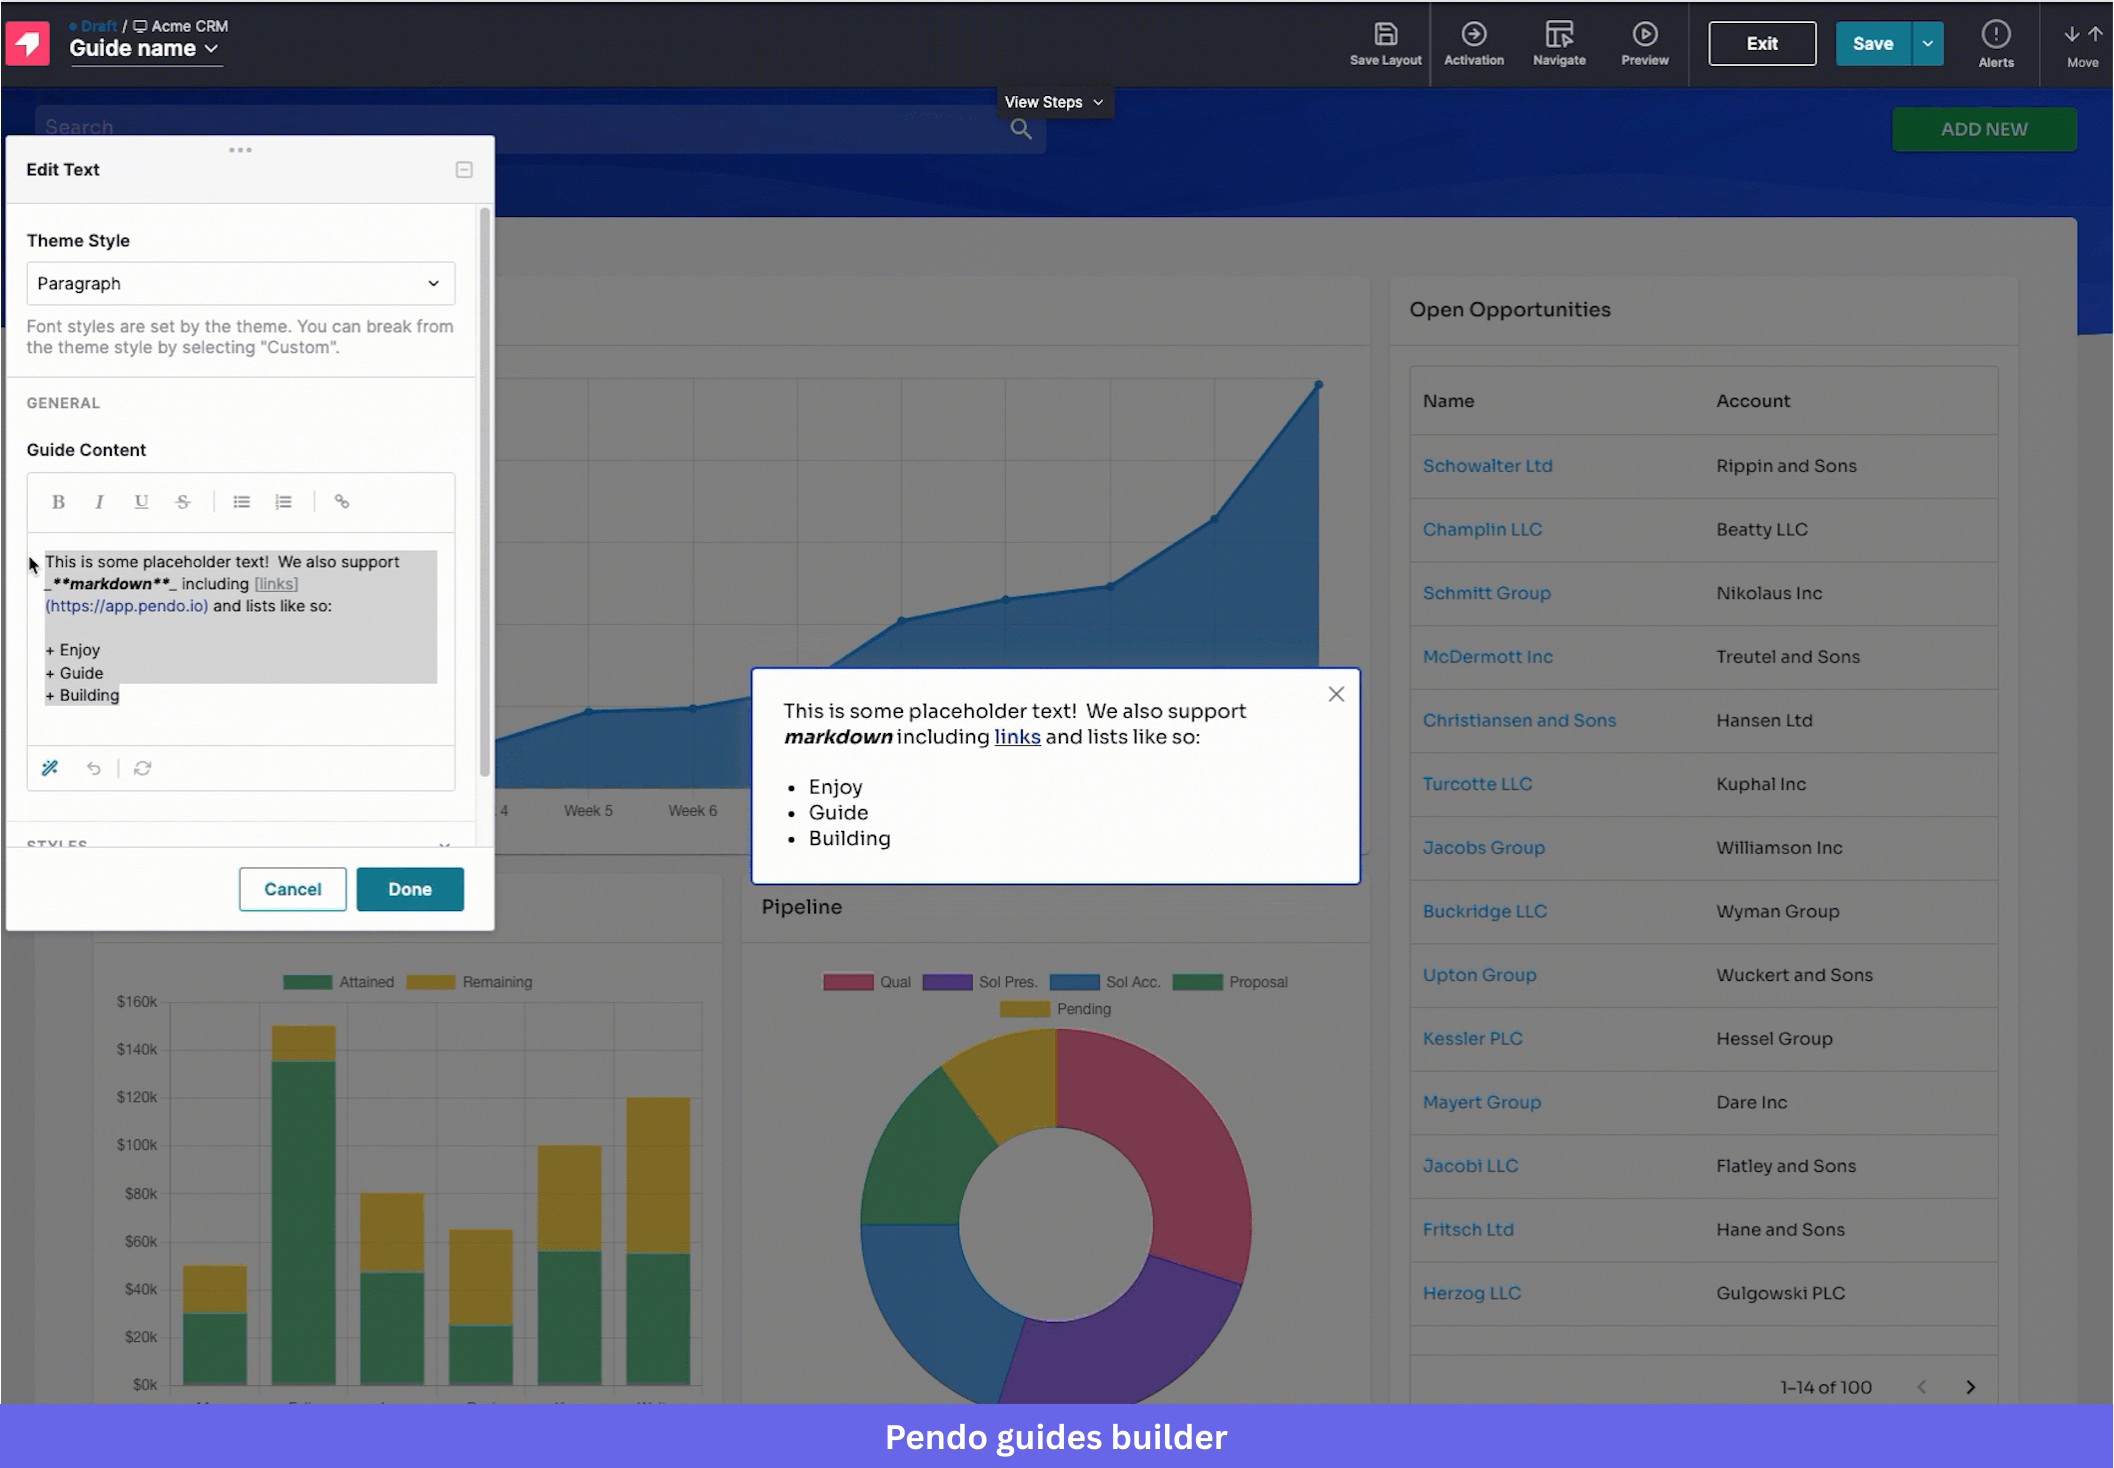
2. Pendo
Who can choose Pendo: Enterprise and mid-market product teams that want a product experience platform combining product analytics, in-app guidance, and feedback management.
G2 rating: 4.4/5⭐
Pendo is another comprehensive product experience platform. It integrates product/web analytics with in-app guidance, user feedback, and product roadmapping features.
Often considered a great all-in-one platform for enterprise users, Pendo combines analytics with engagement capabilities that help product teams understand how users interact with their applications and improve product adoption.
Pendo key features
-
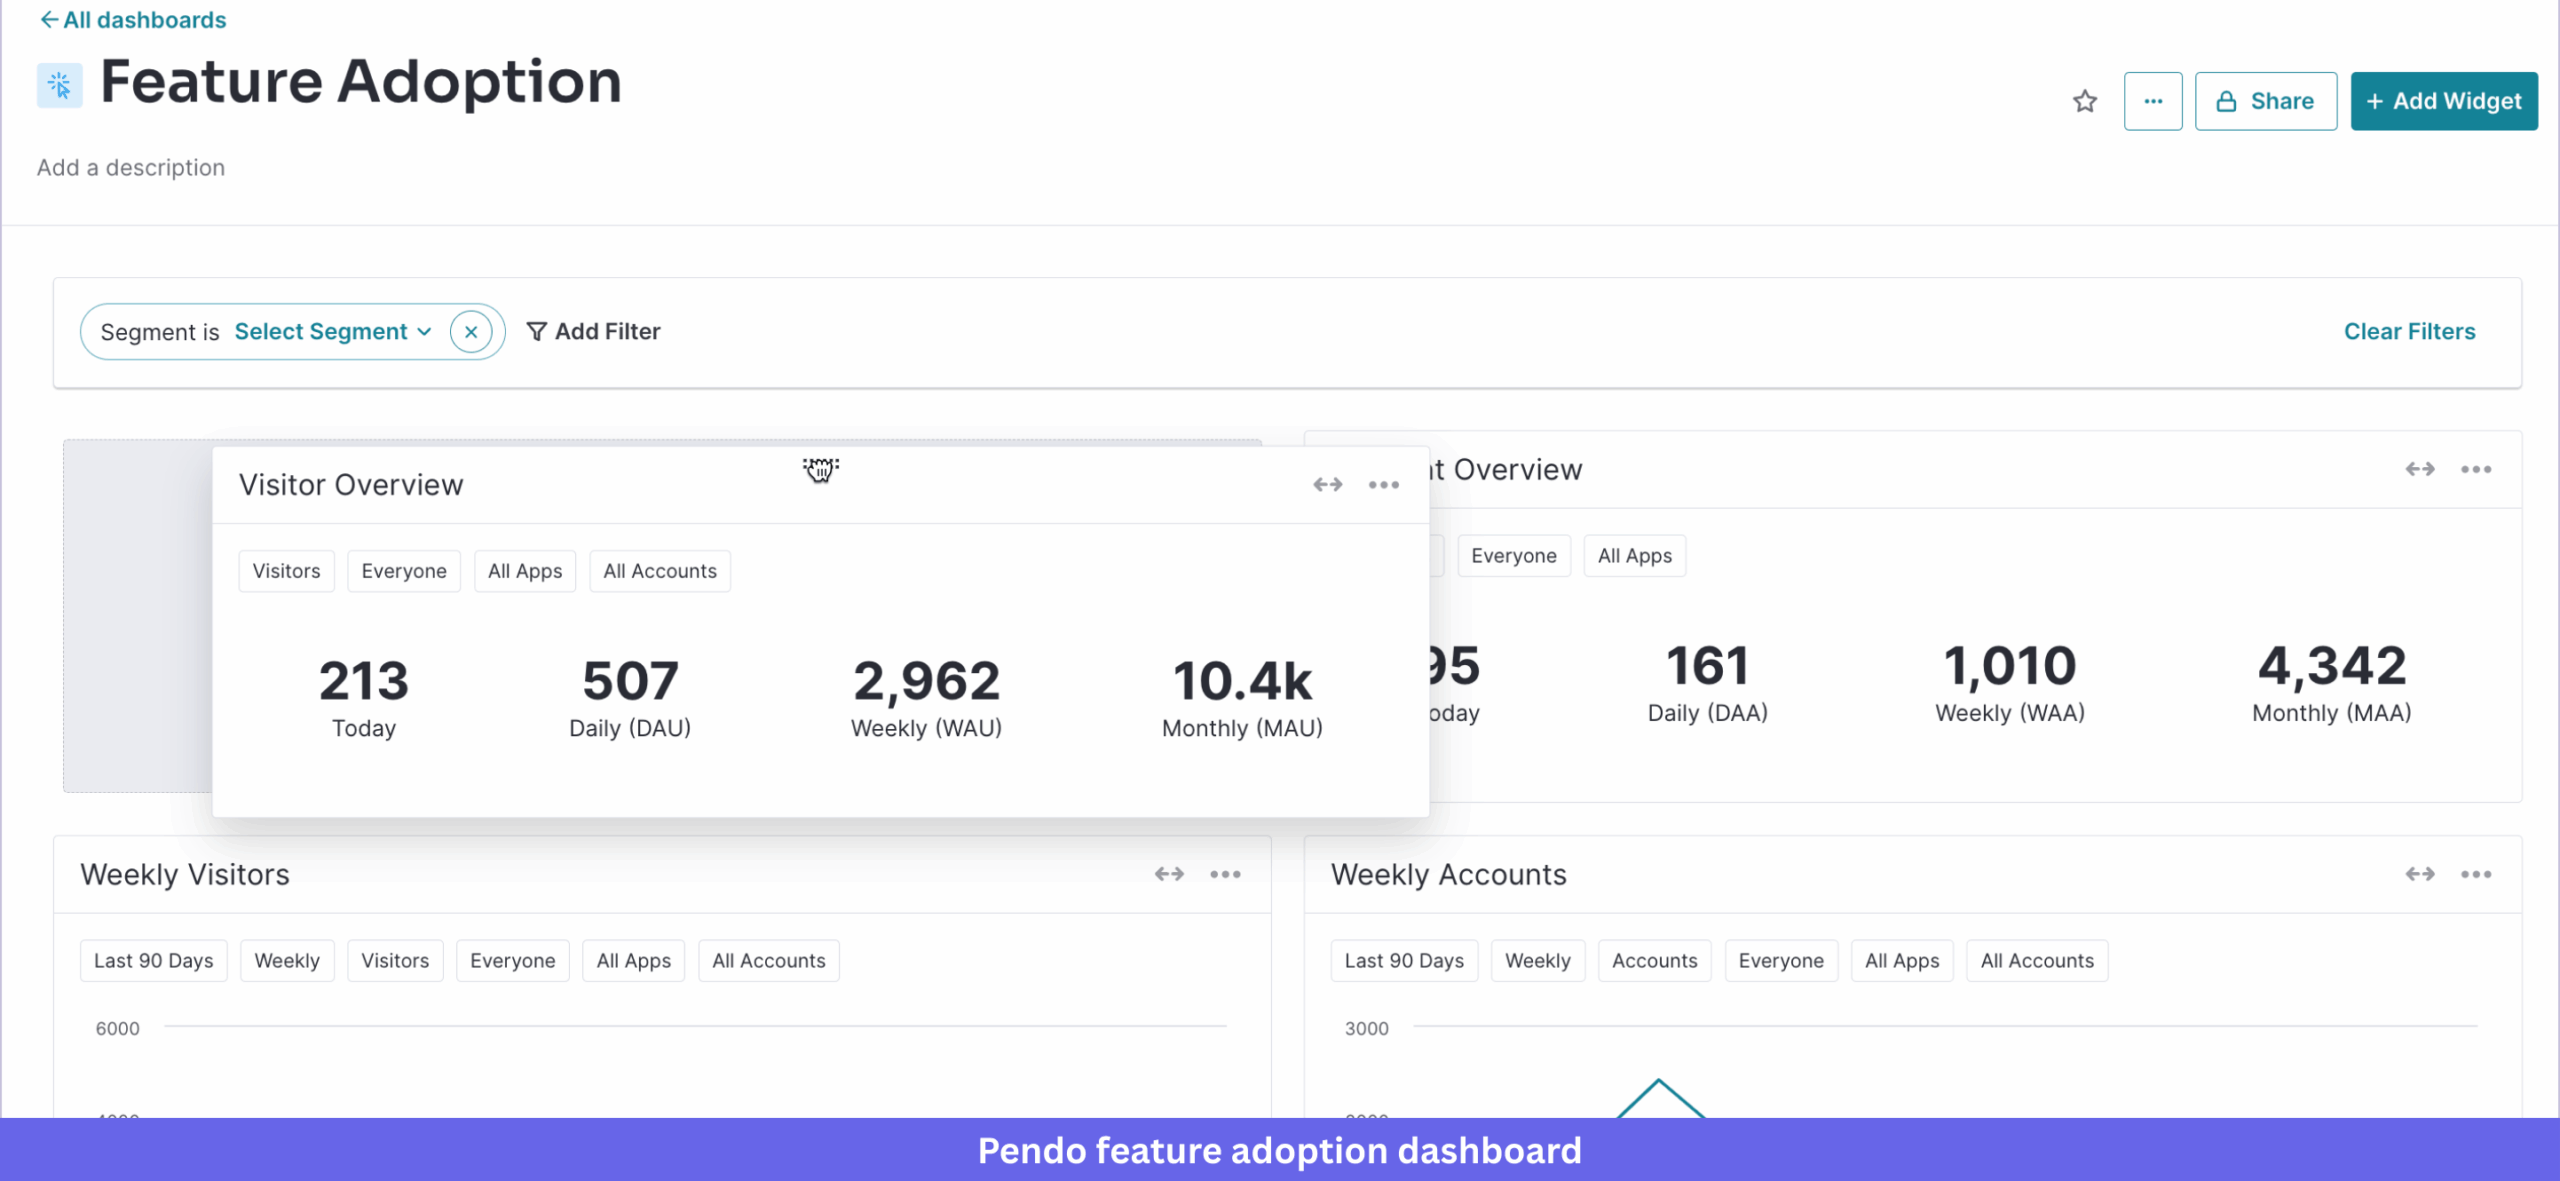
Product analytics: Tracks user behavior using tagged features and auto-capture. It includes paths/funnel analysis, retention reports generation, and session replay.
-
Integrated feedback & roadmapping: Pendo’s feedback layer is integrated with its roadmapping feature to enable users to centralize product planning inputs.
-
In-app guidance: Act on the insights gleaned by building guides, polls, and announcements within your application. You can also create cross-app guides for employees’ onboarding on third-party tools.
-
Pendo AI: Pendo offers a range of AI-powered features. This includes qualitative AI analysis from sources like NPS comments and surveys, an AI writing assistant for in-app guides, and AI-powered guide localization.
Pendo pricing
Pendo has four main pricing categories:
-
Free: Supports up to 500 monthly active users (MAUs) and includes basic product analytics, feature tagging, in-app guides with Pendo branding, NPS surveys, and dashboards.
-
Base: Entry-level paid plan that expands analytics capabilities, removes Pendo branding from guides, and adds more advanced segmentation and reporting features. Pricing depends on MAU limits and selected features.
-
Core: Adds more advanced analytics capabilities, integrations, and reporting features designed for larger product teams.
-
Pulse / Enterprise: Higher-tier plans designed for larger organizations that require advanced analytics features, expanded feedback management tools, and enterprise support.
Pendo does not publicly disclose pricing for most paid tiers, and companies must contact sales for a custom quote. Industry estimates suggest contracts can range between $20,000 and $50,000 annually, depending on usage and features.
Pendo pros and cons
✅ Powerful AI features: Pendo has introduced several AI-powered capabilities, including AI analysis of qualitative feedback (like NPS comments and survey responses), an AI writing assistant for guides, and automated guide localization. However, some users, like Brittany N., note that the rapid addition of AI features could lead to “feature bloat and a declining user experience.”
✅ All-in-one stack: The combination of engagement, feedback, and analytics tools into a single product can reduce tool stack complexity.
✅ No-code feature tagging: Pendo allows teams to tag UI elements directly in the product interface without engineering support. This makes it easier for product managers to track feature usage and analyze product adoption.
❌ Expensive & opaque pricing: Pendo’s pricing is custom and, according to Vendr, it’s significantly higher than competitors like Userpilot.
❌ Setup complexity: Despite being a codeless tool, Pendo can be complex to set up and master, especially for non-technical users. As Aditi K. notes, “it is a complex tool to onboard to,” with their non-technical team often requiring help from the more technical Tools/Ops team, who themselves also needed help from Pendo support.

❌ Limited functionality in the free plan: While Pendo offers a free plan for up to 500 MAUs, several advanced capabilities, such as expanded analytics, integrations, and advanced customization, are restricted to paid tiers.
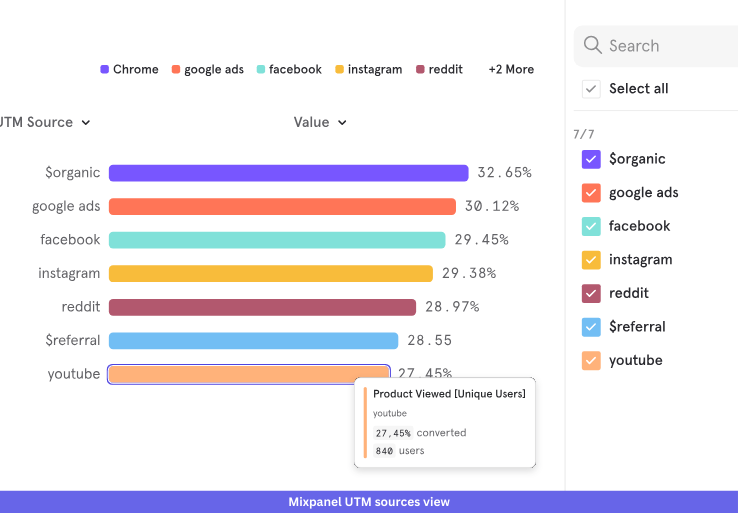
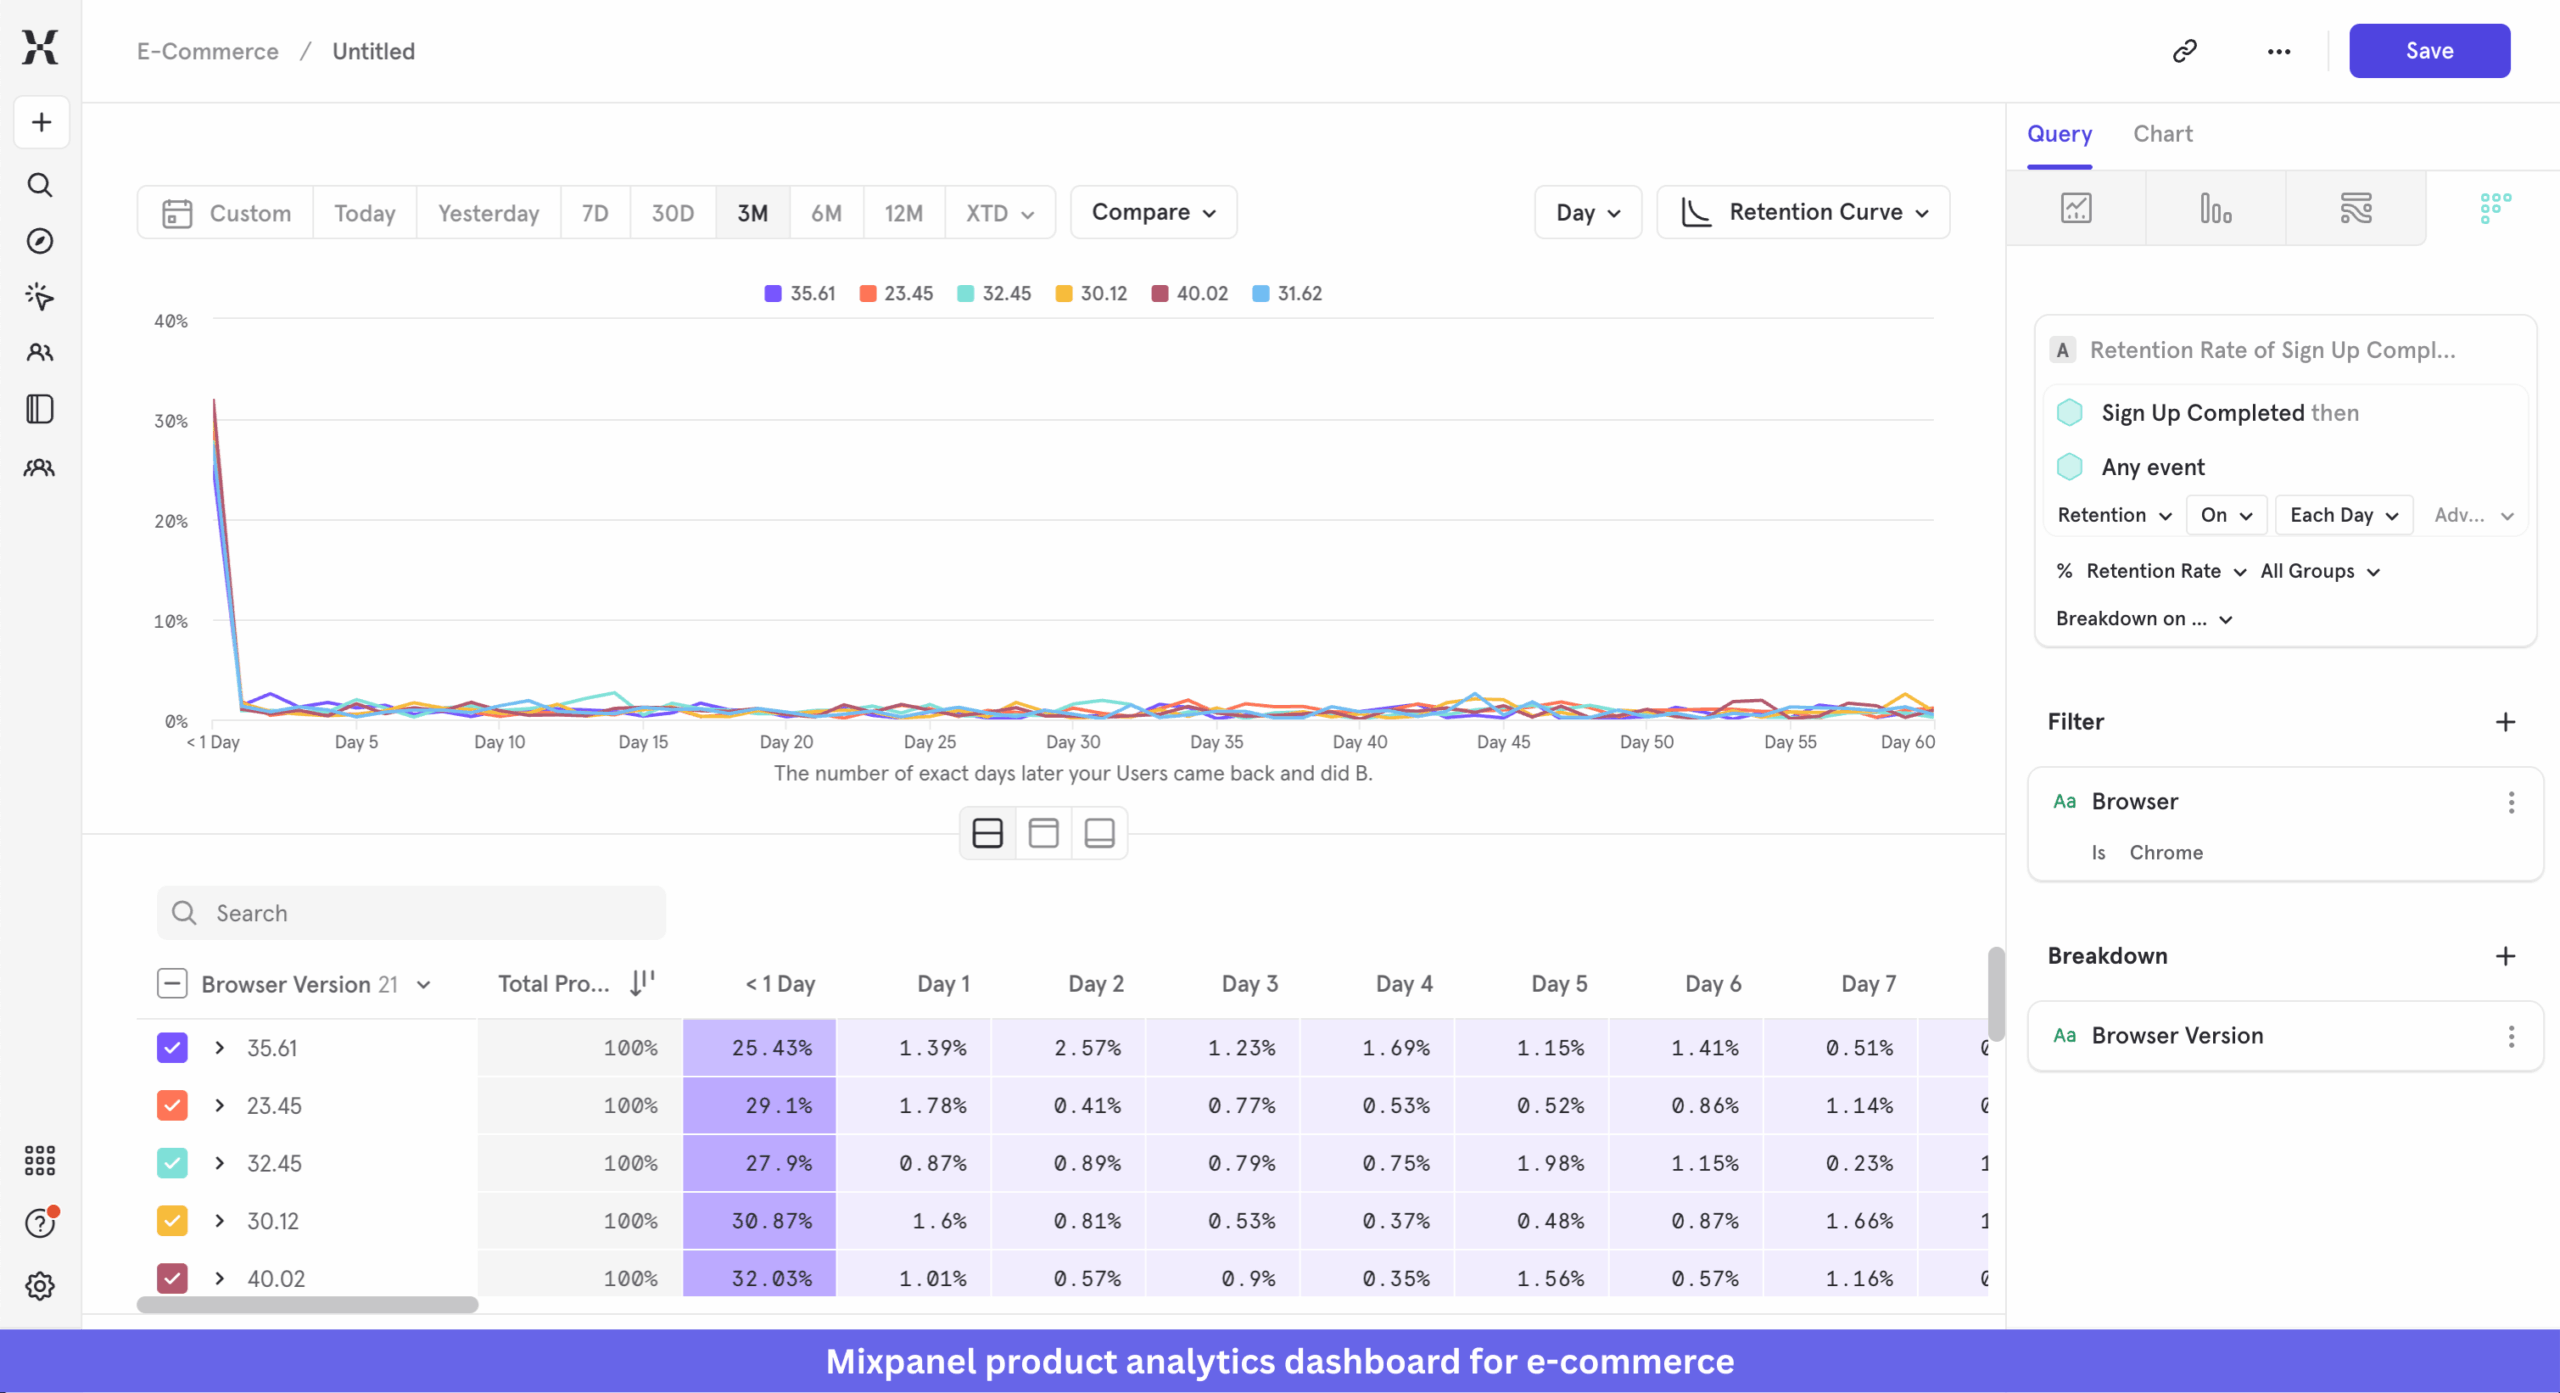
3. Mixpanel
Best for: Product and growth teams that want deep quantitative analysis of user behavior through event-based product analytics.
G2 rating: 4.6/5⭐
Mixpanel is a powerful product analytics tool with a long-standing reputation. Because of its website traffic attribution features, it is sometimes included among the best website analytics tools.
However, Mixpanel excels at event-based tracking, allowing teams to understand user flows, conversion funnels, and retention.
Key features:
-
Marketing analytics: Mixpanel allows teams to analyze acquisition channels, marketing campaign performance, and user engagement. It supports multi-touch attribution and identity resolution to help teams connect marketing efforts with product usage.
-
Website analytics: It provides granular analysis of metrics like bounce rates, page views, and session durations.
-
Product analytics: Mixpanel offers powerful and flexible funnel analysis, detailed cohort retention analysis to understand churn drivers and user loyalty, flow reports to visualize user paths, and strong segmentation capabilities.
Mixpanel pros and cons
✅ Integrations: Mixpanel integrates smoothly with 100+ tools to expand its usefulness. For example, despite not having any engagement layer, you can integrate it with Userpilot to act on your insights.
✅ Comprehensive product analytics: Mixpanel provides advanced analytics capabilities such as funnel analysis, retention cohorts, segmentation, and user flow reports that help teams understand user behavior in depth.
✅ Generous free plan: Mixpanel’s free plan allows teams to track up to 1 million events per month, which is often sufficient for startups or smaller SaaS products beginning with product analytics.
❌ Steep learning curve: Some users report that Mixpanel’s large feature set and event-based data model can be difficult for new users to learn.

❌ Event tracking requires careful setup: Users report that setting up clean event tracking requires upfront taxonomy planning, and reports can become difficult to manage.
❌ Costs increase as event volume grows: Mixpanel pricing scales with event volume, which means analytics costs can increase quickly as a product grows and generates more tracked events.
Mixpanel pricing
Mixpanel offers a freemium plan and event-based paid tiers.
-
Free plan: Tracks up to 1 million events per month and includes access to up to 5 saved reports and 10,000 monthly session replays.
-
Growth plan: Paid plan where pricing scales based on event volume. You can estimate exact pricing with a calculator. It unlocks higher data limits and additional analytics capabilities.
-
Enterprise plan: Offers advanced governance, security features, and higher event limits. Pricing is custom and requires contacting sales.
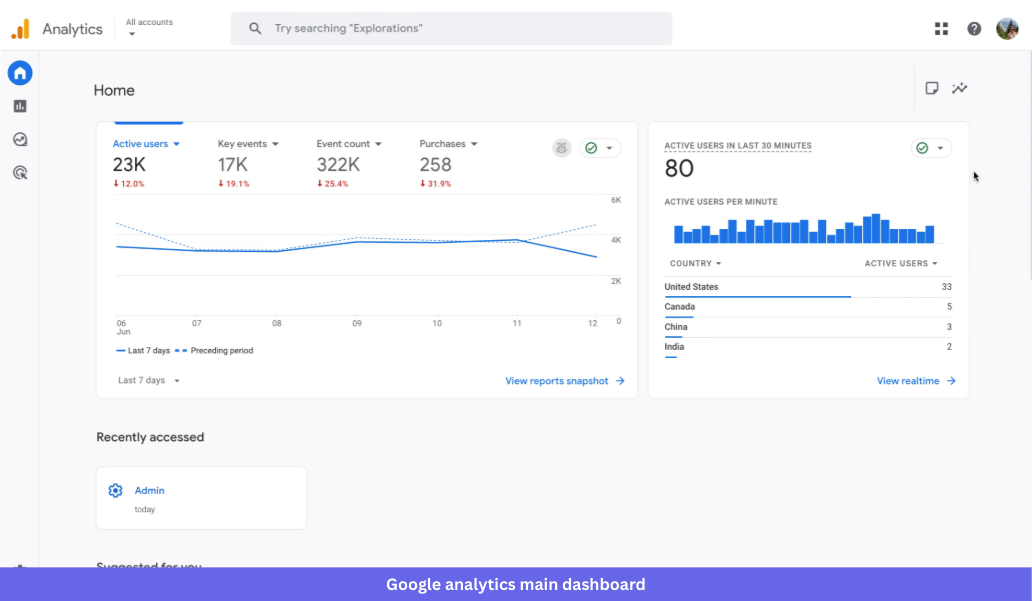
4. Google Analytics
Who can choose GA4: Marketing and web teams that want to track website performance, traffic sources, and user behavior for free.
G2 rating: 4.5/5⭐
Google Analytics (GA4) is one of the most widely used web analytics tools. It offers free event-based tracking for websites and mobile apps and is commonly used to analyze traffic sources, marketing performance, and high-level user behavior.
Google Analytics focuses primarily on website and marketing analytics rather than deep product analytics. Teams typically use it to understand acquisition channels, measure campaign performance, and analyze how users interact with landing pages and site content.
Key features:
-
Advanced reports: Includes funnels, path exploration reports, and custom explorations for deeper behavioral analysis.
-
Google ecosystem integration: Connects seamlessly with other Google solutions like Google Ads, BigQuery, etc.
-
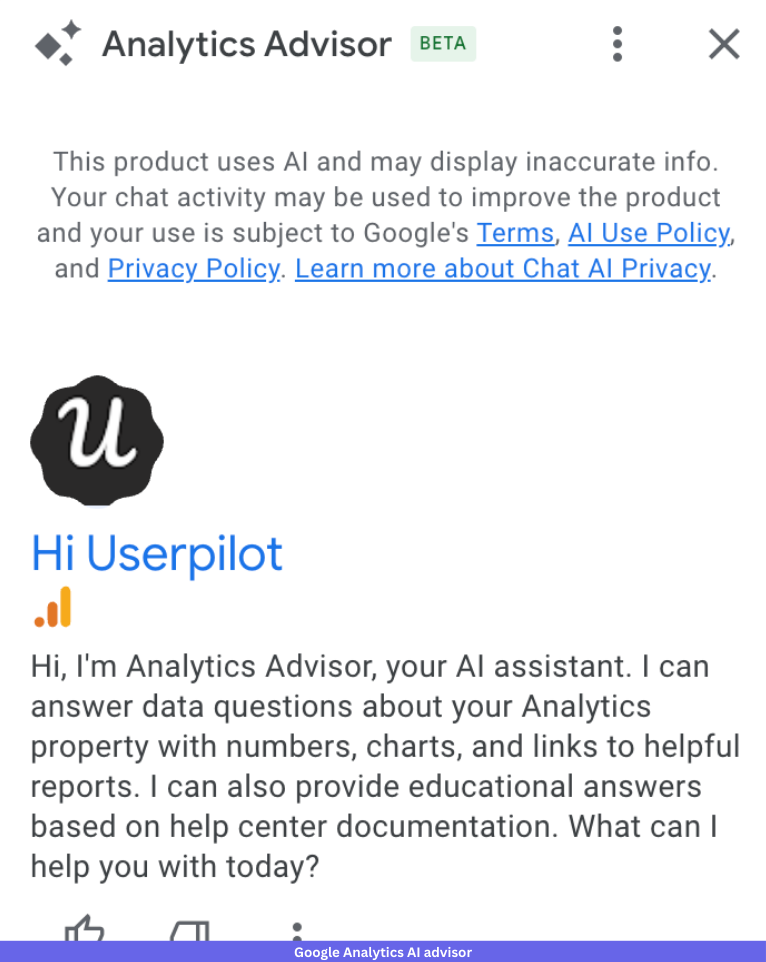
Predictive analytics: AI-powered predictive analytics provides automated insights into purchase/churn probability and more.
Google Analytics pros and cons
✅ Excellent marketing insights: GA4 offers unbeatable insights on traffic sources and campaign performance, with Andrea G. calling it a “marketer’s best friend.”
✅ Powerful and free: If understanding website performance and customer data is all you need, you won’t get better value elsewhere.
✅ Deep integration with the Google ecosystem: Native integrations with Google Ads, Search Console, and BigQuery allow teams to connect marketing data with website analytics more easily
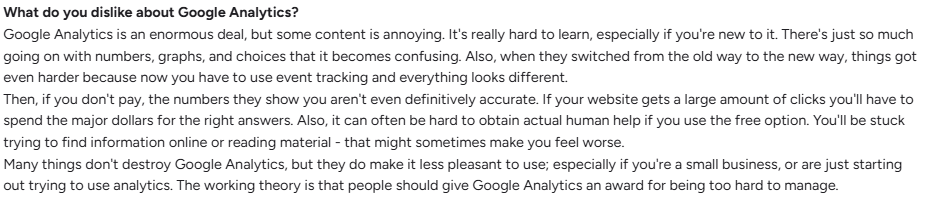
❌ Complex interface: GA4’s interface hasn’t advanced much since it launched, with a G2 user stating, “there’s just so much going on with numbers, graphs, and choices that it becomes confusing.”
❌ Requires custom reports for deeper insights: Some analyses require custom reports or additional navigation rather than being available as default views.
❌ Data limitations in the free version: Some users mention data sampling, delayed reporting, and limited support as drawbacks of the free version compared to enterprise offerings.
Google Analytics pricing
The standard GA4 is a completely free tool with most of the analytics and traffic attribution tools you’ll need.
To get more features, you can pay for Google Analytics 360. Its pricing is a bit of a mystery, however, with some sources putting the starting price at $50,000/year and others placing it at a minimum of $150,000/year.
5. FullStory
Who can choose FullStory: Product, UX, and support teams that want deep behavioral data and session-level insights to understand user experiences.
G2 rating: 4.5/5⭐
FullStory is a digital experience analytics platform that helps teams understand user behavior through session replay, funnels, heatmaps, and error tracking.
Unlike traditional web analytics tools that focus mostly on aggregate website data, FullStory focuses on qualitative insights. Teams use it to see exactly how users interact with their product, identify friction points, and turn behavioral data into actionable insights.
Key features
-
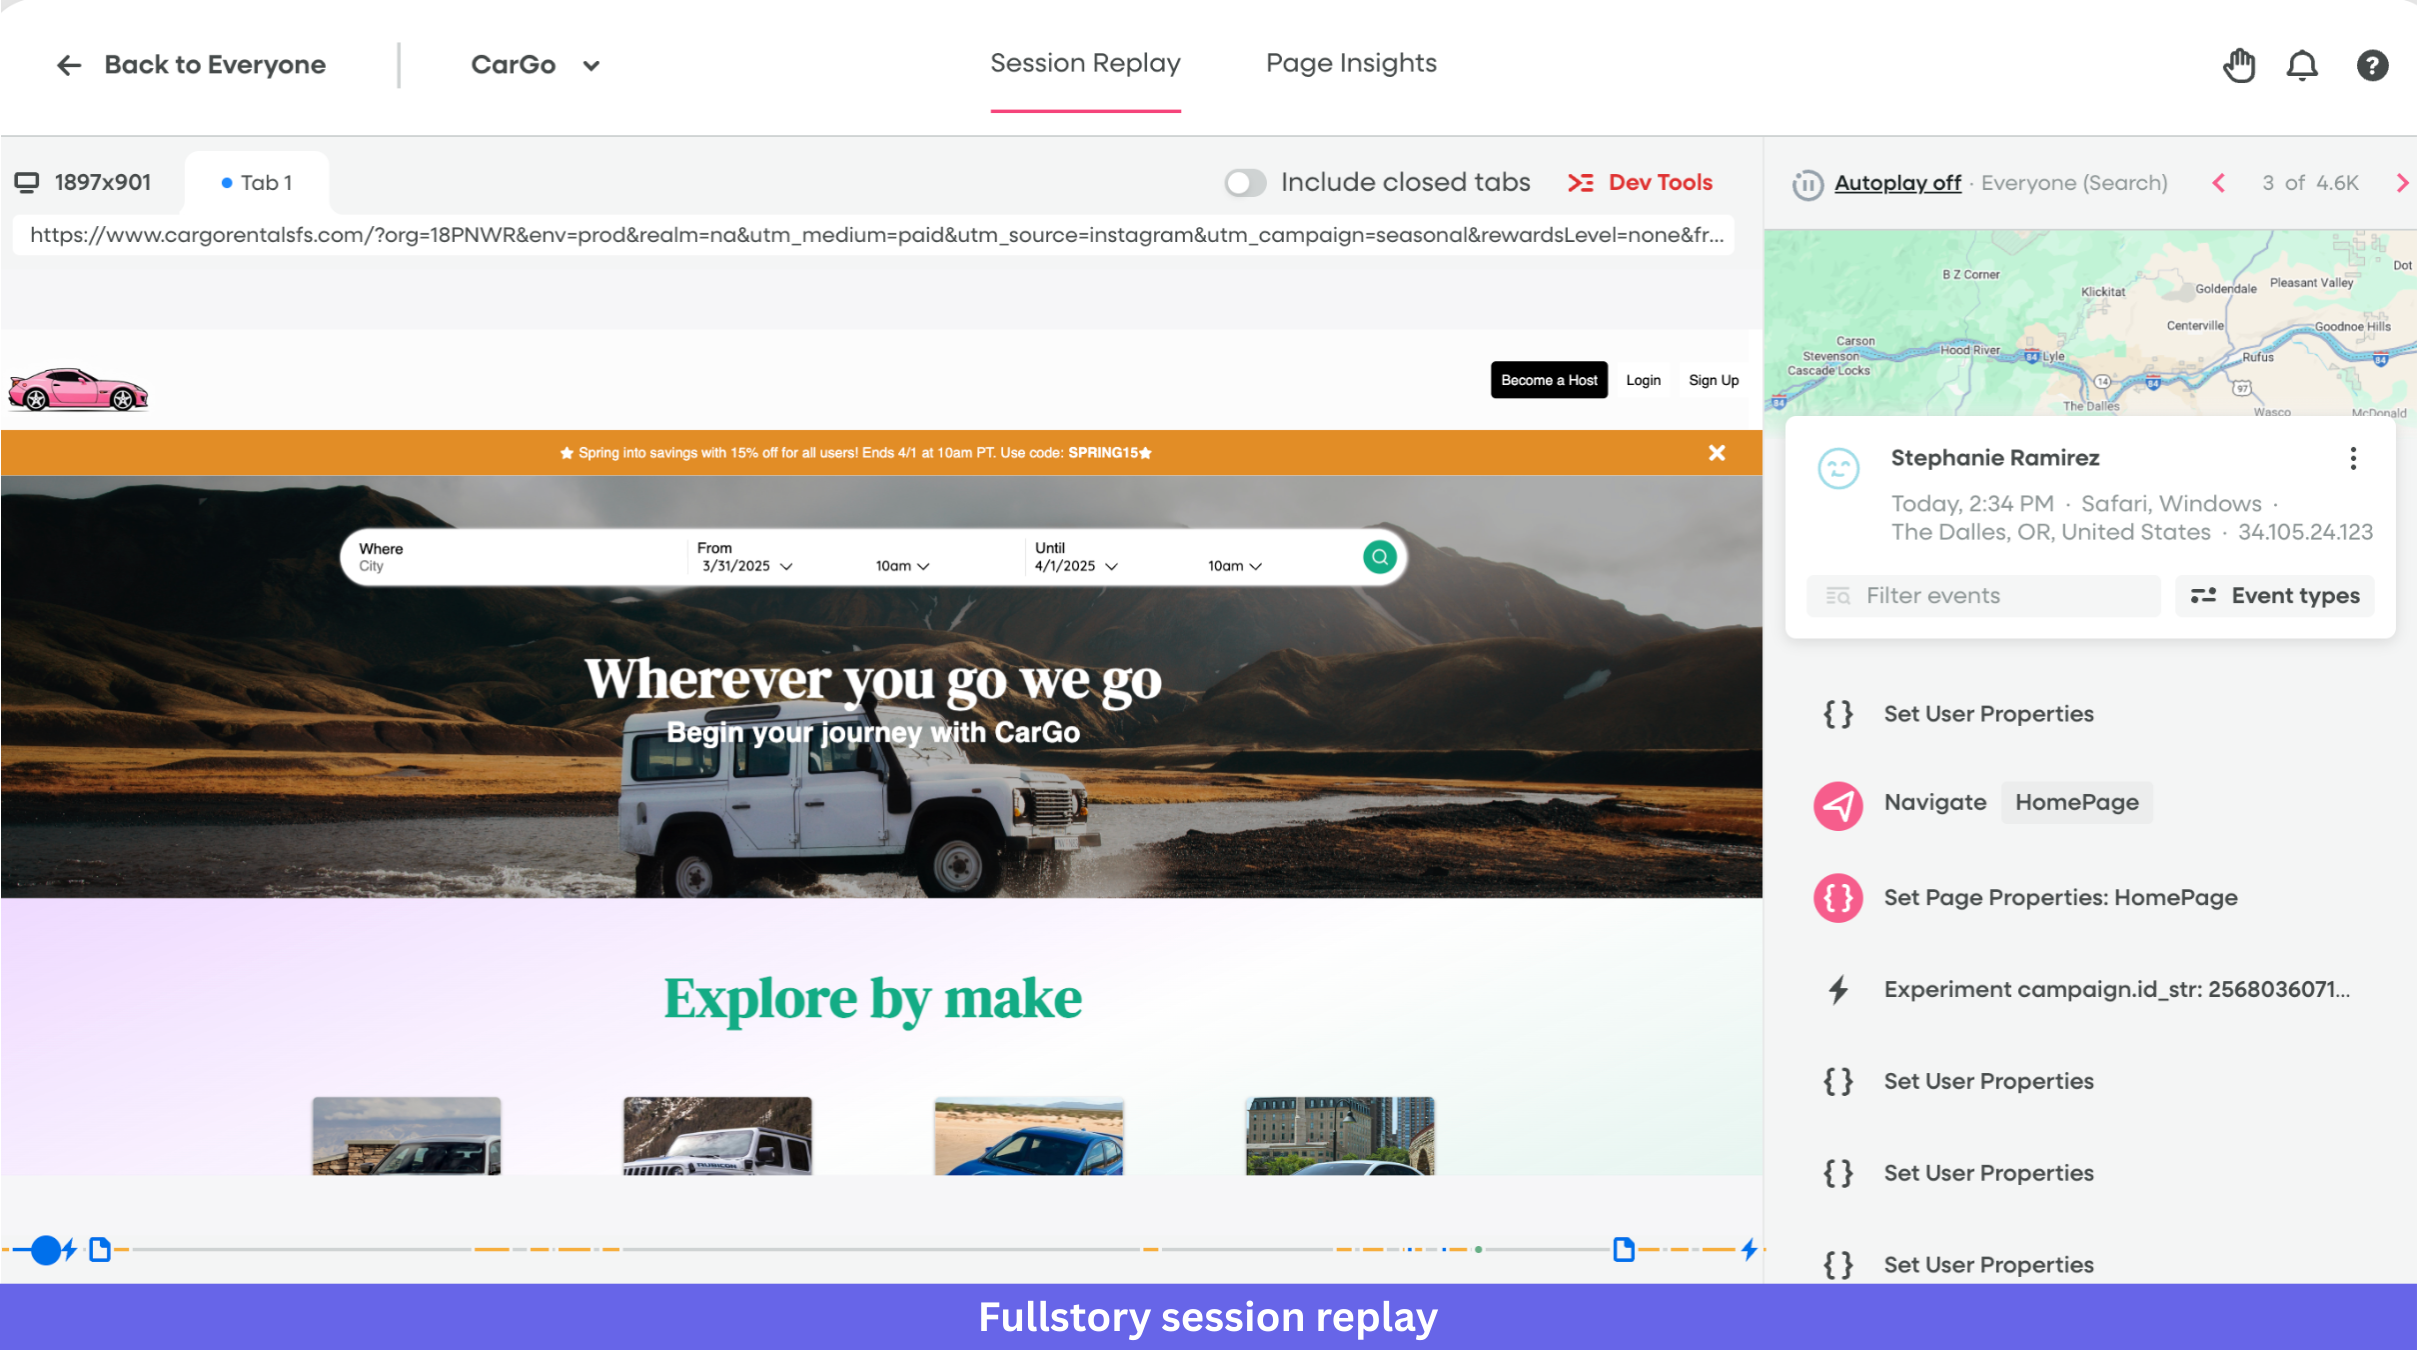
Session replay: FullStory translates DOM, console logs, and network recordings into high-fidelity recordings of user sessions.
-
“Omnisearch”: Powerful search feature for finding sessions based on behavioral data, errors, user attributes, or frustration signals.
-
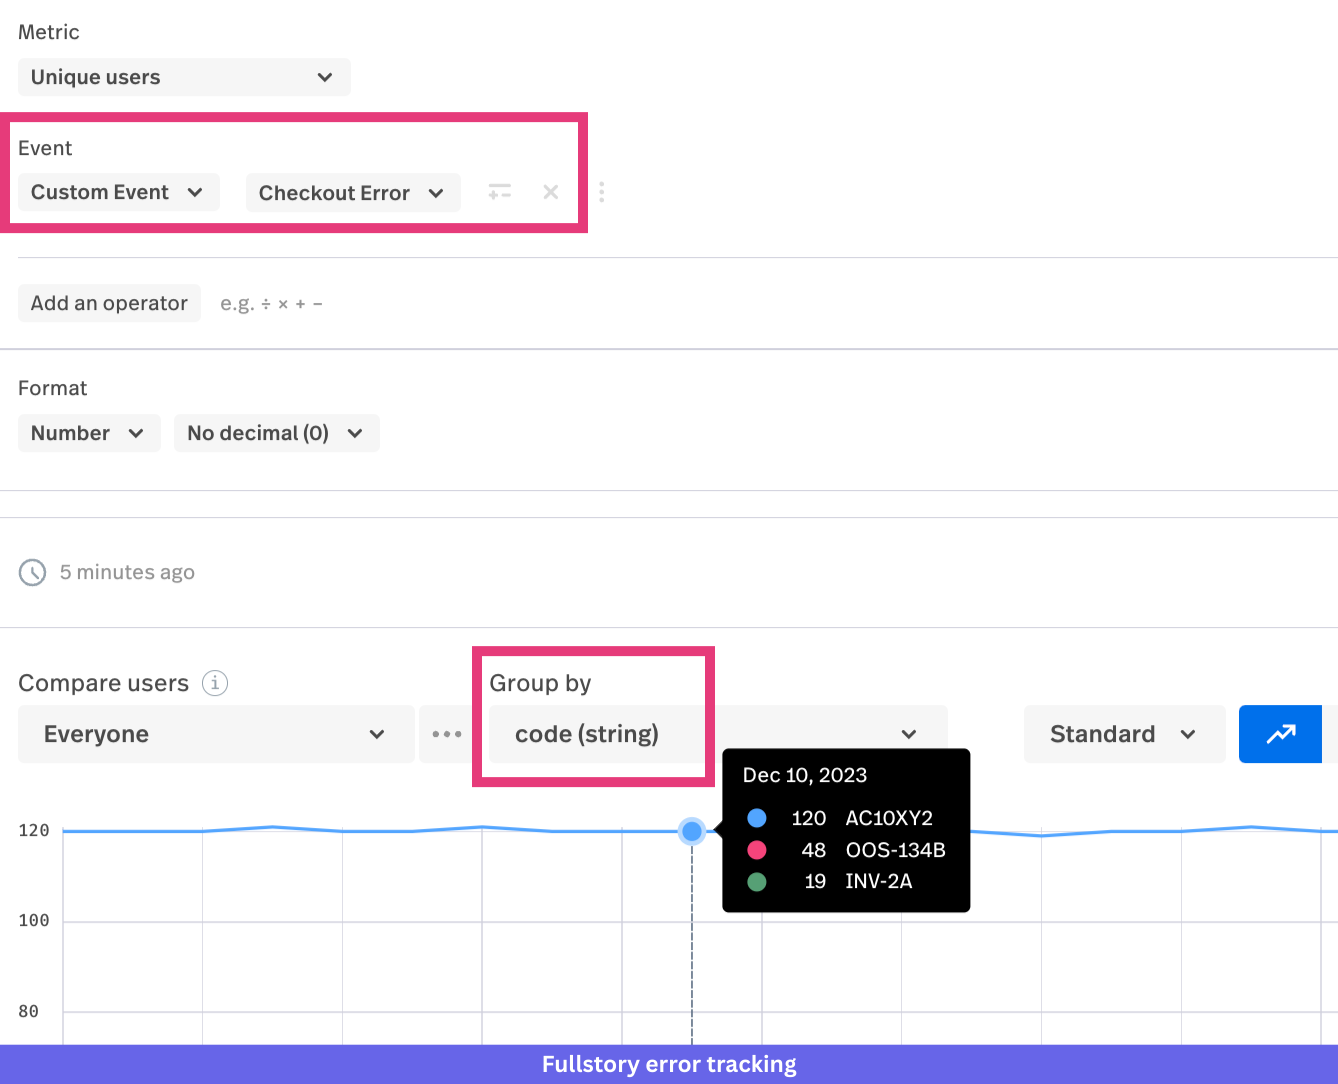
Error tracking: Automatically detects rage clicks, dead clicks, and JavaScript errors so teams can identify experience issues faster.
-
StoryAI: AI capabilities that summarize sessions, answer questions about user behavior, and help teams identify trends in customer interactions.
FullStory pros and cons
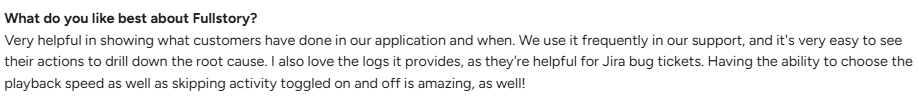
✅ Top-quality session replay: Fullstory session replay provides excellent detail for understanding individual user experiences. A G2 review from Tim P. hails it for its application in customer support, troubleshooting, and debugging.
✅ Powerful search: An extensive search function makes it easy to find sessions demonstrating certain characteristics.
❌ Unclear and expensive pricing: Prices are based on session volume and can add up quickly. Unfortunately, these prices aren’t public, making price increases difficult to plan for. Reviewers have even complained of “unfair” and “deceptive” billing practices.
❌ Learning curve during implementation: Configuring custom events and properly structuring tracking data can require additional setup time during onboarding.
❌ Manual metric configuration: Users report having to manually build metrics instead of relying on automated suggestions.
FullStory pricing
FullStory offers three pricing categories:
-
Business: Core digital experience analytics features with session replay and behavioral analytics capabilities (custom pricing).
-
Advanced: Adds more advanced analytics capabilities, integrations, and data controls (custom pricing).
-
Enterprise: Includes enterprise governance, security, and scalability features (custom pricing).
Pricing is not publicly available and depends on factors such as session volume, data retention, and feature access. However, some reports put its pricing between $300 and $1,000 per month, while others put the median pricing around $27,000/month.
6. Hotjar
Who can choose Hotjar: Marketing, UX, and product teams that want visual behavior analytics and user feedback to better understand website experiences.
G2 rating: 4.3/5⭐
Hotjar is a behavior analytics tool that helps teams understand how users interact with their website through heatmaps, session recordings, and surveys.
Instead of focusing heavily on quantitative website data, Hotjar focuses more on qualitative insights. Teams commonly use it to visualize user behavior, identify UX friction, and validate hypotheses with direct user feedback.
Key features
-
Heatmaps: Click, scroll, and move heatmaps help teams visualize how users engage with pages and which elements attract attention.
-
Session recordings: Record and replay user sessions to observe real user interactions and identify friction.
-
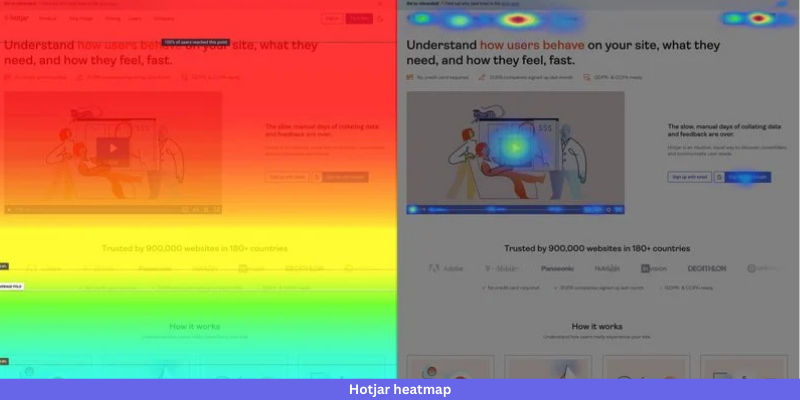
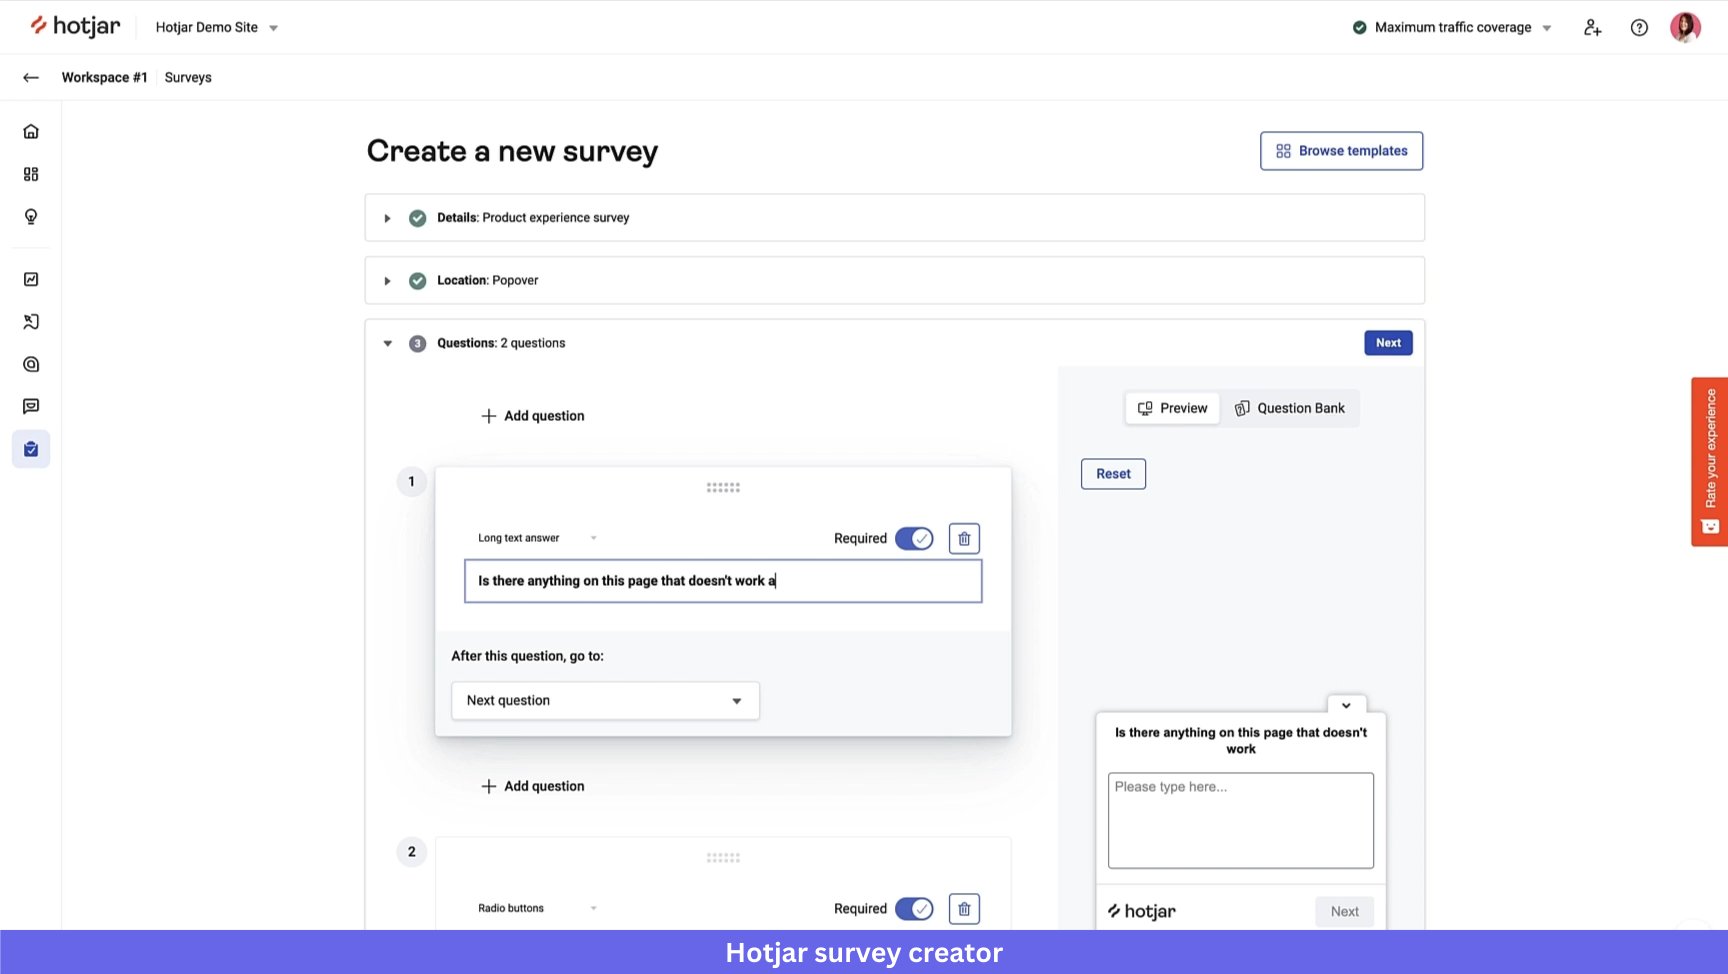
Surveys and polls: Launch targeted in-app surveys/polls to get direct user input.
Multi-page analytics: Track user interactions across multiple pages during a single session to understand how users navigate through related pages.
Hotjar pros and cons
✅ Visual analytics: Hotjar is big on visuals, with different types of heatmaps (click, scroll, and move) used to visualize engagements.
✅ Integrated feedback: The feedback layer provides direct user voice to support visual observations.

✅ Accessible pricing for small teams: The free plan and relatively low starting price make it accessible for startups and small businesses.
❌ Missing quantitative analytics: There is a heavy focus on qualitative data over robust quantitative analytics.
❌ Limited filtering and segmentation at scale: Some users report that filtering large volumes of recordings and heatmaps can become difficult, making it harder to extract insights as data grows.

❌ Potential performance impact: Reviews mention that session recording scripts may load slowly when analyzing large datasets.
Hotjar pricing
Hotjar offers a free plan along with paid tiers that scale based on session volume, data retention, and advanced analytics capabilities.
-
Free: $0/month with limited session tracking (around 200K monthly sessions), heatmaps, session replays, funnels, and basic monitoring features.
-
Growth: Starts at about $39/month and includes higher session limits (starting around 7K monthly sessions), longer data retention, journey analysis, and zone-based heatmaps.
-
Pro: Custom pricing. Includes higher session volumes (starting around 1M monthly sessions), advanced filtering, revenue tracking, and multi-session replay summaries.
-
Enterprise: Custom pricing with unlimited projects, experience monitoring, data feeds, and dedicated support.
Pricing increases based on feature access and the number of sessions tracked.
7. Optimizely
Who can choose Optimizely: Product teams who want to optimize digital experiences through rigorous testing.
G2 rating: 4.2/5⭐
Optimizely is a digital experience platform best known for its experimentation capabilities. It allows teams to run A/B tests, multivariate tests, and feature experiments to improve conversion rates and user experiences.
Unlike traditional web analytics tools that focus primarily on reporting website data, Optimizely focuses on experimentation. Teams use it to validate hypotheses, optimize landing pages, and improve conversion tracking through controlled testing.
Key features
-
Web experimentation: Conduct client-side web experimentation with A/B testing, multivariate testing, and personalization on a visual editor.
-
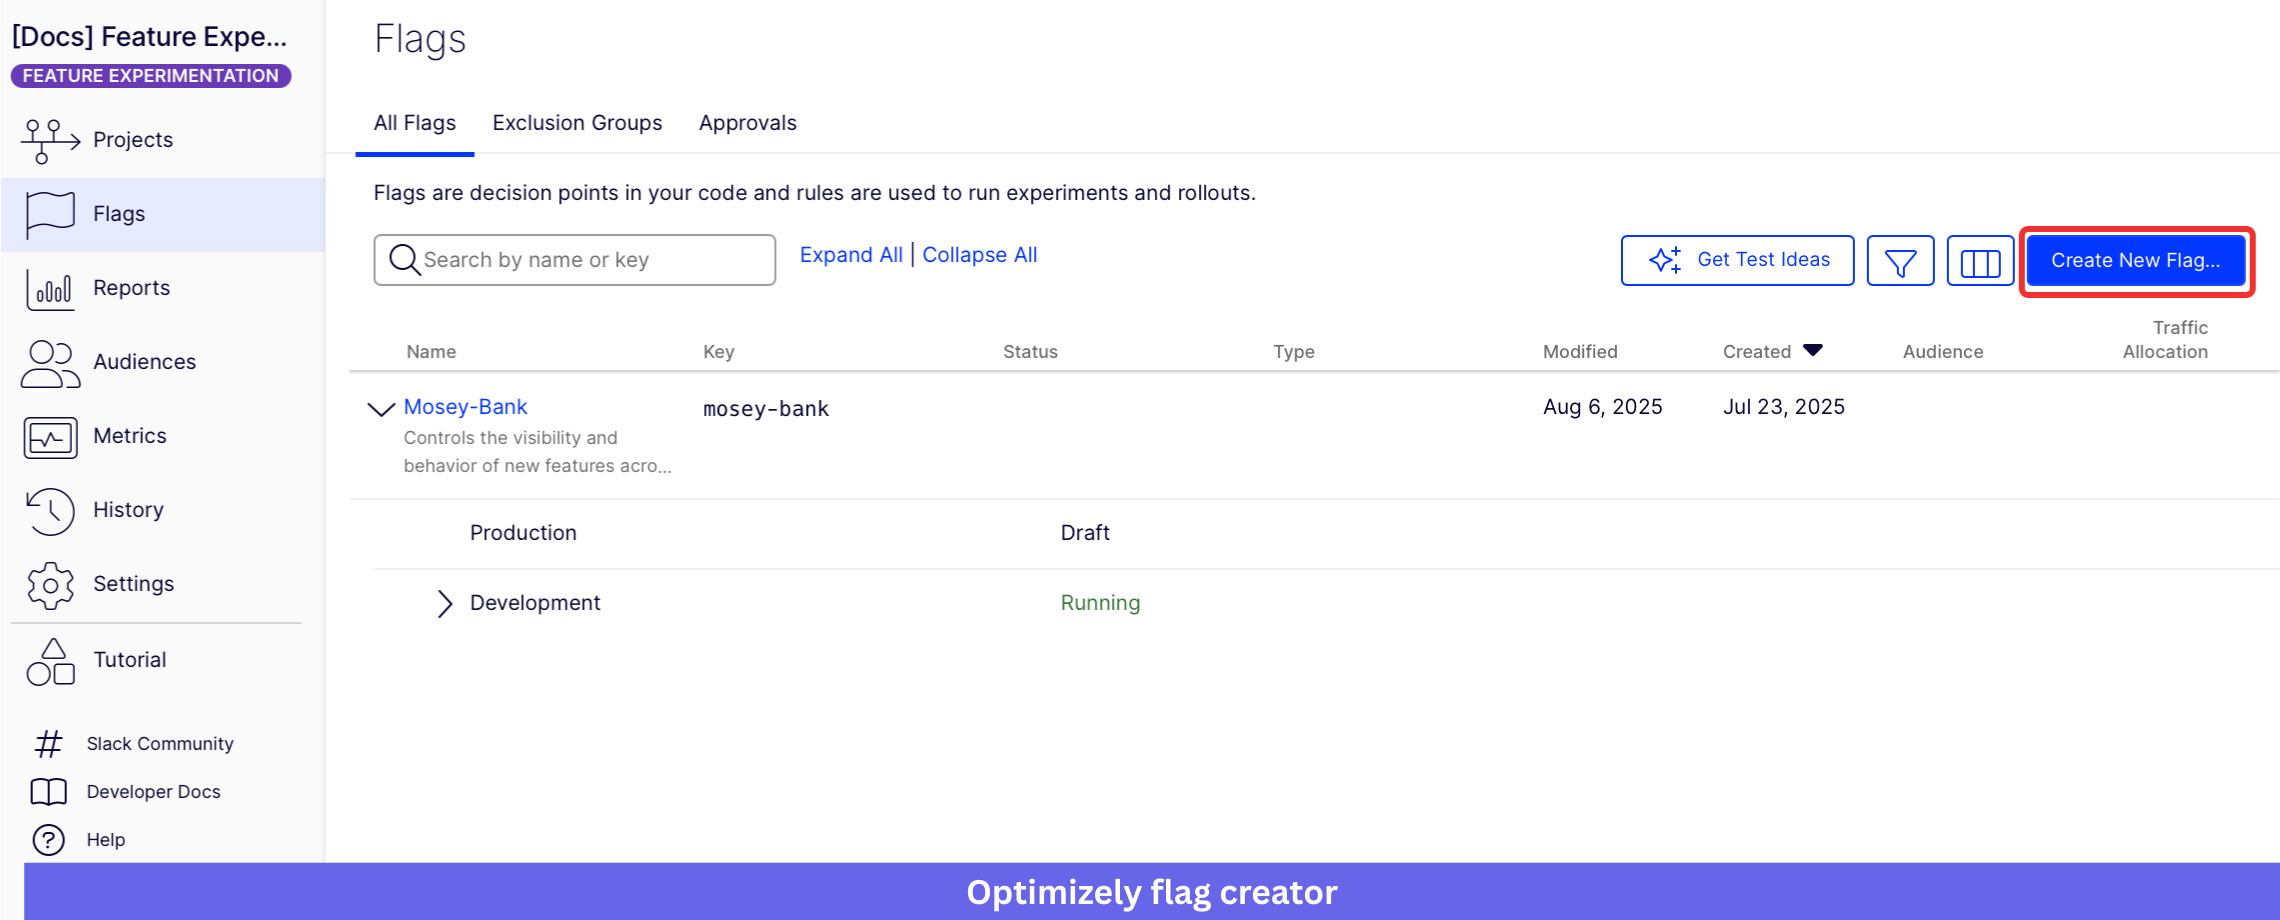
Feature experimentation: Server-side testing of features and targeted rollouts for web, mobile, and backend features.
-
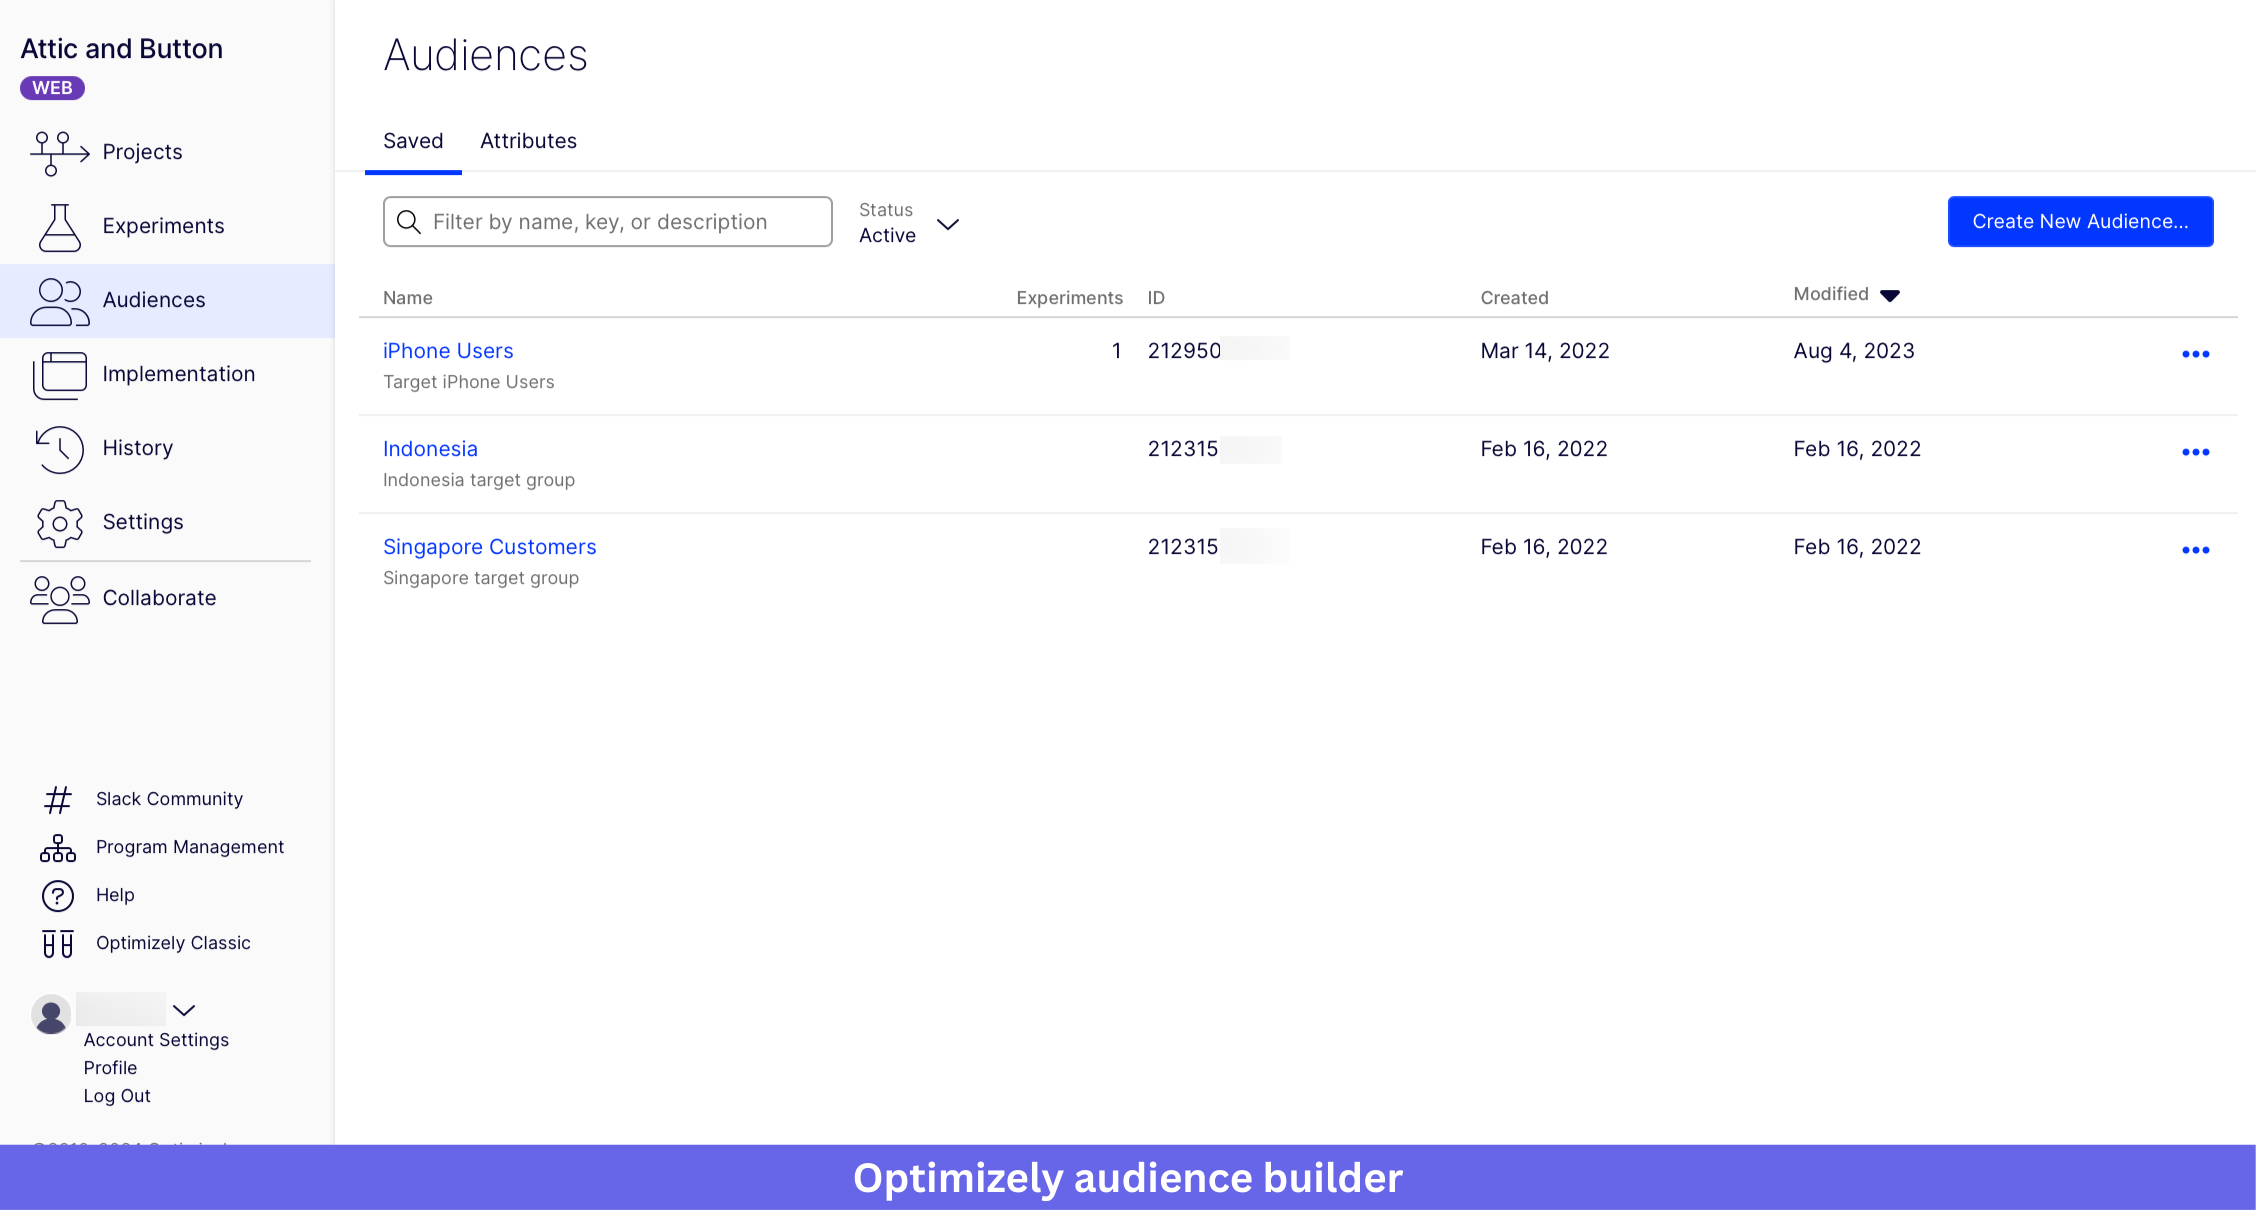
Audience builder: Create cohorts from your audience with similar attributes and run experiments for specific cohorts.
-
Statistical engine: Optimizely’s robust statistical engine measures test results, tracks goals, and identifies statistical winners.
Optimizely pros and cons
✅ Robust testing and personalization: A/B testing, MVT, and feature flagging at scale, with a strong personalization engine.
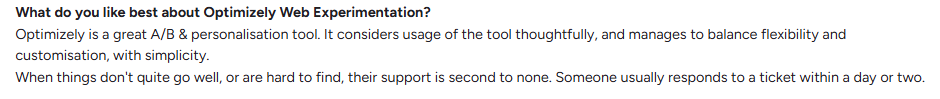
✅ Cross-channel support: Experiment on web or mobile across your full-stack application.
✅ Advanced personalization capabilities: The platform allows teams to create targeted experiences based on audience behavior and segmentation.
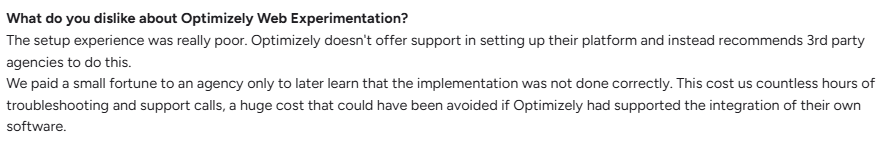
❌ Pricey: Optimizely’s pricing (often starting around $36K/year, depending on modules) is frequently described as expensive or cost-prohibitive in user reviews.
❌ Complex setup process: Its steep learning curve and complexities require significant developer involvement. One user even claims they had to pay “a small fortune to an agency” to set it up.
Optimizely pricing
Optimizely pricing depends on the products you choose (such as Web Experimentation, Feature Experimentation, or Personalization), traffic volume, and feature requirements.
Pricing is not publicly available, and interested teams must contact sales for a custom quote. Enterprise experimentation platforms like Optimizely are generally positioned toward mid-market and enterprise companies due to their pricing and implementation requirements.
Turn user analytics insights into smart product decisions
User analytics tools help you understand how users interact with your product, where they struggle, and what drives engagement. The right platform should not only surface data but help you turn insights into better product decisions and improved user experiences.
If you’re evaluating platforms, this webinar on choosing the right user engagement platform includes a practical checklist you can use to compare tools and identify what matters most.
FAQ
What is user analytics?
User analytics is the process of collecting, analyzing, and interpreting data on how users engage with a product, helping businesses make informed decisions and enhance user experience.
Which is the best user analytics tool?
There isn’t a single “best” analytics tool. The best for you depends on your business goals, budget, and technical abilities. Some of the best overall analytics tools include Userpilot, Mixpanel, and Hotjar.
How to use user analytics software to implement a working data strategy?
User analytics only delivers value when you use it to spot what matters, act on insights, and continuously improve based on results.
Identify activation metrics
Don’t track everything. Identify the 2-3 behaviors that correlate with long-term retention-your Aha! Moment. Compare your most successful users against churned users. What did the successful group do in their first week that the others didn’t? (e.g., “Invited a teammate”).
Contextualize with segmentation
Generic experiences kill conversion. An effective customer segmentation strategy isolates new users from power users. Create dynamic segments like “Slipping Away” (active 3 days ago, now silent) or “Ready to Upgrade” (hit 90% usage limits) to prepare for targeted messaging.
Trigger immediate interventions
If data shows the “Pro” segment isn’t using a key feature, launch a checklist or slide-out modal specifically for them. Use button actions to take them directly to the value point.
Iterate based on results
Your first attempt will likely be imperfect. Review and refine. Use A/B testing to refine the copy.
FAQ
What is user analytics?
User analytics is the process of collecting, analyzing, and interpreting data on how users engage with a product, helping businesses make informed decisions and enhance user experience.
Which is the best analytics tool?
There isn’t a single “best” analytics tool. The best for you depends on your business goals, budget, and technical abilities. Some of the best overall analytics tools include Userpilot, Mixpanel, and Hotjar.
About the author