Event Analytics Guide for Product Managers


How can product managers leverage event analytics to gain insights necessary to build valuable and delightful user experiences?
That’s the key question that we discuss in our guide. We also look at:
- The importance of events analytics
- Different types of events you can track
- Best events analytics tools
What is event analytics?
If you run a Google search on event analytics, you’ll get results from the event industry. For example, there’s content on monitoring attendee engagement at conferences or trade shows.
However, this article is not for an event manager but rather a digital product manager.
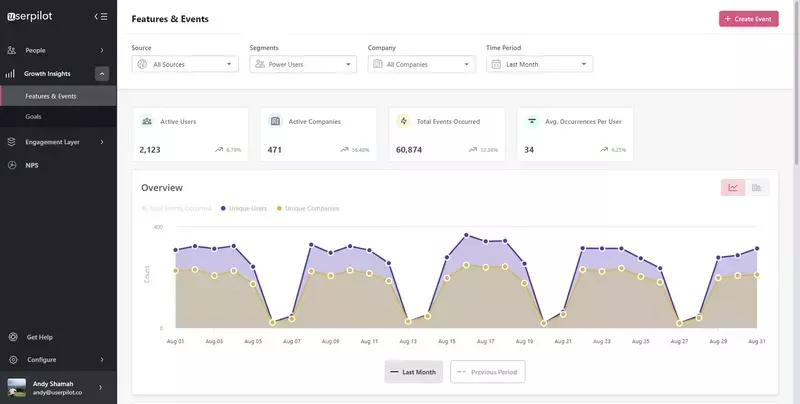
In product, event analytics is the process of tracking and analyzing user interactions with your product at different touchpoints in the user journey.
What could be an example of such interactions? That’s everything that the user does in your app, like clicking on a feature, navigating to a different page, making a purchase, or completing a checklist. All of these fall under the umbrella term of event analytics.
Why is event analytics important?
Events analytics enables product teams to understand how users interact with the product and identify their pain points, preferences, and behavior patterns. This allows them to optimize the customer experience.
By tracking user actions, you can also assess the overall product performance (e.g., conversion rates) and identify opportunities for future innovation.
Different types of event analytics
There are various types of events that you could track. Let’s look at three common ones:
- Server-side events (SSEs)
- Front-end event tracking
- Custom events
Server-side events
Data on server-side events (SSEs) are connected to your app through API. Non-tech product teams often need a developer’s help to install a tracking code for the specific events they want to track. Once the event occurs, it is sent to the analytics platform.
Front-end event tracking
For a while, SSEs were the only way to track events. However, there’s a big chance you won’t have to deal with it at all these days. That’s because many analytics platforms enable you to tag the events you want to track from its front end.
You simply choose the features or UI elements that you want to track from the app, and it does all the work for you without having to write a single line of code.
Custom events
A custom event is a combination of back-end and front-end events that merges multiple events into one. This functionality allows you to track lots of different user actions as if they were one.
What’s the benefit of that?
Let’s imagine you’ve identified a number of actions leading up to user churn. If they complete one or two of them, it’s no big deal. If all of them – you’ve got a problem.
You could easily bundle them up into one custom event and track users who complete it. When that happens, you could automatically trigger contextual guidance to increase their engagement or a survey to collect their input on how to improve the experience.
How can product managers leverage event analytics data?
There are a number of ways product managers can use event analytics insights to improve their products and boost user satisfaction. Let’s explore them.
Understand user behavior through segment analysis
Users engage with products in different ways based on their needs. To better understand what makes different users tick, you need to segment them.
There are two ways to go about it. You could start by segmenting your user based on their needs and JTBDs. You can easily collect necessary data through a sign-up survey.
Once you have your segments set, you can track the events that each of them completes to identify patterns in their behavior.
Alternatively, you could segment your users based on the events they complete and then look at other common factors that these users share.
Analyze the customer journey through funnel analysis
Event tracking also allows you to follow users as they progress through the funnel.
Let’s imagine you have a scheduling app like Calendly. Having the first appointment booking is the moment when users experience its value. However, to get to this point, they need to complete a sequence of events to set it up and share.
You could track user success at different stages and see how quickly they manage to complete them. If it takes too long or they fail to do it, it means you need to look for ways to optimize it.
Identify popular product features
Event tracking helps you identify the features that users engage with the most.
It matters for two reasons.
First, you know which features deliver the most value and which of them you should prioritize for future development.
Second, it tells you which features to highlight to potential users in your marketing campaigns and then during their onboarding process to make sure they activate them.
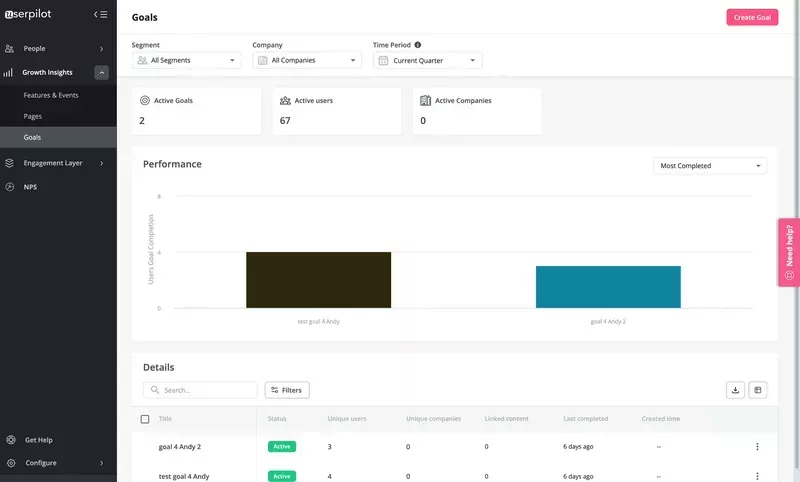
Measure the success of new features
Apart from identifying your killer features, event tracking can help you assess how successful your new features are.
The two questions that you want to answer are:
- Are users using the feature?
- Does it allow them to achieve their goals?
To answer the first one, you simply track its usage in-app across different user segments.
For the second one, set specific goals and track their completion. If the feature success is linked with a number of goals, you could use the custom event functionality to track them all in one place.
Conclusion
Event analytics enables product teams to collect data on specific user interactions with the product. Analysis of such data allows them to:
- Understand the behavior of different personas,
- Identify the most valuable product features,
- Assess the performance of newly released functionality,
- Make informed prioritization decisions,
- And, identify friction points and areas for improvement.
If you’d like to see how to leverage Userpilot event analytics features, book the demo!
About the author