How to Leverage Funnel Analytics to Streamline Product and Marketing Efforts
Funnel analytics is one of the buzzwords in marketing, sales, and product management.
But what exactly does it involve?
In the article, we discuss just that. We explain what funnel analytics is, why it’s relevant, and how to conduct and leverage it to drive product success. We also look at the best analytics tools for the job.
Let’s get into it!
Try Userpilot Now
See Why 1,000+ Teams Choose Userpilot

What is funnel analytics?
Funnel analytics is a research method that helps you understand how users navigate their way through a series of steps or stages in a website or application.
Its main purpose is to help marketers, product managers, and UX designers understand where users drop off in their journey before completing a desired action, like booking a product demo, signing up for a free trial, or upgrading to the premium plan.
Is your funnel analytics strategy watertight?
Spotting the drop-off is easy. Knowing why it happened is hard. Take this 4-step assessment to see if you are getting the most out of your funnel analytics.
Why is it important to conduct funnel analysis?
By understanding at which stage of the funnel existing users drop, teams can optimize the user journey and increase conversions.
In practice, this translates into more users signing up for the product, experiencing its value, converting to paying accounts and referring the product to their friends.
That’s because a well-optimized funnel offers users a more positive customer experience and enables them to achieve their goals in less time and with less effort. This leads to higher customer satisfaction, retention, and loyalty. This means higher customer lifetime value and more revenue.
On the flip side, a leaky funnel means lost opportunities and wasted resources, for example, on acquiring customers that you can’t retain.
Overall, funnel analysis gives teams the knowledge they need to improve user experience and boost the business performance of the product.
How can marketing and product teams use funnel analysis?
Let’s have a look at a few practical ways to leverage funnel analytics in marketing and product management.
Identify friction areas and drop-offs in the marketing funnel
One of the key applications of funnel analysis is identifying friction points in the marketing funnel.
Very often, one look at the chart is enough to do it:
If you can see that one of the bars gets dramatically narrower than the previous ones, you can expect that users may be experiencing friction at the previous stage.
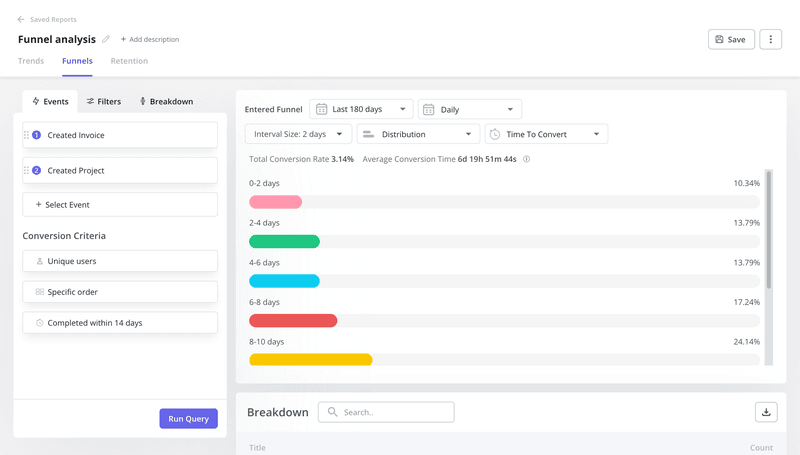
Another way to find friction is by analyzing the time to convert. If converting from one stage to another takes longer than it should, this is the area you might want to optimize.
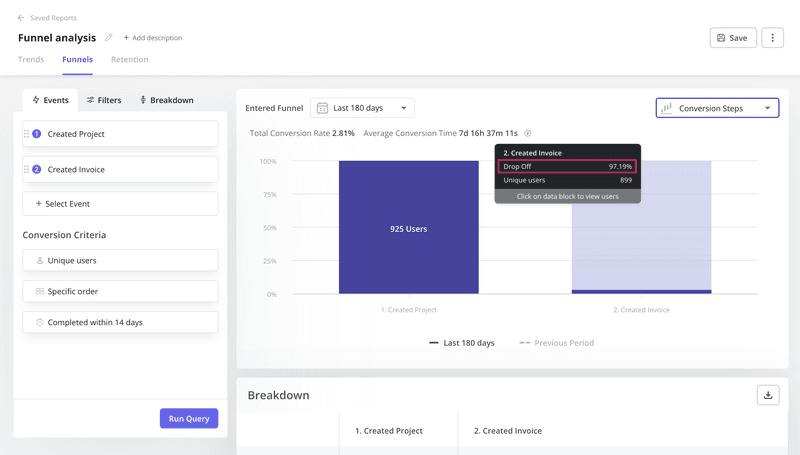
Drop-off rate in funnel analytics.
Monitor the conversion rate at important customer journey stages
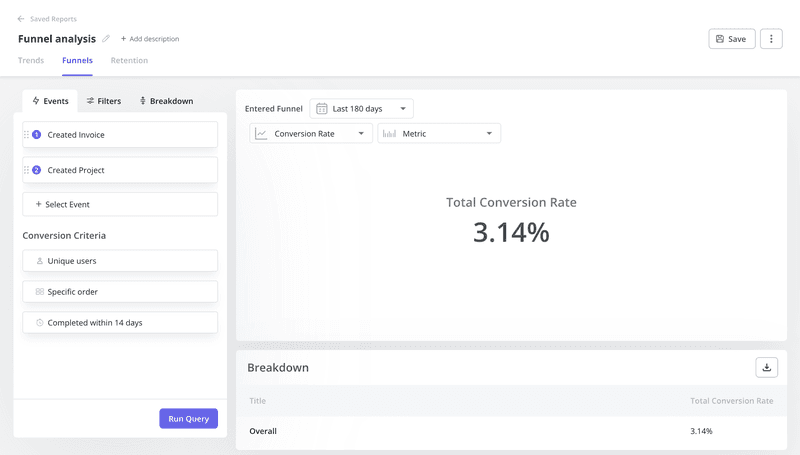
The funnel conversion rate is the opposite of the drop-off rate: it tells you how many users progress from one stage to the other.
High conversion rates are evidence that your marketing campaign or user onboarding process is successful and drives the desired results. And if they’re low, they show you which part of the funnel you need to optimize.
Monitoring conversion rates also helps you forecast such metrics as churn rate, monthly recurring revenue, or LTV.
Improve feature adoption by analyzing funnel reports
Funnel analysis enables teams to improve feature activation and adoption.
You do it by tracking how long it takes users to experience the feature value and start using it regularly to get a job done. If the process is longer than it should, for example, by comparison to other similar actions, you look deeper into what may be causing the delay.
You can do it by collecting feedback from the affected user segments or analyzing their behavior on a more granular level.
Determine the ideal free trial period
For product-led companies, the funnel analysis is a great tool for deciding how long the free trial should take.
The idea is that it should be long enough for users to experience and start realizing product value but not long enough to achieve all their goals without subscribing to the product. Otherwise, they won’t have a reason to do so.
How do you do it?
You track how much time it takes users to get from the sign-up to the activation stage. That’s how long your free trial should be.
Monitor user behavior over time
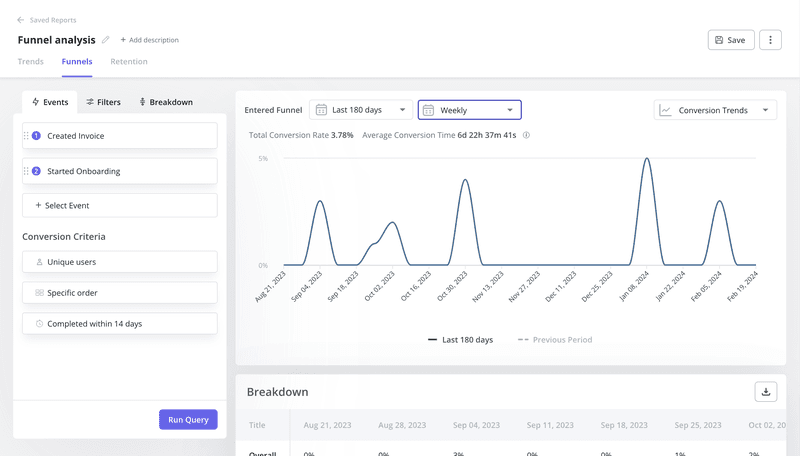
Funnel analysis also allows teams to monitor conversion trends over time. This could be used to assess the impact of product changes and funnel optimizations on the conversion rates.
Let’s imagine one of your funnel analyses has revealed that users drop off while working through an onboarding checklist.
You implement tweaks to the checklist and look at the conversion data following the change to evaluate the effectiveness of the intervention. Easy peasy.
Finally, conversion trends analysis can help you identify the best times to engage your users for maximum impact. For example, if B2B users tend not to convert at weekends, you’re better off concentrating your marketing efforts on weekdays.
How to conduct a funnel analysis to gain actionable insights?
Now that you know how funnel analytics can benefit your teams, you must want to know how exactly to carry it out.
Map out each stage of the conversion funnel
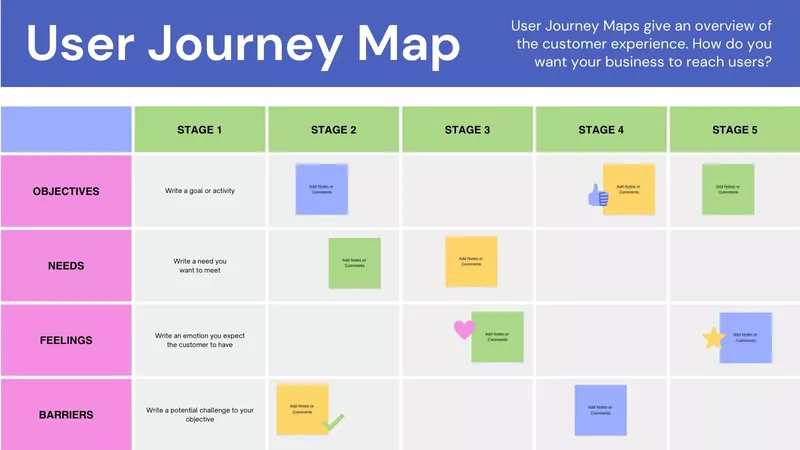
First, you need the user or customer journey map outlining the stages as well as user actions at different touchpoints.
What is particularly important is defining the conversion events. These will tell you when the user progresses from one stage to another.
Finding such events could be straightforward. For example, signing up for the free trial and booking the demo could mark the progression into the consideration stage in the marketing funnel.
However, it’s not always so easy, as sometimes the user needs to complete multiple events to convert. In his recent talk at the Product Drive Summit, Sean Ellis gave the example of Noom, a weight loss app, where users need to complete 60 steps to reach the activation stage.
How do you identify them?
Path analysis is an effective way.
Define metrics for each funnel step
At each stage of the funnel, you can track multiple metrics, but it doesn’t mean you should, so take your time to determine which ones matter the most.
The choice of metrics depends on your goals and the aspect of the product performance you’re analyzing.
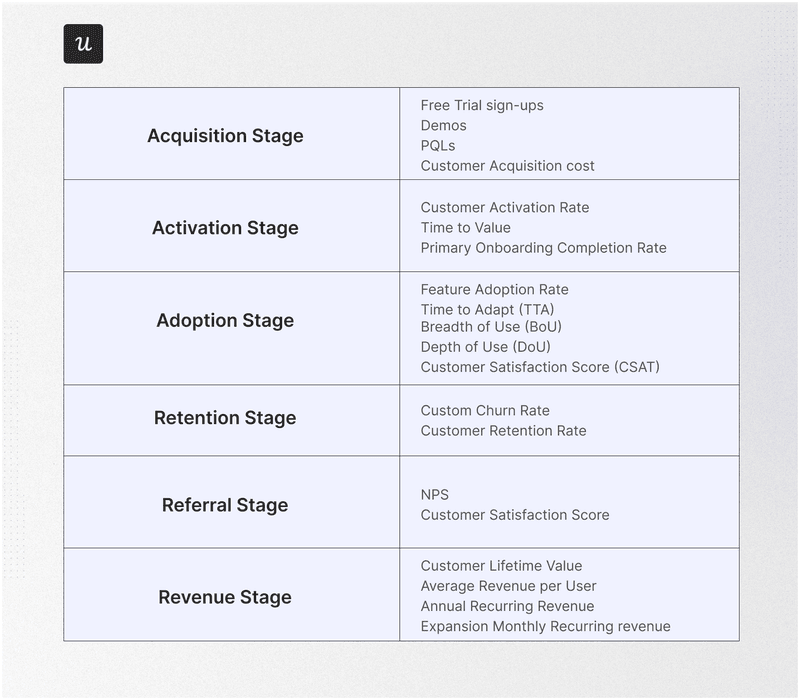
If you’re conducting a general product funnel analysis, examples of relevant metrics could include:
- Free trial sign-ups, demo bookings, PQLs, and CAC at the Acquisition stage.
- Activation rate, time to value, and primary onboarding completion rate at the Activation stage.
- Adoption rate, time to adopt, breadth of use, and depth of use at the Adoption stage.
- Churn and retention rates at the Retention stage.
- NPS and CSAT at the Referral stage.
- LTV, average revenue per user, and annual recurring revenue at the Revenue stage.
Track user behavior at important customer touchpoints
To carry out funnel analysis, you need to track the conversion events you’ve identified when mapping out the funnel.
This could be fairly complex if you have to attach code to each event. Fortunately, many modern tools, including Userpilot, allow you to tag these from the front end.
This includes creating custom events made up of multiple user actions. So if a user needs to complete 5 actions at a particular stage to convert, you can bundle them together and track them as one.

Create a funnel report to monitor conversion rates
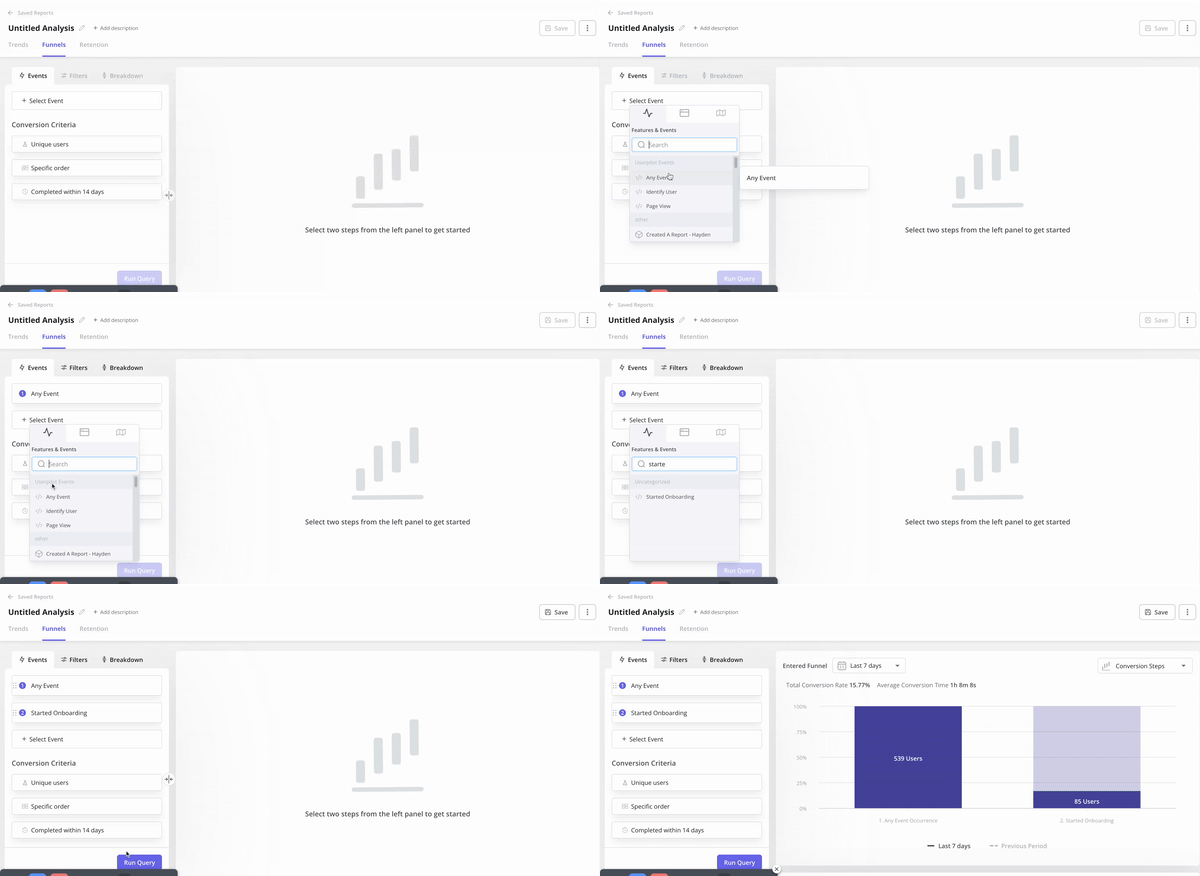
With the event tracking in place, it’s time to visualize the data in the funnel chart.
In Userpilot, you do it by selecting the conversion events and specifying the conversion criteria. The latter allows you to:
- Choose between user and company levels.
- Consider events completed in a specific or random order.
- Define the window during which the events need to take place.
In addition, you have the option to filter the data, for example, by user segment.
Once the report is ready, you can view the visualization of conversion steps or conversion trends at each step. You also get the breakdown of conversion and drop-off rates as well as the time to convert data.
Pair funnel analysis with other analytics techniques
Funnel analytics offer you a high-level picture of user conversions at different stages of the user journey, so they’re perfect for identifying the areas that need optimizing.
However, the insights aren’t granular enough to determine what causes user friction or how to optimize them.
For that, you need to back funnel analysis with other techniques.
For example, the path analysis mentioned above allows you to map out all user actions at a particular stage, while session recording offers insights into user interactions with UI elements on websites or app screens.
In addition to analytics, customer feedback is an excellent source of qualitative data on how to improve the user experience to remove friction and boost conversions.
You can collect it via in-app and email surveys. The former is more effective at reaching active users, while the latter – is for inactive or churned ones. User interviews or user testing sessions are less time- and resource-effective but can offer invaluable insights, so consider them as well.
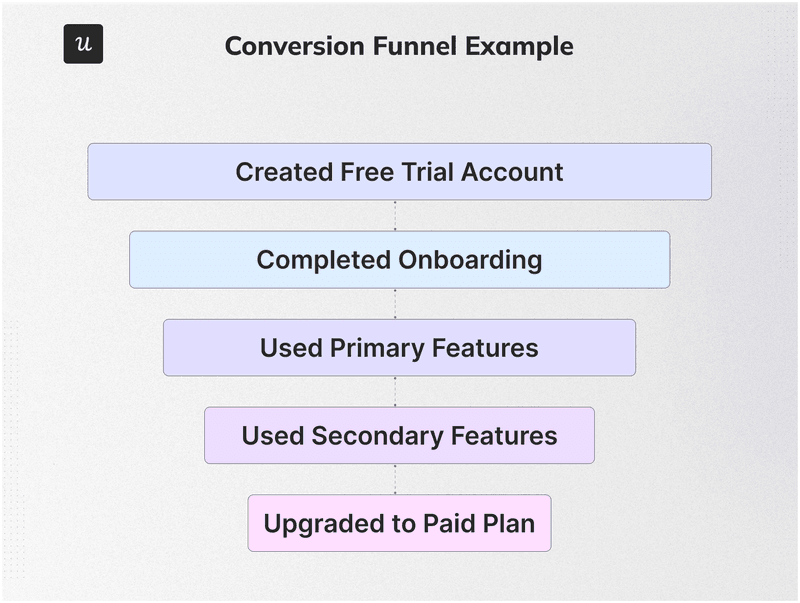
What is a conversion funnel analysis example?
Just to wrap it up, let’s have a look at an example of a conversion funnel.
This particular one consists of 5 stages:
- Create a free trial account
- Complete onboarding
- Use primary features (essential to realize product value)
- Use secondary features (more advanced, expanding the functionality and allowing to fully realize the product potential)
- Upgrade to a paid plan
The best funnel analysis tools in 2024
As mentioned, a robust analytics tool is essential for effective and efficient funnel analysis. Have a look at two analytics platforms with powerful funnel analytics capabilities for each stage of the customer journey.
Userpilot – Advanced funnel analytics tool
Userpilot is a product growth platform.
This means its functionality isn’t limited to product analytics: you can also use it to collect user feedback via in-app surveys and engage them inside the product for better conversions.
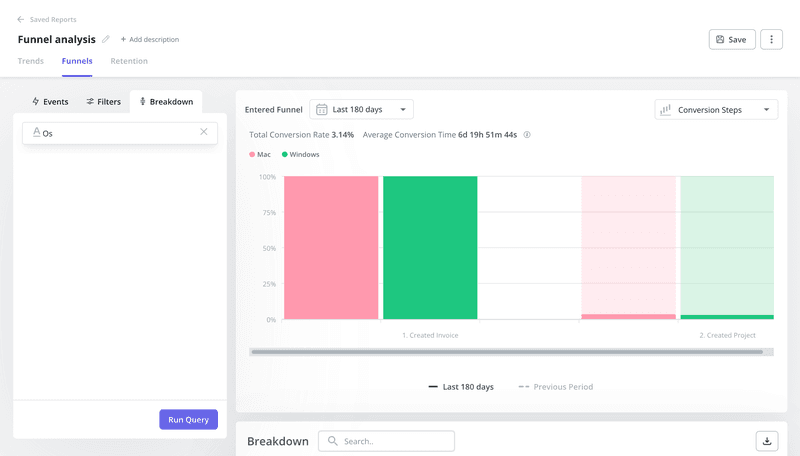
Back to funnel analytics, though: I’ve already mentioned how to visualize the data as conversion steps and conversion trends.
What I didn’t say was that you can also break the data down by user or company properties. In practice, this means the ability to compare the funnels for different user segments, like users of different operating systems or on different pricing plans.
In addition, Userpilot customers get access to:
- Path analysis
- Session recordings (coming in Q2 2024)
- Custom dashboards (coming in Q1 2024)
Google Analytics – Free funnel analysis tool
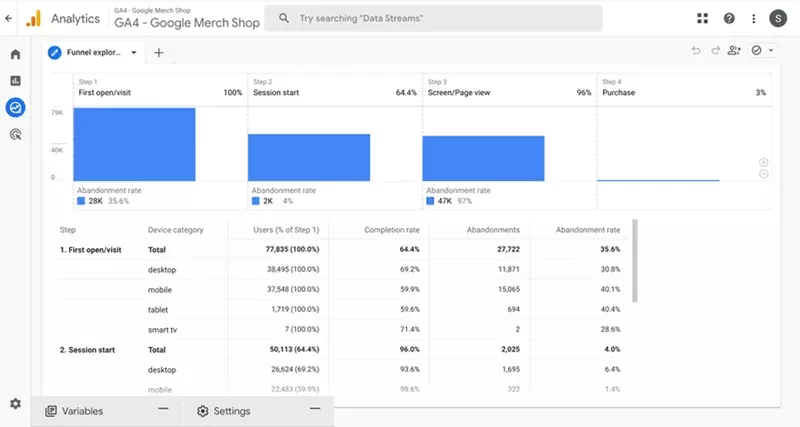
Google Analytics is best known for its web analytics features, even though you can now use it to track in-app events as well.
GA’s funnel analysis functionality is particularly useful for marketing teams seeking to optimize their marketing campaigns and customer acquisition channels.
For instance, you could use it to track conversions on your landing pages or evaluate different sources of web traffic, like paid ads, referrals, or organic searches.
Want to know the best part?
The majority of GA core features are free to use.
Conclusion
Funnel analytics is a powerful tool enabling teams to understand how users interact with the product at different stages of the customer journey. Such insights help them optimize the user experience to boost conversion rates at key touchpoints and improve product performance.
If you want to learn more about Userpilot’s funnel analytics, book the demo!


