![Mixpanel Cohorts: An In-Depth Review [+ Alternative] cover](https://blog-static.userpilot.com/blog/wp-content/uploads/2023/10/mixpanel-cohorts-an-in-depth-review_14dbde9a4099ea47b4ea9483309b817e_2000-450x295.jpg)
What are Mixpanel cohorts, and how to use them to gather actionable insights?
That’s the key focus of this article.
We also look at the pros and cons of using Mixpanel cohort reports and the reasons you may want to consider an alternative product analytics tool for this job!
Ready to dive in?
Try Userpilot Now
See Why 1,000+ Teams Choose Userpilot

What are Mixpanel cohorts?
Mixpanel cohorts are clearly defined groups of users sharing specific characteristics, for example, behavioral, demographic, or technographic ones.
For example, a cohort may consist of users who interacted with a specific feature a set number of times over a period of time. Like ‘sent 5 video messages this Monday’.
What is the difference between segment and cohort in Mixpanel?
The terms ‘segment’ and ‘cohort’ are often used interchangeably because they both describe a group of people with common characteristics. However, these two are not the same.
Segments are simply a broad group of users defined by a property.
For example, a segment could consist of all the users who performed an action, like completing an onboarding checklist or engaging with a feature.
Such grouping is dynamic. Whenever new users complete the same action, they’re added to the segment.
Cohorts, on the other hand, are more specific because they group users based on both events and time periods. For instance, a cohort could be made up of users who signed up for a free trial in the week commencing on 16 October 2023.
The clearly defined time makes cohorts static – once the time period is over, new users can’t join it anymore. This means a specific cohort will always consist of the same users.
Different types of cohorts you can monitor in Mixpanel
Mixpanel allows you to create cohorts based on events and user attributes.
Events are the actions that users complete while user attributes are people’s properties like their geographical location or the device they use.
What’s important is that you can use multiple criteria to define your cohorts. For instance, you could group users who completed an onboarding flow in the last 7 days and did it from a Windows PC.
Here are some cohorts examples:
- Power users – used the app every day this week.
- Active users – used the app at least once this week.
- Inactive users – used the app last month but not this month.
- Free users – users who are on the free plan.
How do I create a user cohort report in Mixpanel?
The easiest way to create user cohorts in Mixpanel is through reports.
Let’s see how to do it through the Retention report.
Step 1. From the top menu, click on Reports and choose Retention.
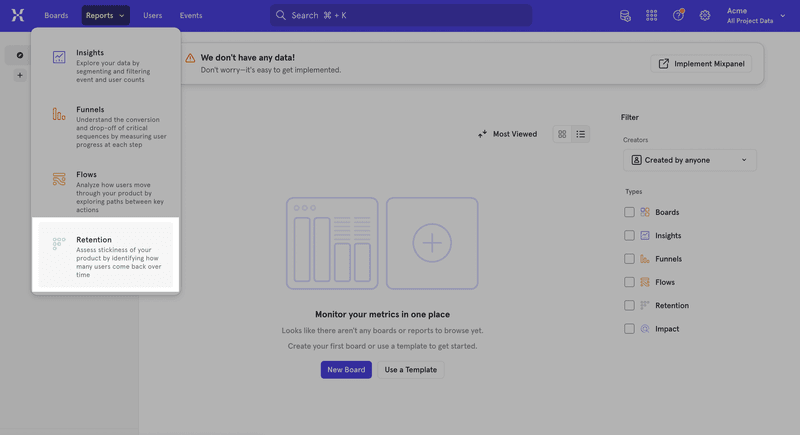
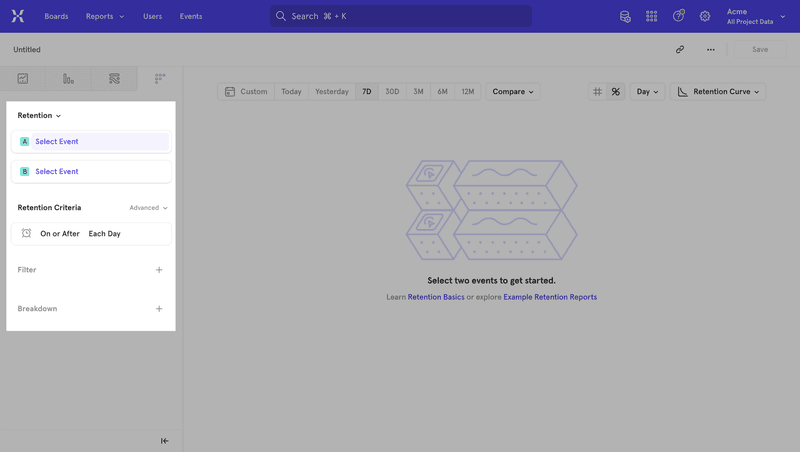
Step 2. Define the events, for example, Sign Up or Open App.
Step 3. Define the retention criteria.
That’s where you choose the time frame (Daily, Weekly, Monthly or custom).
You can choose from ‘On or After’, which is better for general retention analysis, and ‘On’ if it’s important for the event to take place on a specific day, for example, On Day 3 after sign-up.
For more granular insights in the retention table, you have the option to filter the data and break it down by specific criteria. For example, your breakdown could be based on the department where users work.
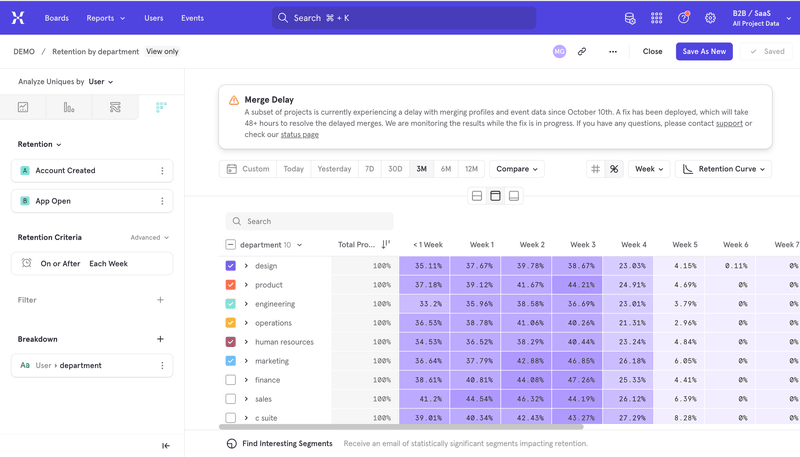
Step 4. Save individual cohorts for further analysis.
Mixpanel cohort analysis use cases for understanding user behavior
What are the benefits of using Mixpanel cohort analysis?
Let’s look at a few common use cases.
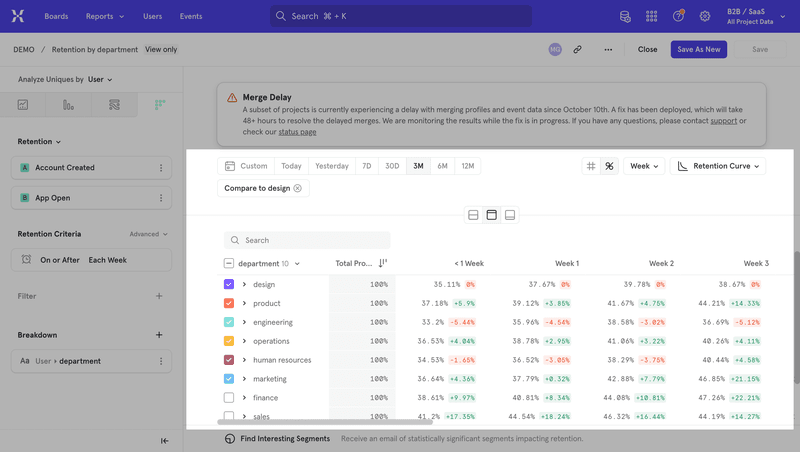
Compare how specific cohorts engage in-app
Cohort analysis can help you identify differences in in-app engagement between different user groups and/or a broader user population.
This can help you answer questions like ‘Are new users adopting a feature faster than existing ones?’ or ‘Are power users upgrading to premium plans more than active users?’
Identify where groups of users drop off from the journey
Cohort analysis can also help you pinpoint where users drop off the user journey and how.
For instance, if you see that user churn dramatically increases on certain days, you can trace it back to specific events or product changes.
When combined with funnel analysis, cohort analysis can also help you identify the exact stage in the user journey where users experience friction and its causes.
It can also help you find solutions. For example, if one user cohort doesn’t experience the same drop-off rate as others, you can analyze the behavior to identify key differences in how they interact with the product.
Determine where improvements are needed in the product experience
Cohort analysis can help identify the areas for improvement and then evaluate the effectiveness of changes.
Let’s imagine that your new users churn en masse only a few days after signing up. This could be an indication that your onboarding doesn’t deliver and users fail to activate.
You decide to modify the onboarding flow by adding a checklist.
After launching the reviewed onboarding process, you compare the retention figures from the past with data for the cohorts that sign up afterward to see if it works.
Pros and cons of using Mixpanel cohorts
What are the main strengths and weaknesses of Mixpanel cohorts?
Here’s a breakdown of the main ones.
Pros of Mixpanel cohorts
- You can create cohorts based on multiple events and a whole host of user properties.
- In conjunction with Mixpanel reports, cohorts enable a granular analysis of user behavior to inform product improvements.
- It’s one of the most intuitive analytics tools around and boasts a clear and user-friendly UI.
Cons of Mixpanel cohorts
- Creating cohorts can be time-consuming and tedious.
- In general, Mixpanel has a steep learning curve and may not be suitable for non-tech teams.
- In the free plan, you can create cohorts but not save them for future use. This reduces its usefulness for smaller SaaS businesses.
- The pricing structure is inconsistent and can be confusing.
How much does Mixpanel cost?
Mixpanel offers 3 pricing plans. Here’s what the pricing page shows:
- Free – allows tracking of up to 20M events a month and includes all core reports.
- Growth – starts from $20/month for up to 100M monthly events and unlimited saved reports and cohorts.
- Enterprise – starts from $833/month for up to 1T monthly events, unlimited advanced analytics reports, and advanced data governance controls.
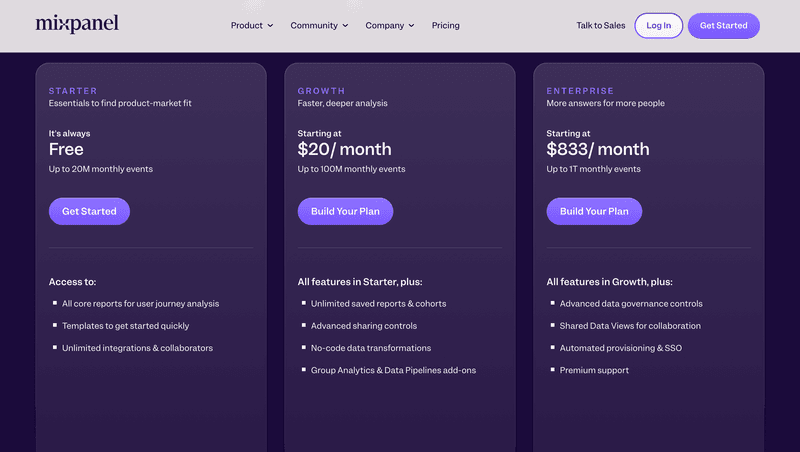
Looks transparent, right?
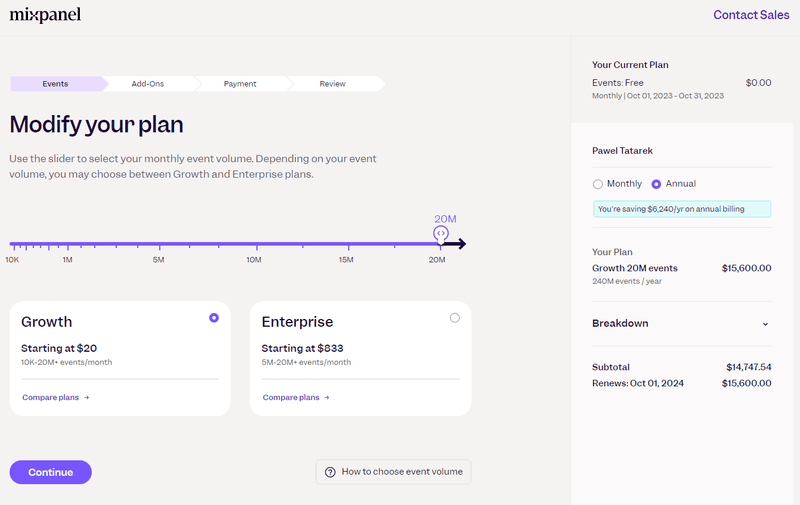
Well, click on the Build Your Plan button.
It takes you to a calculator, where you can customize your usage limits. It turns out that the Growth plan goes only up to 20M, not 100M, events.
Talking about events… Do you know how many you will need to track?
You may have an idea of how many users you want to track, but events are way more difficult to estimate accurately.
What do users say about Mixpanel cohorts?
Mixpanel enjoys an average rating of 4.6/5 on G2, which is higher than its main competitors like Amplitude or Heap.
Mixpanel cohorts are mentioned a lot in user reviews.
For example, users find it particularly useful for in-depth user behavior analysis and reporting:
The cohorts feature is especially useful for creating reusable groups for analysis and reporting.
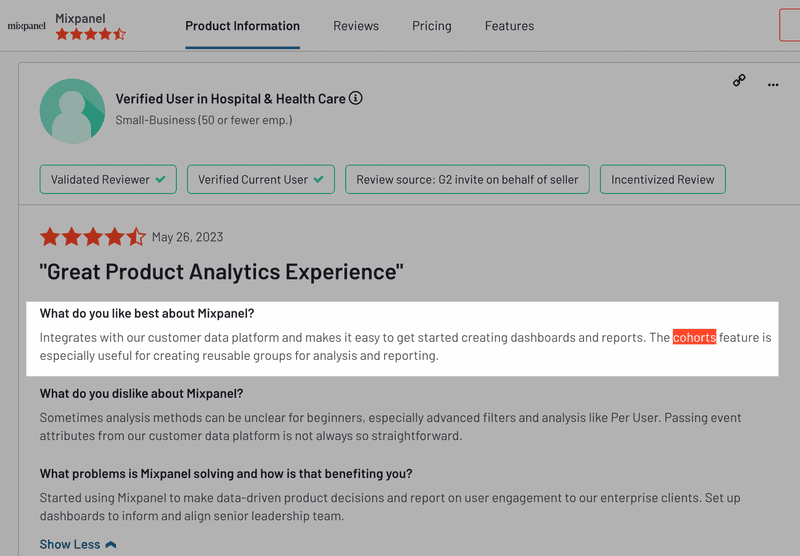
The cohorts feature also helps companies to target their users more accurately with ads and messages.
However, some users also report that the functionality isn’t easy to set up, and it takes a lot of time to get the insights they need:
Cohorts handling is tedious – creating cohorts is slow and painful. Filtering and breaking down by cohorts is time-consuming (selecting each cohort twice, default setting of ‘not in XYZ cohort’ is pointless to me).
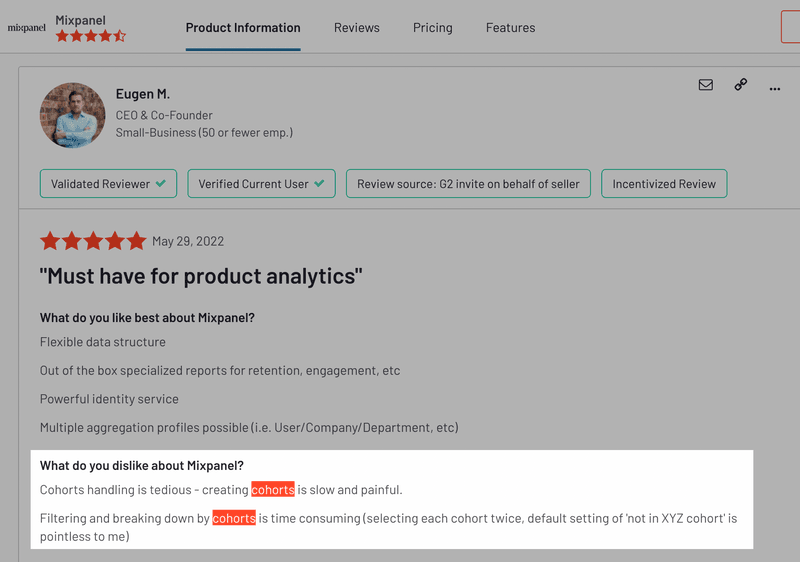
What’s more, users mention that it keeps cohorts organized if there are a lot of them, and the filtering options aren’t always reliable.
Why should you choose an alternative tool for cohort analysis?
There’s no doubt that Mixpanel is an excellent analytics solution that offers top-notch functionality and this includes the cohort analysis features.
However, non-technical teams with limited experience in data science may find it overwhelming. It may also not be very affordable for smaller and medium-sized companies.
If you’re considering an alternative analytics tool, Userpilot may be worth exploring.
Userpilot vs. Mixpanel: The better product analytics tool for cohort analysis
Userpilot is a product growth platform that offers a whole host of advanced analytics features:
- Code-free feature usage and custom event tracking
- A/B testing
- Trends analysis
- Funnel analytics
- Custom dashboards (coming soon)
- User segmentation
- Retention analysis
Let’s look at the last two as they’re most relevant in this context.
With Userpilot segmentation, you can group users based on properties like:
- User attributes (like name, ID, plan, web sessions, device type, or signup date)
- Company data
- Tagged features they have engaged with
- Custom events they’ve completed, both those set in Userpilot and API ones
- In-app experiences they’ve engaged with like flows or checklists
- User feedback (both quantitative, like NPS scores, and qualitative, like NPS responses)
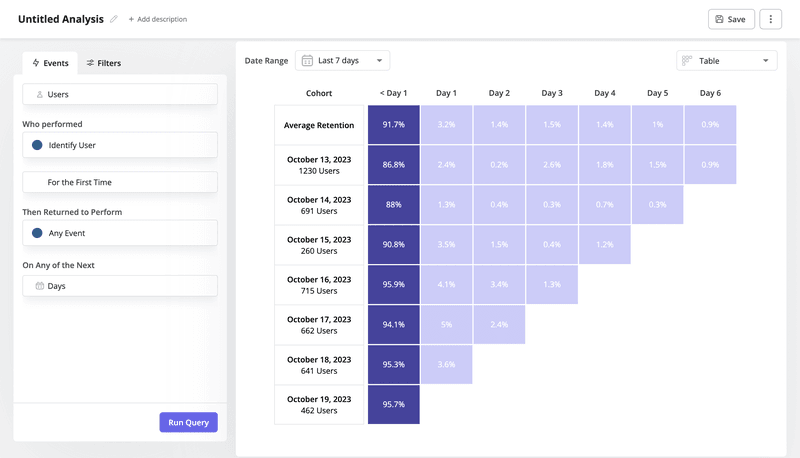
Can you replicate the Mixpanel cohort functionality with segments? Yes, by segmenting users based on multiple criteria.
Once you have your segments, you can create a Retention report for each of them, just like in Mixpanel.
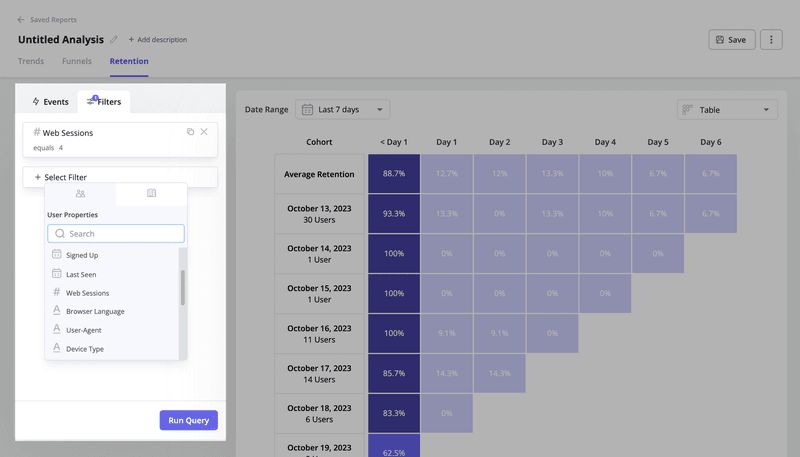
Userpilot allows you to filter the results too.
What’s the main advantage that Userpilot has over Mixpanel?
It offers features that allow you to act on the insights.
For example, you can use it to improve activation and retention with contextual in-app messages.
How much does Userpilot cost?
Userpilot offers flexible pricing based on your monthly active users (MAUs). Plans start at $299 per month for smaller teams and scale as your user base grows.
Below are the pricing tiers you can choose from:
- The Starter plan begins at $299/month (billed annually) for up to 2,000 monthly active users. It includes in-app user engagement, usage trend analysis, NPS surveys, and essential product analytics—ideal for mid-market SaaS teams getting started.
- The Growth plan offers custom pricing and adds advanced analytics, retroactive event auto-capture, in-app surveys, session replay, and more. It’s the most popular choice for growing teams that need deeper insights and scale.
- The Enterprise plan offers custom pricing and includes everything in Growth, plus bulk data handling, custom roles and permissions, SOC 2 Type 2 compliance, and enterprise-level support.

Conclusion
Mixpanel is a powerful analytics tool and its Cohorts features, when combined with retention and funnel analysis, offer product teams in-depth insights into user interactions and journeys.
However, the Free plan offers limited functionality when it comes to cohort analysis and the paid plans may not be affordable for small or medium-sized companies. What’s more, non-technical users may find it challenging to set up and use.
If you want to see how Userpilot better solves the same problems as Mixpanel cohorts, book the demo!


