How to Measure Product Adoption in 2026: Metrics for Human Users and AI Agents


Product adoption measurement has been a fairly straightforward process for most of my career. Just track the right metrics, watch for drop-off, and fix what’s broken. Then AI agents started showing up in our customers’ accounts and now several of those metrics are telling a different story than the one product teams think they’re reading. As of 2026, 85% of enterprises and 78% of SMBs are already deploying AI agents in their SaaS tools. Those agents then call APIs, trigger workflows, and generate product events around the clock.
Their adoption signals look nothing like what a human user would produce.
The standard product adoption metrics we’re familiar with were built to measure humans which often causes them to misread agent activity in ways that can mask real problems. For instance, an account with strong DAU/MAU and climbing usage frequency might actually have 80% of its activity generated by a single agent with no real humans having logged in for weeks or months. Accurate product adoption measurement in the AI era means tracking two populations separately: human signals and agent signals.
This guide covers the 12 human adoption metrics your team should be using, along with four agentic adoption metrics most teams haven’t added yet (and what each one tells you that human metrics can’t).

Human product adoption metrics
The 12 metrics below were designed to measure product adoption by human and may thus provide unreliable insights if agent activity isn’t filtered out before your team tries to extract insights from the raw data.
Product adoption rate
Product adoption rate is the percentage of new signups who become active users of your core features within a specific timeframe. This metric tells you whether your onboarding is actually moving people toward the product’s core value as well as whether the users you’re attracting are a genuine fit for what the product does.
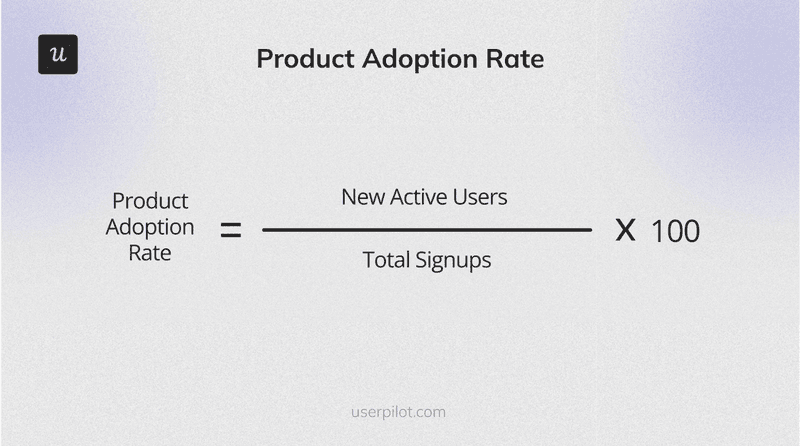
New active users are users who’ve repeatedly performed core feature actions within a defined period while total signups is the number of users who signed up during that same timeframe. If agentic activity isn’t separated from human activity before running this calculation then agent-generated events can inflate the metric and mask low adoption rates amongst humans as a result.
User retention rate
User retention rate is the percentage of users you keep over a specific period which is a reflection of how well your product demonstrates ongoing value. Strong onboarding may get users in the door but retention tells you if they found a reason to stay or not.
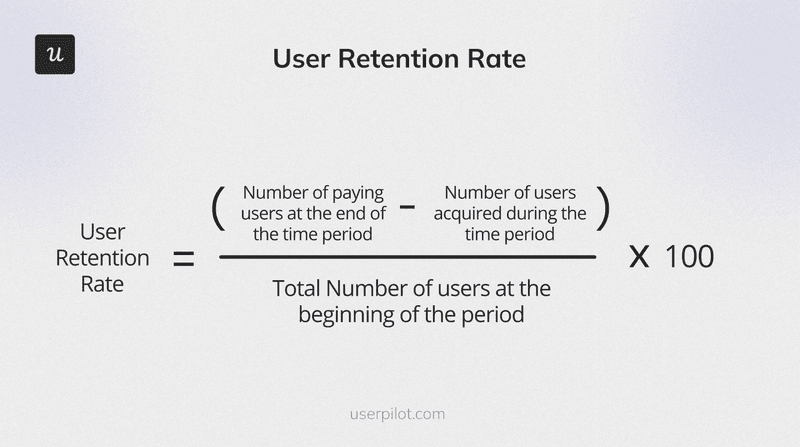
Subtracting users acquired during the period is crucial to isolating true retention from new growth. A retention rate that looks healthy while human engagement is flat is one of the most common patterns for accounts where agentic activity dominates the event stream and handles most of the workload.
Customer churn rate
Customer churn rate is the percentage of users who stop using your product over a given period. It identifies how many users failed to achieve lasting adoption and gives you a starting point for investigating why.
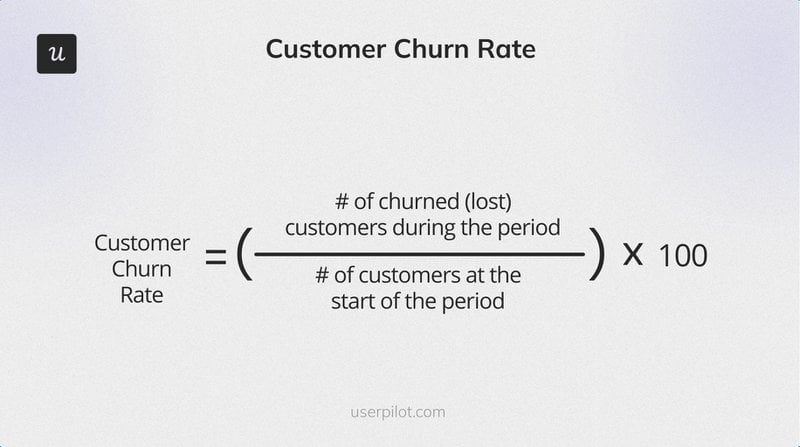
Standard churn metrics only track account-level cancellations, not user-level engagement drops. An account may appear retained purely because agent activity continues despite the actual humans not logging in for months at a time. That’s a renewal risk that the standard churn rate won’t surface on its own unless you’re able to distinguish between human users and AI agents.
Activation rate
Activation rate is the percentage of new users who reach the activation point. Measuring it tells you how effectively you’re driving users to the moment where they first experience genuine product value.
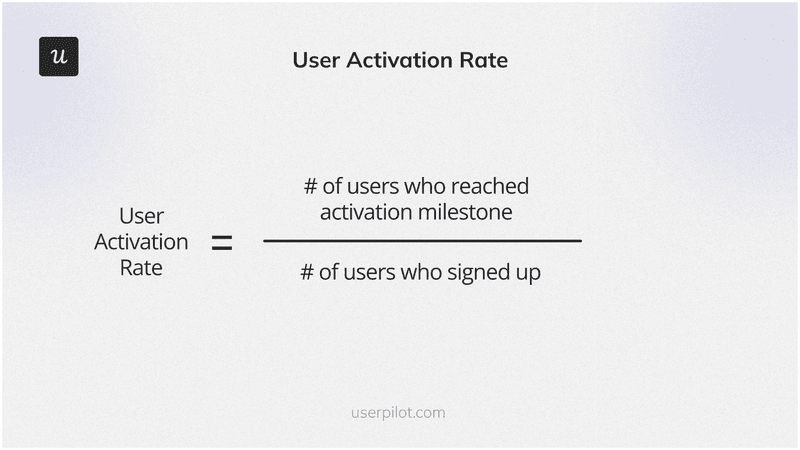
The exact activation milestone varies by product. Sending a first report, connecting a data source, or inviting a teammate are a few examples of activation milestones that you might see in other SaaS products. Defining it precisely is the hard part but once that’s done, funnel analysis makes it a measurable and actionable KPI to watch.
Time to value
Time to value measures the gap between signup and the moment a user first experiences meaningful product value. Shorter TTV is generally better, but the right benchmark depends entirely on how your product delivers value (and to whom).
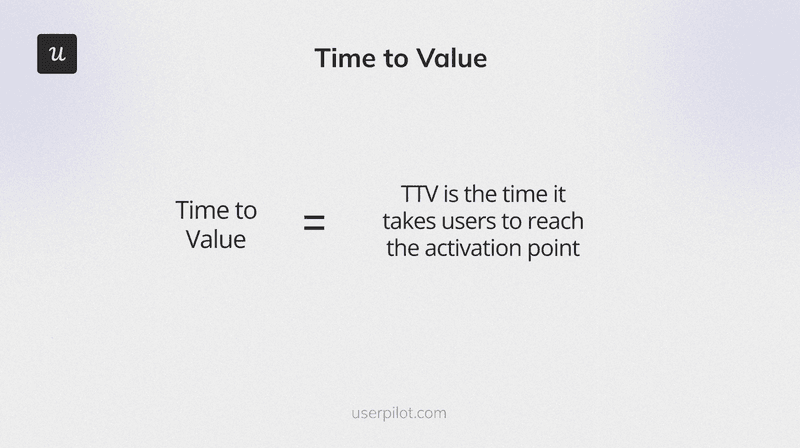
To calculate TTV, first confirm what value looks like. Track feature usage patterns among converted customers and run surveys to identify the most-attributed points of value. You can then measure the average time it takes new signups to reach that event. AI agents don’t have a TTV in the human sense as they’re configured to perform specific tasks and either complete them or don’t. Seeing as its a binary pass/fail, tracking whether the agent was able to complete the task on its first attempt is usually the best approach (more on this below in our dedicated section on agentic adoption metrics).
Average session duration
Average session duration is the average time a user spends engaging with your product per visit. In an AI-assisted product, longer sessions actually signal friction rather than engagement. Someone who spends 45 minutes in your product daily because the workflow is confusing isn’t the same as someone who spends 45 minutes because they’re getting work done.
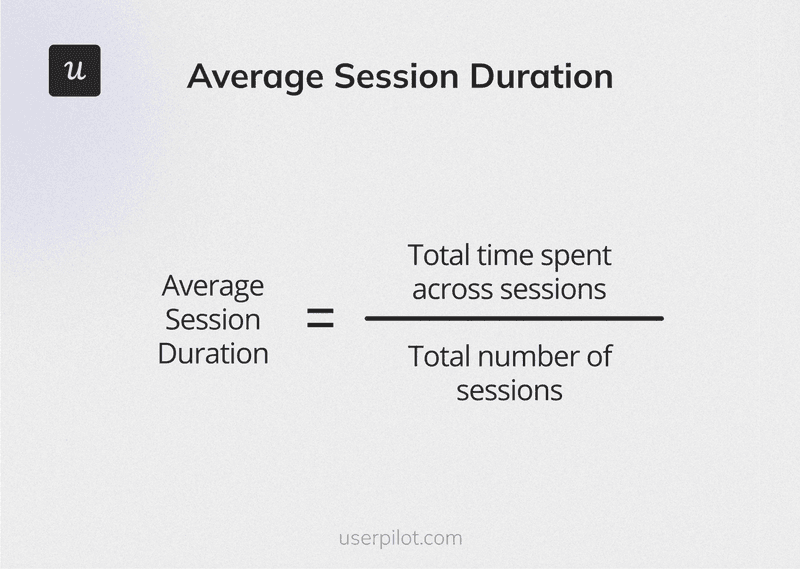
This is a human-only metric as agentic sessions don’t map to human session behavior. Agents execute tasks on a schedule or trigger, not through a browsing session with a defined start and end point. Including agent activity in session duration calculations skews the averages in such a way that at best tells you nothing and at worse actually misleads you into thinking that engagement rates are trending upwards.
Product usage frequency
Product usage frequency measures how often users engage with your product within a specific timeframe. It shows which features get regular use and which are being ignored. This makes it one of the faster signals for spotting disengagement before it turns into churn.
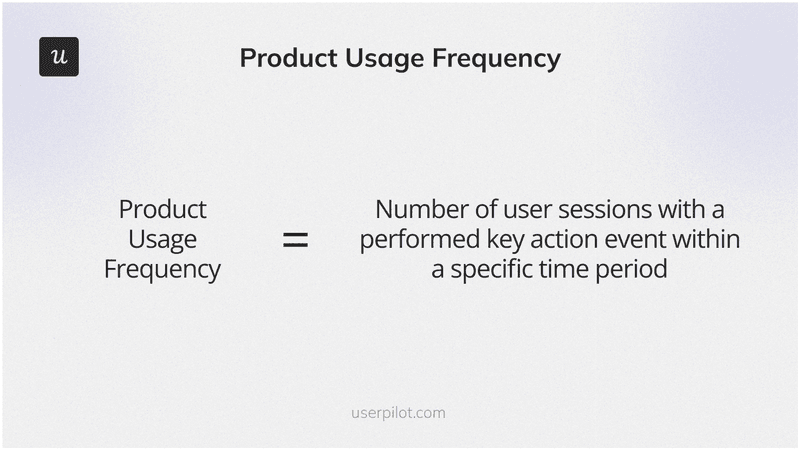
A key action event is product-specific like posting a message, running a report, or uploading a file. If agent events are included in session counts without separation, usage frequency data becomes unreliable for any account with significant agentic activity. An agent running hourly API calls presents like extremely frequent usage on a dashboard but isn’t the same as a human user deriving regular value from the product.
Product stickiness
Product stickiness measures how well your product retains and re-engages users over time by monitoring the ratio of daily active users (DAUs) to monthly active users (MAUs).
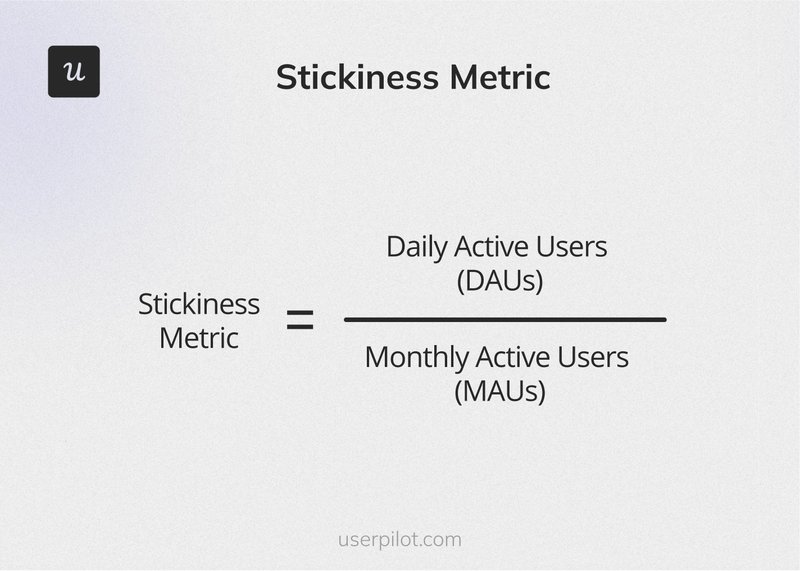
A higher ratio means more of your monthly users return on a daily basis. Agent-driven DAU/MAU always looks artificially high because agents don’t take weekends or holidays and often have recurring tasks scheduled in advance. Accounts with significant agentic activity will show stickiness data that doesn’t reflect human engagement habits. As such, this metric requires agent separation before you can properly utilize it as an account health signal.
Feature adoption rate
Feature adoption rate is the percentage of active users engaging with a specific feature. It tells you which features are actually being used, which are being ignored, and where onboarding gaps might be letting valuable functionality slip through the cracks due to poor feature discovery.
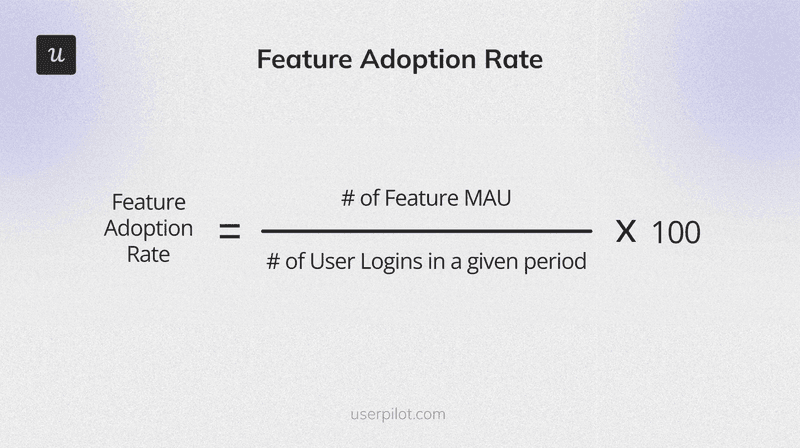
This is one of the metrics I work with most directly in product planning at Userpilot. Whenever a particular feature shows low adoption rates, the next step is always to conduct a funnel analysis and find where are users dropping off. We then follow this up with ay in-app messaging or onboarding checklist task to close the gap without needing to wait for an engineering fix.
Net Promoter Score
Net Promoter Score measures customer loyalty and satisfaction by asking users how likely they are to recommend your product to a colleague. An NPS trending upward generally correlates with strong product adoption while a declining score could uncover friction that users haven’t bothered to raise through other channels yet.
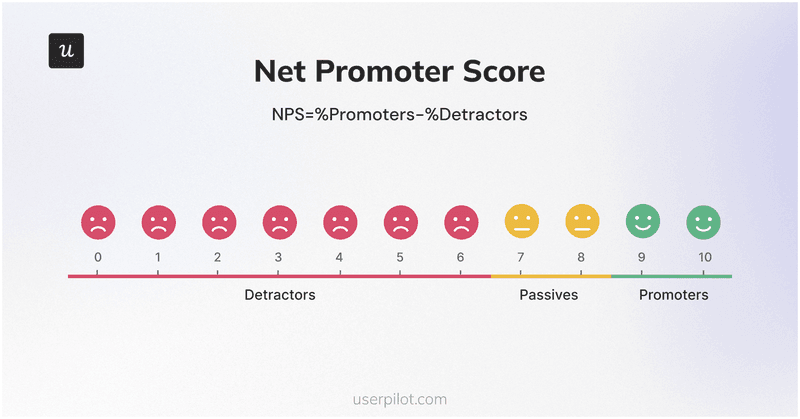
That being said, NPS is a human-only metric as AI agents don’t have the capacity (or interest) to respond to surveys. In accounts with significant agentic activity, your score only reflects human sentiment and thus your sample size may be smaller than the account’s activity volume suggests.
Customer satisfaction score
Customer satisfaction score measures the percentage of respondents who report being satisfied with your product. It helps identify what’s keeping users engaged and where friction might be pushing others toward churn.
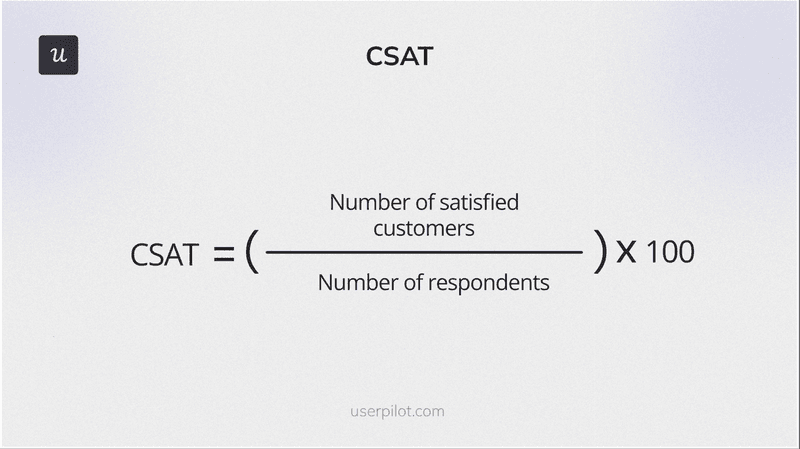
CSAT is human-only for the same reason as NPS: agents don’t complete satisfaction surveys. In accounts where agents drive the lion’s share of activity, CSAT results reflect the experience of a much smaller human cohort than the account’s overall usage volume suggests. You can and should still track it, but treat the metric as a directional signal about your human users rather than an infallible measure of holistic account health.
Customer lifetime value
Customer lifetime value measures the total financial contribution of a customer across their entire relationship with your product. A higher customer lifetime value means users are staying longer, renewing at higher rates, and expanding the size of their contracts. Conversely, lower lifetime value often means there’s a product adoption problem somewhere in the lifecycle that’s negatively impacting retention rates and account expansion.
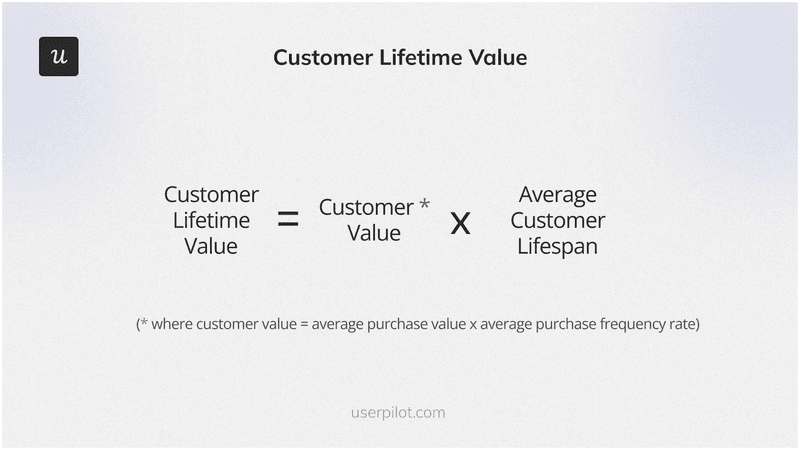
An account driven primarily by agent activity will have different renewal dynamics than one with primarily human engagement. Agents don’t attend QBRs and aren’t the ones who decide whether or not to renew a subscription. Tracking the human-to-agent ratio alongside lifetime value gives you a more complete view of actual renewal risk.
Agentic product adoption metrics
The four metrics below are by no means meant to replace the 12 human product adoption metrics above. They sit alongside them for any product where AI agents are active users (which applies to most B2B SaaS products at this point). Think of them as the measurement layer for the secondary (often unseen) population that your product now serves.
For context on why these metrics deserve a spot in your analytics stack, Gartner projects that 40% of enterprise applications will have embedded task-specific AI agents by the end of 2026. This is a massive jump as the percentage was at less than 5% in 2025. With 85% of enterprises and 78% of SMBs already deploying agents, the window for ignoring agentic product analytics has already closed for most teams.
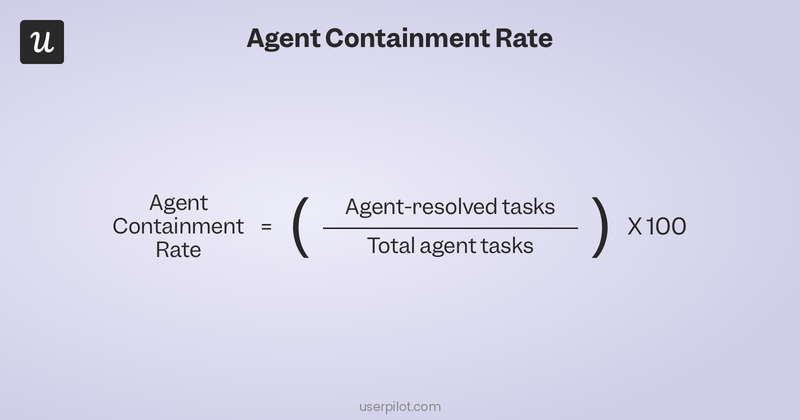
Agent task completion rate
Agent task completion rate is the percentage of tasks that an AI agent successfully finishes out of the total number of attempts it makes. Think of it as the agentic equivalent of activation since an agent that doesn’t complete its tasks isn’t delivering value to the person who deployed it (who will eventually disable or replace it if the workflow continues to be blocked).
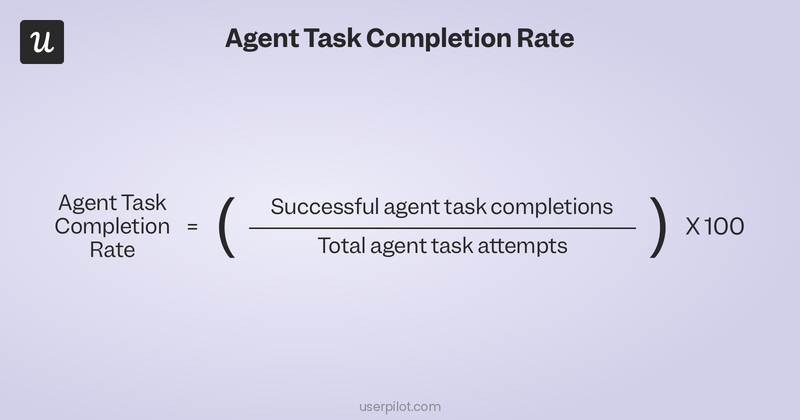
A high volume of API calls or events that don’t result in completed tasks signals agentic adoption failure.
There are usually one of three causes behind agentic adoption failure:
- The agent is misconfigured.
- Task attempts are hitting endpoint errors.
- Your product isn’t exposing the right API coverage for agentic workflows.
You can track this with Userpilot by monitoring agent-specific event streams and completion signals separately from human activity to ensure task completion rates don’t fall below 70%.
Agent prompt volume week-over-week
Agent prompt volume week-over-week is the ratio of this week’s agentic activity compared to last week’s. Growing prompt volume means agents are becoming more embedded in the customer’s workflow, whereas flat or declining volume usually means the agent isn’t delivering enough value to justify continued use by the humans who deployed it.
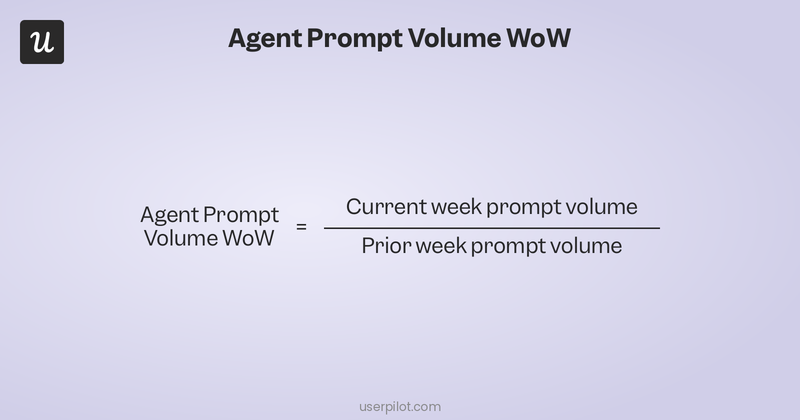
This is the agentic equivalent of usage frequency since it tells you whether the agent is being increasingly utilized over time or quietly deprioritized on the way towards churning. A sustained decline in prompt volume is an earlier churn signal than anything you’ll catch on the human metrics side because it reflects real-time usage data from agents with much higher “engagement” rates.
Carefully monitor this as a trend in Userpilot’s analytics, as two consecutive weeks of declining prompt volume (even in an otherwise healthy-looking account) is a signal you should act on sooner rather than later.
Agent containment rate
Agent containment rate measures how often an agent resolves its task without escalating to a human user or hitting an error state. Strong containment means your product is well-suited for agentic workflows. Poor containment means agents are generating human workload rather than reducing it.
When an agent can’t complete a task without pulling a human in, the product is either missing API coverage, has unclear endpoints, or is being asked to do things that exceed current agentic capability. Using Userpilot to track error and escalation events in agent sessions can help you measure the containment rate without needing to build out a custom query. Low containment at the product level is also a useful signal for the development roadmap as it tells you where agentic capability needs investment.
Human-to-agent usage ratio
The human-to-agent usage ratio is the most important agentic metric for customer success teams because it tells you what share of an account’s total activity is generated by AI agents versus human users. This can change the entire CS playbook depending on which direction it’s skewed towards.
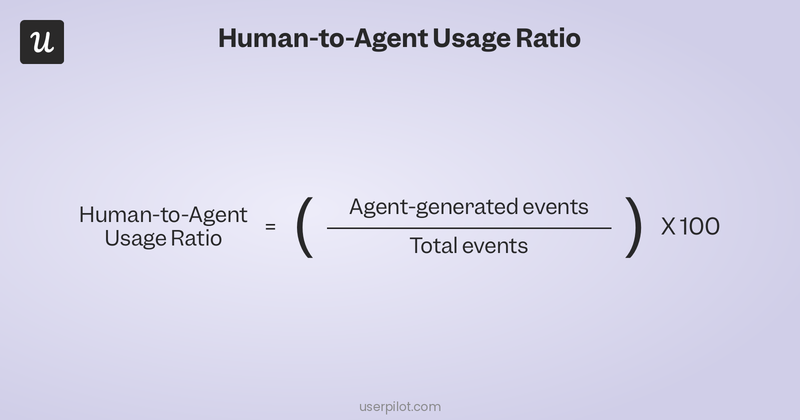
An account that is 80% agent-driven needs infrastructure and API conversations. The humans evaluating that account are assessing agentic capability, not looking for onboarding guidance. Flip the ratio and the entire CS playbook changes: adoption coaching, in-app guidance, activation support become the right moves where they were irrelevant before.
Lia, Userpilot’s AI agent, lets you query across both signal types in natural language so CS and product teams can ask cross-population questions without having to build reports manually.
How to track product adoption metrics
Knowing the 16 metrics above is half the work but tracking them accurately (with agentic activity as a separate population) requires the right setup:
Build funnels to find where users drop off
Funnels let you map specific user journeys through your product, guided by key events. Monitoring drop-off rates at each stage tells you where the biggest friction points are and which fixes are worth testing first.
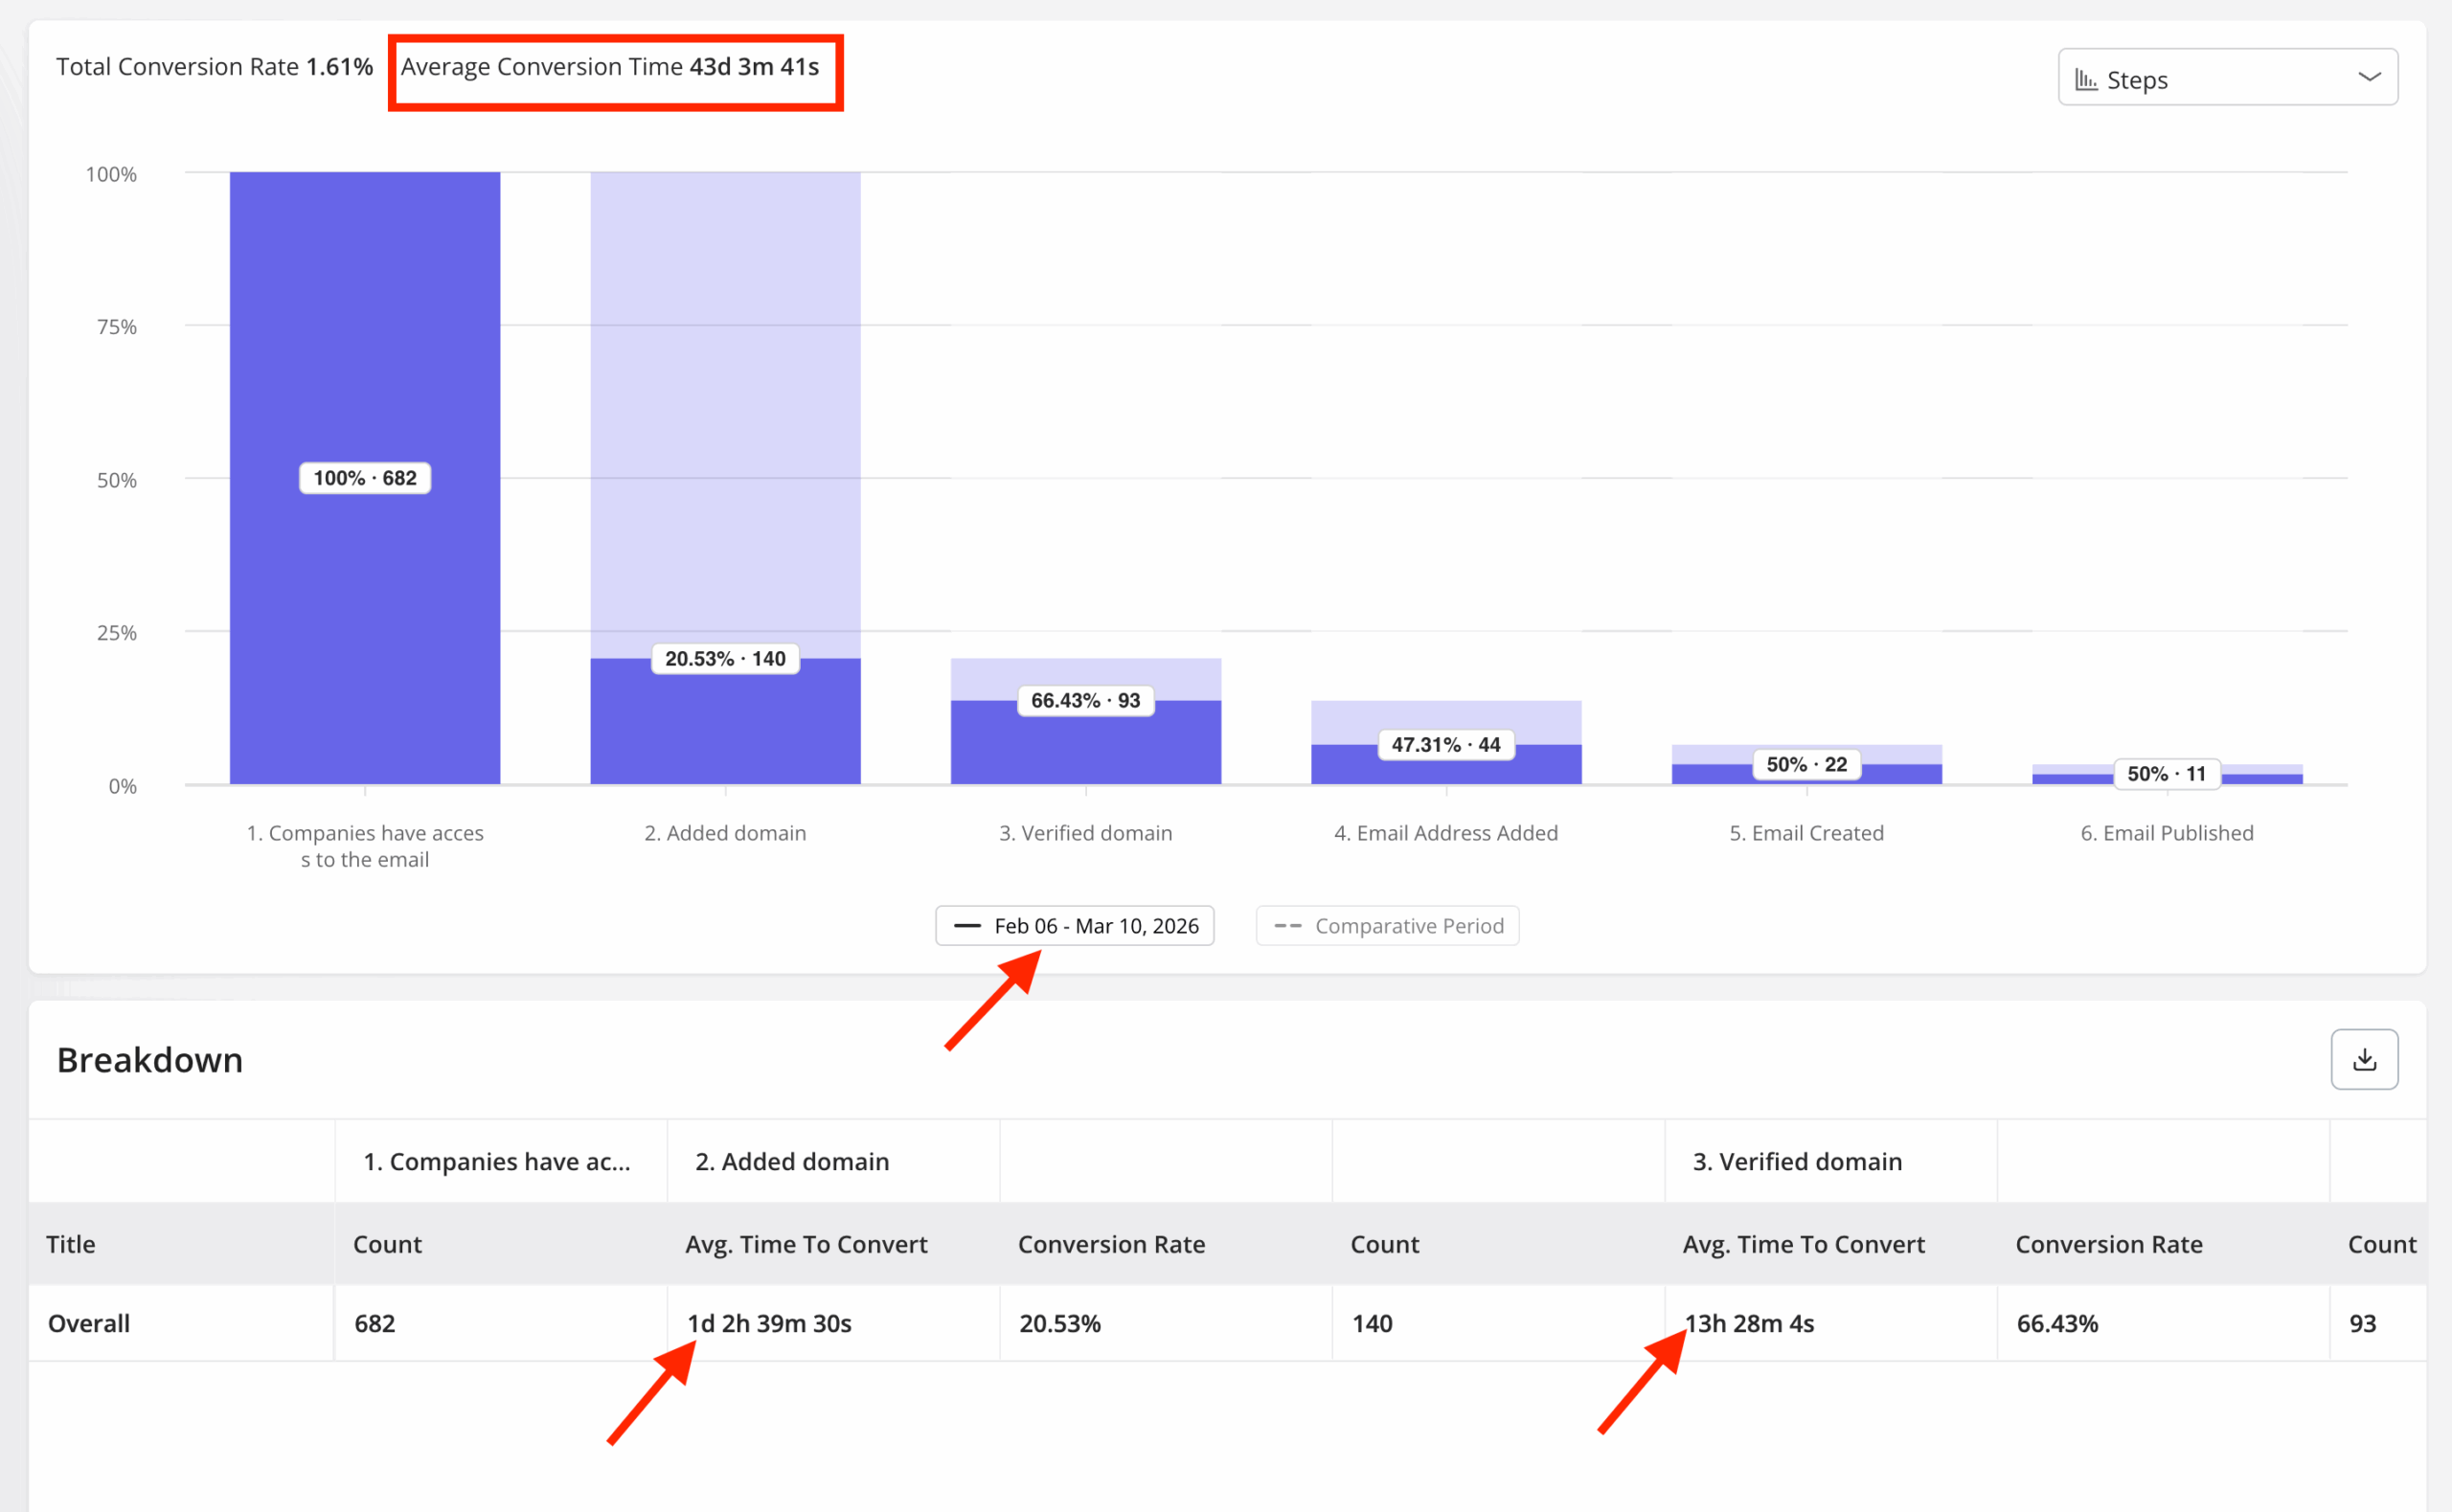
For products where both humans and agents are active, I prefer to build separate funnels for each population so one type of user doesn’t skew data for the other. Trying to combine the two produces a blended picture that does more harm than good seeing as their drop-off patterns are completely different.
Track paths to find the fastest route to value
Path analysis shows you how users actually move through your product by revealing which sequences lead to activation and which dead ends cause drop-off. Once you’ve identified the path with the shortest time to value, you can use it as the default route for new signups.
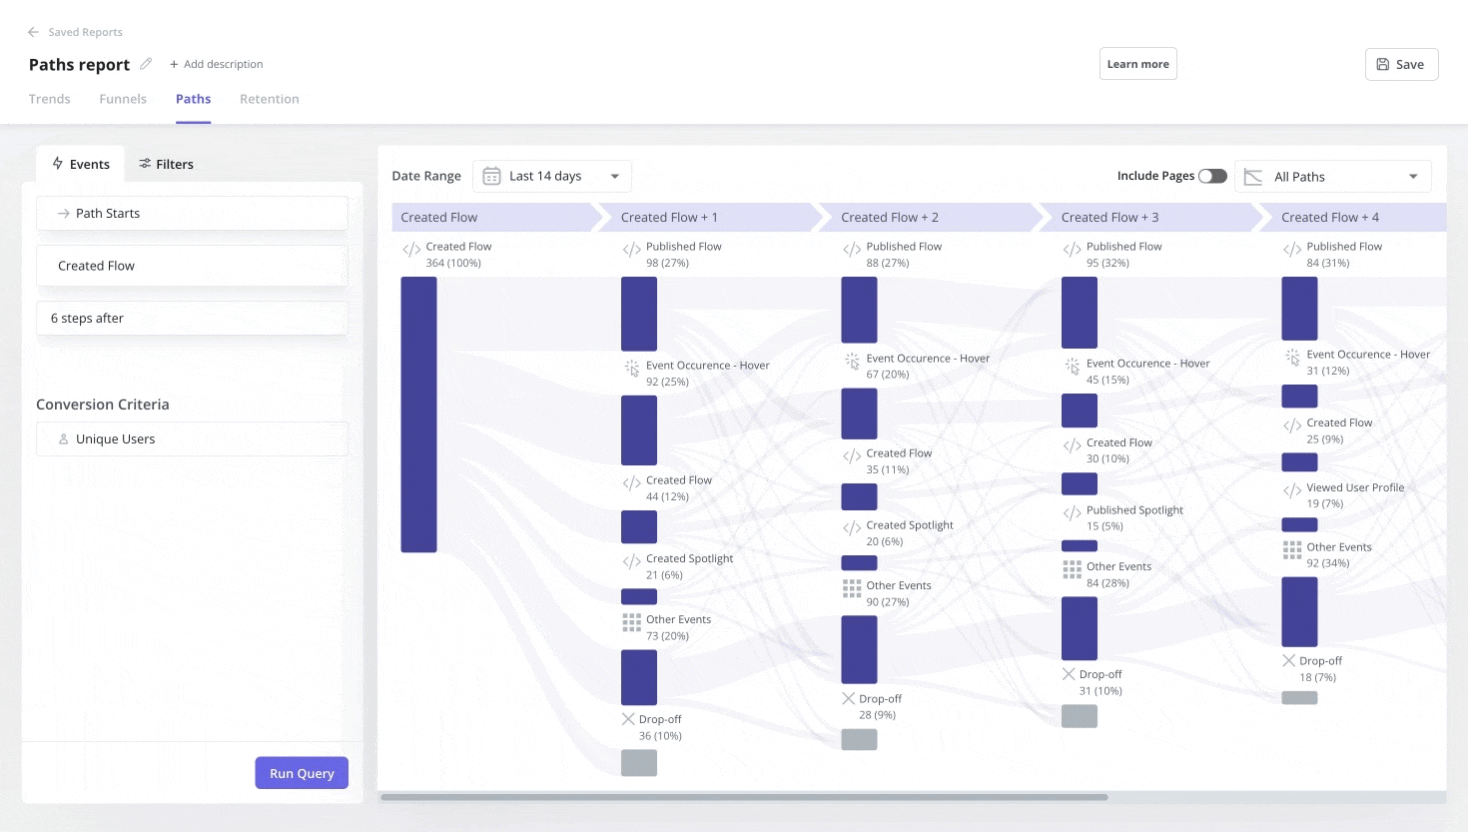
Look for the paths that activated users share but struggling users never take to identify onboarding gaps that need to be fixed. The paths that minimize churn and maximize retention are worth testing to see if they can become the canonical new user flow.
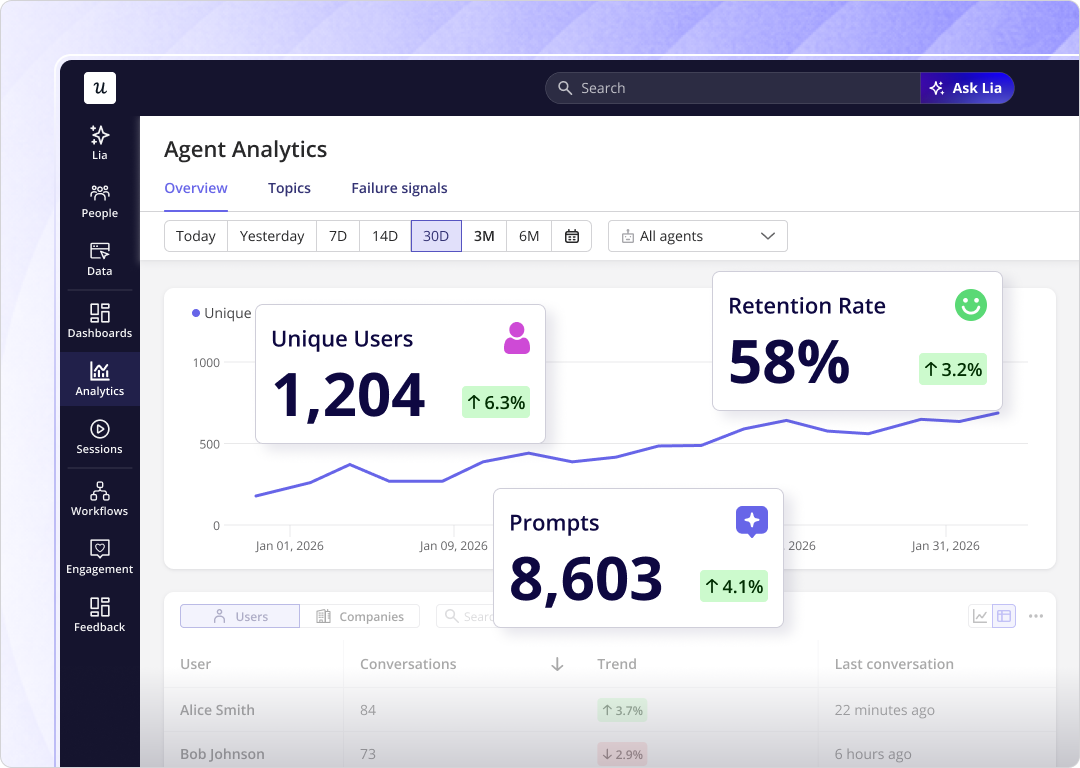
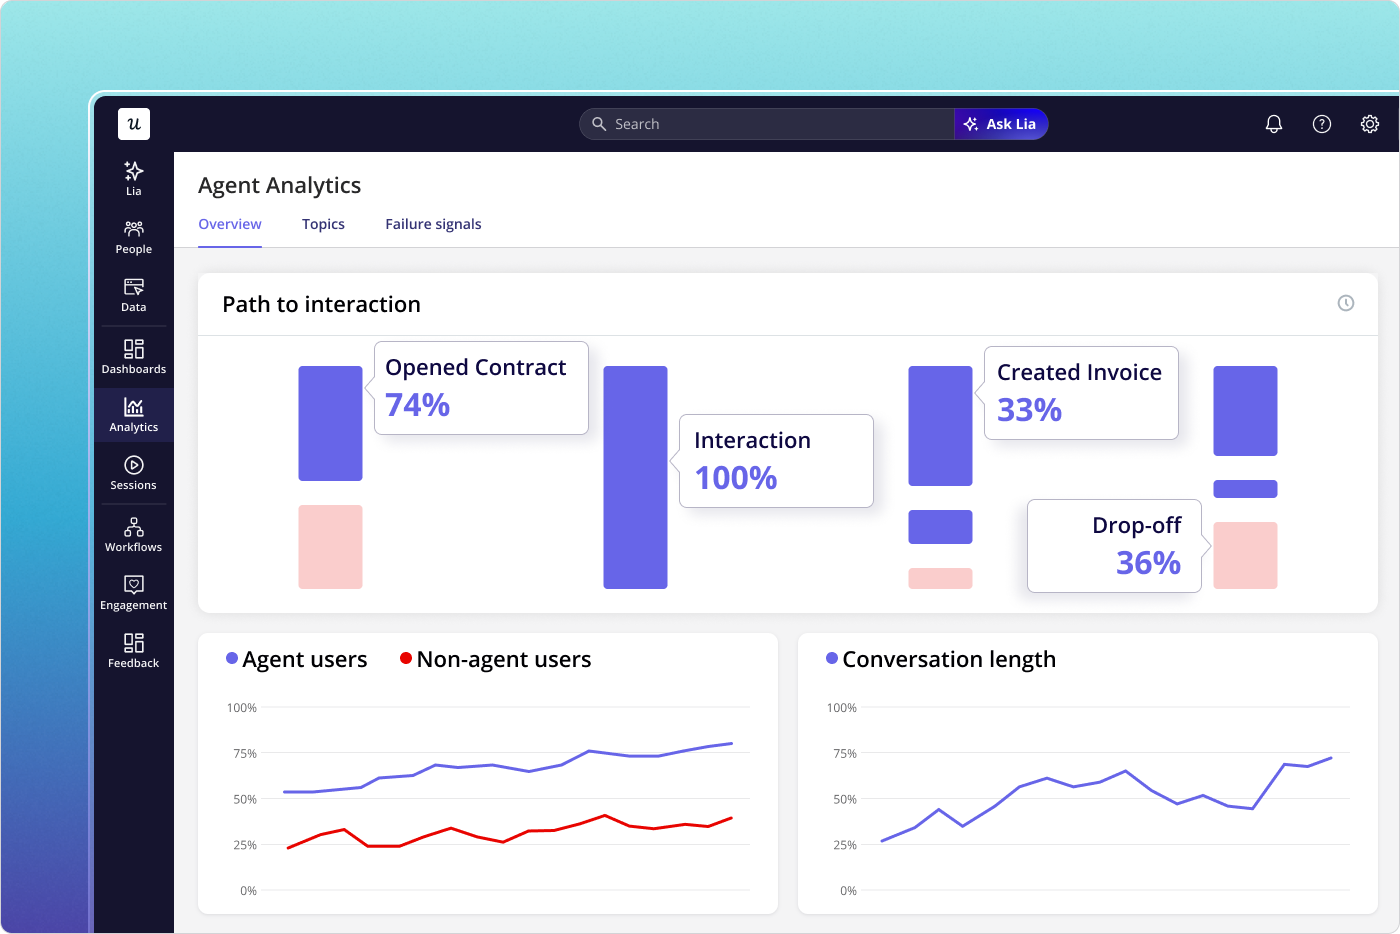
Use Agent Analytics to track key agentic metrics
Userpilot’s Agent Analytics separates human and agent event streams so you can track task completion rate, prompt volume trends, containment rate, and human-to-agent ratio without mixing signals. It’s the measurement layer for the agentic population that most B2B SaaS products now have in their user base (whether they like it or not).
Ask Lia for cross-population queries
Once you’re tracking both human and agent activity, the most useful questions cut across both populations such as which accounts have declining human adoption but stable agent activity, where the agent containment rate lowest, and where that coincides with low net promoter scores from humans. Building those queries manually used to be a slow process that required stitching multiple reports together. Lia, Userpilot’s AI agent, lets you ask these questions in natural language across both user groups. You don’t even need to build the flows manually since Lia can surface the cross-population answers your team needs without a custom reporting build.
16 Metrics, 2 segments, and 1 unified picture of adoption
The 12 human adoption metrics in are still worth tracking and none of them are obsolete. However, several of them are now measuring a mixed population that they weren’t designed for, and that mix is large enough to produce misleading account-level numbers. The four agentic metrics above are what most teams haven’t added yet, but with 85% of enterprises already running agents and 40% of enterprise apps projected to have embedded agents by the end of 2026, the window for treating all users like humans is rapidly closing. Tracking both populations separately is the only way to get an accurate picture of what’s actually happening in your product.
If you want to see how Userpilot lets you track both populations with a single platform, book a demo.
About the author